Model Based Software Timing Analysis Using Sequence Diagram for Commercial Ap...
abstract.visualizingperformance.flowchart
1. Visualizing Decision-Making Workflow
and Performance in Medical Simulations
Steve Pham, MD1
1
University of Pittsburgh School of Medicine, Pittsburgh, PA
ABSTRACT:
Medical simulations provide environments for the evaluation of clinical judgment and timeliness. High-fidelity
simulations use programmable mannequins that log interactions with participants. A log can be used for feedback,
but most of its information is untapped. This poster presents a tool, SimFlow, that extracts actions and temporal
performance from an individual log, compares it to a historical dataset, and visualizes decision-making and
performance in a process-flow model.
BACKGROUND:
Debrief evaluation and feedback depends on a facilitator’s subjective critique, rather than objective data. This
reduces the inter-rater reliability of the simulation’s educational experience.
In an effort to provide more objective data during debriefing, the University of Pittsburgh’s WISER
Simulation Center stored all Laerdal®
SimMan™
simulation XML logs in a relational database. These XML logs
contain observed participant actions with timestamps.
VISUALIZATION:
SimFlow is a browser-based web application developed to parse simulation XML logs for participant action
elements and corresponding timestamp attributes. Its data model assumes observed actions correspond to participant
decision-making, and uses the timestamps for temporal performance benchmarking. SimFlow then queries the
relational database for all historical XML logs of the same simulation scenario. The sampled XML logs are similarly
parsed to generate a catalogue of all possible actions and temporal performance measures.
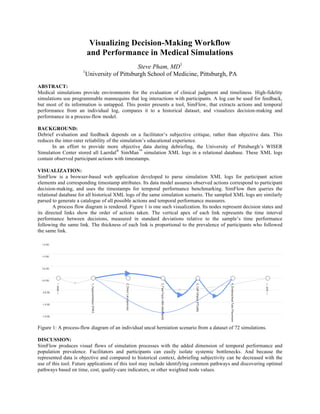
A process flow diagram is rendered. Figure 1 is one such visualization. Its nodes represent decision states and
its directed links show the order of actions taken. The vertical apex of each link represents the time interval
performance between decisions, measured in standard deviations relative to the sample’s time performance
following the same link. The thickness of each link is proportional to the prevalence of participants who followed
the same link.
Figure 1: A process-flow diagram of an individual uncal herniation scenario from a dataset of 72 simulations.
DISCUSSION:
SimFlow produces visual flows of simulation processes with the added dimension of temporal performance and
population prevalence. Facilitators and participants can easily isolate systemic bottlenecks. And because the
represented data is objective and compared to historical context, debriefing subjectivity can be decreased with the
use of this tool. Future applications of this tool may include identifying common pathways and discovering optimal
pathways based on time, cost, quality-care indicators, or other weighted node values.