1. Data Gathering
4
Customer
Data
Service
Data
Plan Data
Claims
Data
Vendor
Footprint
Data
Zipcode
Level NPS
Data
Census
Data
Customer
Level
Experian
Data
Geo-
Level
Experian
Data
Historical
Climate
Data
Customer
Affinities
DER
Footprint
Data
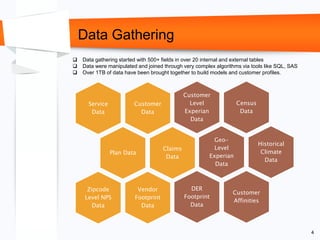
Data gathering started with 500+ fields in over 20 internal and external tables
Data were manipulated and joined through very complex algorithms via tools like SQL, SAS
Over 1TB of data have been brought together to build models and customer profiles.
2. Segmentation Scoring
4
Value-Based
Segmentation
Under Current
Plan
Had Maintenance
Done in Last 36
Mos (4)
No Maintenance
Done in Last 36
Mos (2)
Not Under
Current Plan
Had Maintenance
Done in Last 36
Mos (3)
No Maintenance
Done in Last 36
Mos (1)
Attitudinal
Segmentation
Age
Dwelling
Type
County
Urbanicity
Gender
Length of
Residence
Yrs of
Education
Value-based segmentation is built
using plan penetration and
maintenance history
Segment 4 has historically been the
highest value segment
91% of Customers are not in a plan
and have not had maintenance done
in the past 36 months
38% of Customers have a plan, but
no maintenance over the past 36
months
Attitudinal-based segmentation is built
using customer and housing
demographics and over 100 lines of
code
Sustainable Self-Reliants have
historically been the highest value
segment
45% of Customers are in the Do-it-For-
Me segment
53% of Customers are in the Do-it-For-
Me segment
Smart Shopper
Deal Chaser
Stability Seeker
Do-It-For-Me
Sustainable Self-reliant
3. Modeling Process
4
Prior to May 2014 After May 2014
History (Drivers)
Ever Had a Plan?
Any Claims / Services in the Last
Year?
Any Claims Rejected in Last 24
Months?
Any Replacements in Last Year?
Demographics
e.g., HH Income
Geographic
e.g., In DER
Footprint
Attitudinal
e.g.,
Promoter
Logistic Modeling Engine
Future (Events)
Have A Active Plan?
Renewed Plan?
Upgraded Plan?
Any a Claim/Service?
Had a Replacement?
Current
(Predictions)
Probability of
Buying a Plan in
Next 12 Months
Probability of
Renewal or Upgrade
Probability to Have
1+ Services in Next
12 Months
Probability to have
a Replacement
Given a Service in
the Next 12 Months
4. Viginitile
#
Locations
# Active
DEPP
Plans
% Active
Plans Plan Rate
Lift
(x times
total)
Cumulative
Lift
Current non-
DEPP Holders
Plan
Probability
Expected Plan
(from non-
plan holders)
%
Expected
Plan
Top 5% 74,721 24,148 39.8% 32.32% 8.0 8.0 50,573 29.82% 15,081 29.3%
2 74,717 8,953 14.7% 11.98% 2.9 5.4 65,764 9.93% 6,530 12.7%
3 74,720 5,368 8.8% 7.18% 1.8 4.2 69,352 7.02% 4,867 9.5%
4 74,719 4,206 6.9% 5.63% 1.4 3.5 70,513 5.65% 3,981 7.7%
5 74,733 3,425 5.6% 4.58% 1.1 3.0 71,308 4.76% 3,395 6.6%
6 74,706 2,723 4.5% 3.64% 0.9 2.7 71,983 4.10% 2,954 5.7%
7 74,719 2,186 3.6% 2.93% 0.7 2.4 72,533 3.58% 2,600 5.1%
8 74,719 1,770 2.9% 2.37% 0.6 2.2 72,949 3.15% 2,301 4.5%
9 74,720 1,666 2.7% 2.23% 0.5 2.0 73,054 2.78% 2,033 3.9%
10 74,719 1,439 2.4% 1.93% 0.5 1.8 73,280 2.45% 1,797 3.5%
11 74,719 1,327 2.2% 1.78% 0.4 1.7 73,392 2.15% 1,579 3.1%
12 74,720 1,195 2.0% 1.60% 0.4 1.6 73,525 1.87% 1,377 2.7%
13 74,719 922 1.5% 1.23% 0.3 1.5 73,797 1.60% 1,182 2.3%
14 74,719 805 1.3% 1.08% 0.3 1.4 73,914 1.32% 979 1.9%
15 74,720 549 0.9% 0.73% 0.2 1.3 74,171 0.99% 733 1.4%
16 74,768 64 0.1% 0.09% 0.0 1.2 74,704 0.13% 94 0.2%
17 74,768 0 0.0% 0.00% - 1.2 74,768 0.00% - 0.0%
18 74,707 0 0.0% 0.00% - 1.1 74,707 0.00% - 0.0%
19 74,697 0 0.0% 0.00% - 1.1 74,697 0.00% - 0.0%
Bot 5% 74,656 0 0.0% 0.00% - 1.0 74,656 0.00% - 0.0%
Total 1,494,386 60,746 100.0% 4.06% 1,433,640 4.07% 51,484
Sample Plan Model Performance
2
The top 5% have an active plan rate 8x the overall rate.
The top 15% of households (“Top Tier”) has a active plan rate 4x higher.
Scoring the non-plan households, Top Tier households are 3.5x more likely to take a plan
5. Contact Us
2
If you want to see more or chat about how JD Analytical
can help your business, please contact us:
Phone: 312-533-8268
Email: jdanalytical@att.net
Facebook: www.facebook.com/jdanalytical
Analytics…From Ideation to Execution