
Recommended
Recommended
More Related Content
What's hot
What's hot (20)
Similar to Biopharma VS Small Molecules Therapeutic
Similar to Biopharma VS Small Molecules Therapeutic (20)
More from Stabicon Life Sciences Pvt. Ltd
More from Stabicon Life Sciences Pvt. Ltd (20)
Recently uploaded
Recently uploaded (20)
Biopharma VS Small Molecules Therapeutic
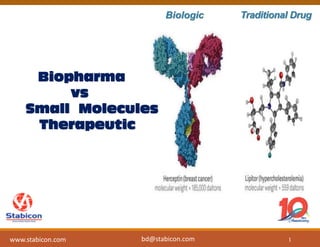
- 1. Biologic Traditional Drug 1 www.stabicon.com Biopharma vs Small Molecules Therapeutic bd@stabicon.com
- 2. Topics Covered : I. Introduction II. Protein Basic Mechanism III. Step in Protein Production IV.Identification and characterization technique V. Monitoring protein synthesis VI.Data Processing Methodology 2 www.stabicon.com bd@stabicon.com
- 4. Therapeutic small molecule being dominant for more than 100 year for treatment then why biologics required for therapeutic ? Why??? 4 www.stabicon.com bd@stabicon.com
- 5. How different they are ? Product Activity Low–high dose High-low dose Production Chemical synthesis Living organism Development Limited Trials Extensive Trials Regulation Non Specfic Specfic Toxicity High Low Elimination Metabolism Endocytosis Structural Folding Not Required Required 5 www.stabicon.com bd@stabicon.com
- 6. What are these? What are these large molecule or biomolecule and how similar are they to human body? What make them so specific and effective? What is the correlation of large/ biomolecule molecule to living machinery? 6 www.stabicon.com bd@stabicon.com
- 7. Mechanism for Signaling Several types of molecule modification are involved in regulation for a signal transfer such as : glycosylation, acetylation,etc 7 www.stabicon.com bd@stabicon.com
- 8. Effect in the body Small molecule rarely elict secondary signaling thus effect prevail until drug adhere to the target site whereas in case of large molecule always elict an secondary signaling hence effect remain even after the drug is eliminated. 8 www.stabicon.com bd@stabicon.com
- 9. Protein Basic Mechanism Chapter –II 9 www.stabicon.com bd@stabicon.com
- 10. Genotype determines phenotype 10 www.stabicon.com bd@stabicon.com
- 11. Central dogma Prokaryotic Cell: DNA – (Transcription) RNA – PROTEIN (Translation) Eukaryotic Cell: DNA – RNA – PROTEIN - PROTEIN MODIFIED (Post Translation) 11 www.stabicon.com bd@stabicon.com
- 13. Protein Structure Primary Secondary Tertiary Quaternary ACDEFGHIKLMNPQRSTVWY primary structure 13 www.stabicon.com bd@stabicon.com
- 14. Therapeutic Protein Production Chapter –III 14 www.stabicon.com bd@stabicon.com
- 15. Biopharma Biopharmaceutical are protein with considerable therapeutic structural diversity. They tend to between 100 to 1000 times larger than traditional small molecule drug . Such complex protein can't be produced using convential chemical synthesis rather than in a living cell under stringently controlled condition. 15 www.stabicon.com bd@stabicon.com
- 16. How are these designed 16 www.stabicon.com bd@stabicon.com
- 19. Examples of Biologics marketed: Insulin Imiglucerase Glucagon Human Growth Hormone Erythropoietin G-CSF Interferon 19 www.stabicon.com bd@stabicon.com
- 20. Chapter –IV Protein Characterization 20 www.stabicon.com bd@stabicon.com
- 21. Characterization Step Primary structure - peptide mapping Glycan analysis Intact Mass analysis Amino acid and media analysis Data processing 21 www.stabicon.com bd@stabicon.com
- 22. How to characterize ? Large scale screening of proteins, their expression, modification and interaction by using high-throughput approaches 22 www.stabicon.com bd@stabicon.com
- 23. Characterization Required for Protein identity (mutant protein) Protein quantity (Expression) Protein post-translational modifications (up or down) Protein structure Protein-protein interaction Protein localization Change in any protein property may cause functional abnormality and might be relevant to pathogenesis. Tools Protein Array Mass Spectrometry 23 www.stabicon.com bd@stabicon.com
- 24. Why Protein by Mass Spectrometry? MS can unambiguously identify proteins Gel separated proteins Proteins in mixture Protein: protein association Identify precise post translational changes Phosphorylation N- or C- terminal modification Many more 24 www.stabicon.com bd@stabicon.com
- 25. Isolation and characterization 25 www.stabicon.com bd@stabicon.com
- 26. Protein Identification Technology Seperation Mass Analysis Data processing 26 www.stabicon.com bd@stabicon.com
- 27. MALDI Ionization Protein or Peptide Mass Spectrometer Mass/Charge (m/z) Ionization Solution Phase Gas Phase Matrix assisted laser desorption ionization (MALDI), Koichi Tanaka 27 www.stabicon.com bd@stabicon.com
- 28. Data Acquisition from MALDI-MSI Alanine, peptide in plasma m/z = 1474.6 Valine, m/z = 1502.7 Alanine Valine 28 www.stabicon.com bd@stabicon.com
- 29. Protein or Peptide Mass Spectrometer Mass/Charge (m/z) Ionization Solution Phase Gas Phase ESI Ionization Electrospray ionization (ESI), John B Fenn 29 www.stabicon.com bd@stabicon.com
- 30. Data Acquisition from ESI-MSI 30 www.stabicon.com bd@stabicon.com
- 31. What is MSE? 31 www.stabicon.com bd@stabicon.com
- 32. How to identify a single protein by MS? Mass/Charge (m/z) Mass Digest into many peptides Mass of many peptides Peptide mass fingerprinting (PMF) Mass of many peptide fragments By Tandem Mass Spectrometry Single protein identification 32 www.stabicon.com bd@stabicon.com
- 33. Protein mixture Analysis by LC-MS/MSy Protein mixture Digestion Peptides 400 800 1200 1600 m/z MS MS/MS 10 20 30 min 0 HPLC Database Searching LLTTIADAAK SAGGNYVVFGEAK EDDVEEAVQAADR All peptide sequences Identification of many proteins 1 sequencing attempt per 0.5 sec. 3600 sequencing attempts in 30 min. 33 www.stabicon.com bd@stabicon.com
- 34. Protein structural Separation •An ion in a compact-form has a high mobility, and hence shorter drift time, •The same ion in a more open conformation has a lower mobility, and hence a longer drift time Gate Detector Neutral Buffer Gas (-ve force) Ring Electrodes (Potential Gradient. +ve force) 34 www.stabicon.com bd@stabicon.com
- 35. HDMS FOR STRUCTURAL SEPERATION OF ISOMER 35 www.stabicon.com bd@stabicon.com
- 36. IMS separation of peptides and lipids No IMS separation IMS selection of peptides IMS selection of lipids 36 www.stabicon.com bd@stabicon.com
- 37. Why Accurate mass? s Intact Protein Mas Digested Protein Mass 37 www.stabicon.com bd@stabicon.com
- 38. Intact Mass Analysis 38 www.stabicon.com bd@stabicon.com
- 39. How to identify a single protein by MS/MS? Peptides Theoretical Spectrum Database searching m/z Ionization MS spectrum MS/MS spectrum Fragmentation Protein digestion Peptide/protein identification m/z m/z 200 400 600 800 1000 1200 m/z K G A F D E L Q LIFAGKQLEDGR b ions 1: L 2: LI 3: LIF 4: LIFA 5: LIFAG 6: LIFAGK 7: LIFAGKQ 8: LIFAGKQL 9: LIFAGKQLE 10:LIFAG KQLED 11:LIFAGKQLEDG y ions IFAGKQLEDGR:11 FAGKQLEDGR:10 AGKQLEDGR :9 GKQLEDGR :8 KQLEDGR :7 QLEDGR :6 LEDGR :5 EDGR :4 DGR :3 GR :2 R :1 A G F D E L G LI K Q Q A 39 www.stabicon.com bd@stabicon.com
- 40. N & C terminal Ions Selected Peptides (parent ions) are fragmented in the of a nebulizing neutral gas. Energy imparted by collision breaks the covalent bond in parent bonds. y & b-type ions series thus generated can give us the sequence of the peptide 40 www.stabicon.com bd@stabicon.com
- 42. Post Translational Identification 42 www.stabicon.com bd@stabicon.com
- 44. Monitor the Bioreactor Media & Protein Synthesis Chapter – V 44 www.stabicon.com bd@stabicon.com
- 47. Amylase Protein Expression 47 www.stabicon.com bd@stabicon.com
- 48. E.Coli Lysate Anal ysis 48 www.stabicon.com bd@stabicon.com
- 49. Batch Analysis Batch 1a Batch 2aB Batch1b Batch2b Batch1c Batch2c difference in proteins Proteins (to identify and quantify proteins in multiple samples) How many proteins ? The choice of method? How many samples? How many variability parameter? 49 www.stabicon.com bd@stabicon.com
- 50. Data processing Chapter –VI 50 www.stabicon.com bd@stabicon.com
- 51. Data processing Using a software product designed to facilitate MS and LCMS analysis of biopharmaceutical samples Intact proteins: Comparison of an entire protein(s) against a well- characterized standard. Identification of differences, and variants that require further investigation (some could be contaminants). Peptide map: Comparison of the peptides resulting from a digested protein against the peptides from the known standard. Identification of differences in protein coverage, modifications,… 51 www.stabicon.com bd@stabicon.com
- 52. What software Does Automates data processing and annotation of experimental results Produces annotated spectra, chromatograms, coverage maps and tabular data Facilitates comparisons between a reference standard and batches of experimental samples Outputs include formal reports, figure copy/paste, and tabular data export Frees users to concentrate on important questions 52 www.stabicon.com bd@stabicon.com
- 53. Intact Protein Chromatogram 53 www.stabicon.com bd@stabicon.com
- 54. 54 www.stabicon.com Protein Charge determination The theoretical peak constructe d with the isotope distribution (purple) and the experiment al peak (green) have the same width at half height. bd@stabicon.com
- 55. Results :Spectra view Stack Overlay Mirror Control :BP_079 non-deglycosylated VICAM Analyte :BP_092 deglycosylated 19h VICAM 55 www.stabicon.com bd@stabicon.com
- 56. Results Spectra view (Intensity filter)zzzz Threshold defined automatically on the spectra T hreshold value typed in the table Filt er applied on the results table 56 www.stabicon.com bd@stabicon.com
- 57. Results: Highlight unique peaks Unique peaks highlighting Deglycosylated T022 fragment (analyte only) Glycosylated T022 fragments (control only) Control :BP_094 non-deglycosylated digested VICAM Analyte :BP_097 deglycosylated 2h digested VICAM 57 www.stabicon.com bd@stabicon.com
- 58. Result : Peak match data comparison analyte/control 58 www.stabicon.com bd@stabicon.com
- 59. Results Peak match data for control (glycosylated) Percentage of each glycosylation state in control Control :BP_079 non-deglycosylated VICAM Analyte :BP_092 deglycosylated 19h VICAM 59 www.stabicon.com bd@stabicon.com
- 60. Results: Peak match data for analyte (deglycosylated ) Percentage of each glycosylation state in analyte Control :BP_079 non-deglycosylated VICAM Analyte :BP_092 deglycosylated 19h VICAM 60 www.stabicon.com bd@stabicon.com
- 61. Results: Peak match data comparison analyte/control You can add your own comments Control :BP_079 non-deglycosylated VICAM Analyte :BP_092 deglycosylated 19h VICAM 61 www.stabicon.com bd@stabicon.com
- 62. PEPTIDE MAP ANALYSIS 62 www.stabicon.com bd@stabicon.com
- 63. Protein digest Chromatogram Processed Control :BP_094 non-deglycosylated digested VICAM Analyte :BP_097 deglycosylated 2h digested VICAM Raw Matched peptides annotation 63 www.stabicon.com bd@stabicon.com
- 64. Results: Differential view Control :BP_094 non-deglycosylated digested VICAM Analyte :BP_097 deglycosylated 2h digested VICAM 64 www.stabicon.com bd@stabicon.com
- 65. Protein digest Analysis List of the raw data file Selected analyte compared with the control Add or remove analyte Set the selected analyte as control Reprocess the data with another method 65 www.stabicon.com bd@stabicon.com
- 66. Annotation of the peptides 1:T001 First chain of the protein Trypsin digestion First digest product of the chain 1:T001* Modified form of 1:T001 1:T001-002 Missed cleavage between 1:T001 and 1:T002 1:T001-3:T001 Disulfide bridge between 1:T001 and 3:T001 66 www.stabicon.com bd@stabicon.com
- 67. Results: Intensity normalisation 67 www.stabicon.com bd@stabicon.com
- 68. Results:Highlight unique peaks Control :BP_094 non-deglycosylated digested VICAM Analyte :BP_097 deglycosylated 2h digested VICAM 68 www.stabicon.com bd@stabicon.com
- 69. Results: Coverage map 69 www.stabicon.com bd@stabicon.com
- 70. Results: Protein digest Mass 70 www.stabicon.com bd@stabicon.com
- 71. Results :Peak match data comparison analyte /control 71 www.stabicon.com bd@stabicon.com
- 72. Results: Peak match data advanced table When a mass can correspond to several peptides, the different possibilities can be seen in the advanced view. 72 www.stabicon.com bd@stabicon.com
- 73. Results: Discrimination between two assignments The sequence corresponding to the fragment 1:T009* of the LC gave a better score than the sequence of 1:T021 If high energy data are available (acquisition with MSE mode), the fragmentation data can be used to discriminate several assignment for the same mass. 73 www.stabicon.com bd@stabicon.com
- 75. Thank you 75 www.stabicon.com Stabicon Life Sciences, #4M-413,1st Floor, Near ICICI Bank, H R B R 3rd Block, Kammanahalli Main Road, Bangalore – 560043, Karnataka, India. Tel: +91 80 41250324 bd@stabicon.com