1. Protein purification-Folin-Lowry assay
Introduction
There were two main aims to the purification; the first was to calculate the total protein concentration
of the cytoplasm fraction before and after ammonium sulphate precipitation, and the second was to
calculate the specific activity of progesterone
The goal of the investigation performed is protein purification which is a series of processes used to
isolate a single type of protein from a more complex mixture within an organ, tissue or cell. These
processes are fundamental for discovering the structure, function, characteristics and interactions of the
protein being investigated. The protein used was standard bovine albumin. At the end of the
purification the protein will be separated from the non protein and all other proteins.
There are many other procedures used in order to measure the concentration of the protein in solutions.
The most widely used is the Folin-Lowry protein assay which was employed in this investigation to
find the protein content in the standard bovine serum albumin and of the unknown.
The procedure depends upon two reactions. The first uses the buiret reagent, which contains potassium
hydroxide(KOH) and copper II sulphate(CuSO4)along with potassium sodium
tartarate(KNaC4H4O6.4H2O) when in the presence of a protein the blue reagent turns violet.
The colour change is caused by alkaline solutions when copper sulphate complex containing Cu2+
ions
form reduced Cu+
ions with the reduced amide bonds of the proteins. Due to the nature of the assay
showing poor sensitivity, a second reaction follows the first. This involves using Folin-Ciocalteu
reagent, which measures the amount of protein needed in order to inhibit the oxidation reagent. It is
composed of phosphomolybate and phosphotungstate. The reduced copper is used to reduce the Folin-
Ciocalteu reagent by tyrosine and tryptophan residues, which have become attached to copper. The
reduced reagent is blue in color hence detectable with a spectrophotometer set in the absorbance range
of 500 nm to 750nm. The reagent increases the sensitivity by approximately a hundred times, for
detecting reduced copper. The assay is only linear over a range of protein concentration from 0µg/ml to
200µg/ml.
Ammonium sulphate precipitation is a method that is considered to make proteins precipitate, or “salt
out” of solutions, which are collected by centrifugation. The protein is solvated, or surrounded by
water, meaning that their solubility can be redecreased at high levels of salt. This is due to salt
behaving as an interference and attracting the water to itself. As a result the protein can “salt out”.
However salt concentrations differ from protein to protein and in order for it to salt out therefore
requiring centrifugation. The process precipitates all proteins that have the same hydrophobicity but
purifies progesterone receptors with a high yield of 70% to 80% with a 20-30 fold.
Method
Materials
For this experiment the following equipment was used;
• Test tube rack
• Test tubes(x16)
• Spectrophotometer
• Gilson pipette-P1000
• Gilson pipette-P5000
• Cuvette
• Labels
• Beaker
• Stopwatch
The reagents used throughout the experiment were;
2. • Standard bovine serum albumin(200 µg/ml)- 10ml
• Solution A, Copper Sulphate (1%w/v)- 1ml
• Solution B, Potassium sodium tartarate(2%w/v)-1ml
• Solution C, Sodium Carbonate (2% in NaOH)- 100 ml
• Folin-Ciocalteu reagent-6 ml
• Unknown 1- 1ml
• Unknown 2- 1 ml
• Deionised water
Procedure
Firstly, the spectrophotometer was switched on and set to a absorbance of 755 nm and let to warm up.
Next, it was necessary to prepare a series of protein standard solutions in duplicate from 0-200µg/ml by
pipetting the required amount of bovine serum albumin standard into a test tube and making up the
volume to 1ml with water.
The two unknown solutions (1 and 2) provided then had to be diluted by a factor of 10 and a factor of
100. From the two diluted unknowns (1+2), 1ml of each of the diluted solutions (in duplicate) was
placed alongside the standard solutions.
Then the 1ml of each of the solutions (A) Copper sulphate (1%w/v) and (B) Potassium sodium tartrate
(2%w/v) were mixed in with 100ml of solution (C) Sodium carbonate (2%w/v in NaOH, 0.1M). Once
theses solutions were mixed, 5ml of this was added to each of the protein standards and the unknowns
at a 30 second intervals.
Afterwards, it was necessary to dilute the Folin-Ciocalteu reagent (6ml) by a factor of 2. Once the
solution was diluted, it was required to add 0.5ml of this solution to each of the test tubes at exactly 10
mins after the previous solution was added. Then the tubes were well shaken and left to stand for
exactly 30mins.
Finally the spectrophotometer was then used to read the optical density of each solution against one of
the blanks. The results obtained were then used to plot a standard graph of protein concentration
against absorbance. From the graph it was now possible to determine the protein concentrations of
Unknown 1 and Unknown 2.
Results
This section illustrates the data obtained or calculated throughout the investigation.
At the start of the experiment protein standards were produced by dilution of standard bovine serum
albumin stock solution with de ionised water. Table 1 shows the amount of deionised water used to
dilute a specific volume of the stock solution in order to achieve the relevnt concentrations, with a total
volume of 1mL each time.
Table 1
For each protein standard solution, and for each of the unknown solutions
STD
solutions(µg/ml)
0 40 80 120 160 200
STD volume(ml) 0 0.2 0.4 0.6 0.8 1
Volume of water
added(ml)
1 0.8 0.6 0.4 0.2 0
3. At their various concentrations, the spectrophotometer was used to determine their absorbance’s after
centrifugation shown below in table 2. the absorbance’s were determined for the duplicates, and an
average absorbance calculated.
Concentratio
n (µg/ml)
0 40 80 120 160 200 U1x10 U1x10
0
U2x1
0
U2x10
0
1 0 0.153 .277 .323 .433 .
459
1.857 .714 .360 .08
2 .001 .140 .268 .329 .413 .
461
1.949 .689 .358 .082
Average
absorbance
0.00
5
0.146
5
0.272
5
0.32
6
0.42
3
0.4
6
1.901
5
0.7015 0.359 0.81
Table 2.
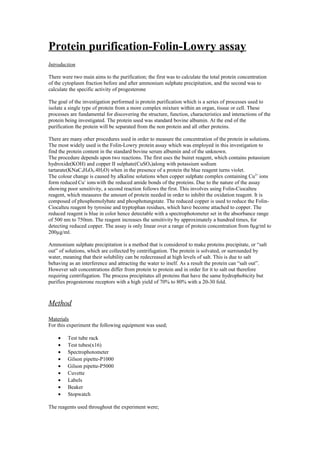
The values from table 2 were used to draw a calibration graph with the use of Microsoft Excel. The
graph is shown below
A calibration graph to show the relationship between the average concentrations of each standard
protein solution agaiinst absorbance
y = 0.0023x + 0.0466
R
2
= 0.962
0
0.1
0.2
0.3
0.4
0.5
0.6
0 50 100 150 200 250
concentration(ug/ml)
absorbance
Using the equation of the line y=0.0023x+0.0466. The concentration of the unknowns
could be found to be and respectively. This was found using the following equation
(for unknown 1)
4. Discussion
Considering the results obtained, there is a positive linear relationship between the
absorbance as the concentration of protein standard increases. Also the R value shows
the degree of error is low. Anomalies in the results may have been caused by
contamination of samples while pippetting. To reduce error and increase reliability of
results the experiments could be done in triplicate.
The purification is considered useful if it causes an increase in the specific activity of
the protein to be purified