1. All Models Are Wrong, Some Are Useful
Mixed Effects Models for Biological Data
Sean Mc Carthy
Introduction
A pervasive issue for applied statisticians
and practicing scientists is the choice and
application of statistical models. Depending on
the hypothesis that are of importance to a
researcher, a variety of statistical models can
be appropriately used on a single data set. In
this project, we consider several models that
elucidate different facets of information from
mice that have received a traumatic brain
injury. The project involves results pertaining
to mixed effects generalized linear and
nonlinear modeling. Specifically, we will
consider logistic regression, mixed effects
logistic regression, three parameter nonlinear
regression, and mixed effects three parameter
Experiment and Data
The data analyzed here comes from an
experiment examining the effects that alcohol
consumption has on recovery from traumatic
brain injury. Thirteen mice were trained to
reliably grab food pellets from an experimenter.
Seven mice were randomly assigned to
receive an acute dose of alcohol and five mice
were randomly assigned to receive a dose of
saline solution. Upon completing the
treatment, the mouse was anesthetized and
given a focal brain lesion to motor cortex.
Over the next 60 days, the mice were tested
on how many food pellets out of 20 they could
successfully grab. The data is longitudinal as it
monitors the mice over time. Furthermore, the
Research Question
Traumatic brain injury associated with alcohol consumption is an unfortunate reality of the modern world.
While some brain injuries can be recovered from, the degree of recovery and speed of recovery are highly
variable. The experiment was designed to examine the length of time needed to regain the ability to perform
a trained task. Two questions were of primary interest. First, did the acute alcohol condition lead to a
difference in recovery when compared to the saline condition? Second, did one group recover in a shorter
time or was no difference in recovery detected? To answer these questions four statistical models were
employed. The models allow us to answer each research question and demonstrate the differences between
Statistical Methods
All analysis was completed using the open source software R and R Studio. The methods used were
logistic regression, mixed effects logistic regression, fixed effects three parameter logistic nonlinear
regression, and mixed effects three parameter logistic nonlinear regression.
Acknowledgment
Loyola Graduate School Research Experience for Master's Programs
Fellowship for the opportunity.
●
Tim O'Brien for mentoring.
●
Ian Vaagenes for data and R coding help.
Works Used
●
Pinheiro, J.C., Bates, D.M.. Mixed-Effects Models in S and S-
PLUS. Springer Inc, Verlag New York. 2000.
●
Bates, D.M.. lme4: Mixed-effects modeling with R. Springer Inc,
New York. 2010.
●
Ian C. Vaagenes , Shih-Yen Tsai, Son T. Ton, Vicki A. Husak,
Susan O. McGuire, Timothy E. O’Brien, Gwendolyn L. Kartje
(2015) Binge Ethanol Prior to Traumatic Brain Injury Worsens
Sensorimotor Functional Recovery in Rats. PloS ONE 10(3):
Results/Discussion
The conclusions from the analysis of the data are surprising. Mice that were
given a single high dose of alcohol before traumatic brain injury generally
recovered more quickly. The mice in the Saline condition averaged five (5) extra
days to recover the ability to successfully reach for food pellets 50% of the time.
These findings are counter to what would be expected. Common sense would
dictate that flooding an animal with a central nervous system depressant before
brain injury should lead to slower recovery and possibly less recovery. The results
found here are completely contrary to common sense. The one time inebriated
mice recovered more quickly and were just as if not more successful than the
sober mice.
The results from this experiment raise several questions:
● What is the mechanism at play in recovery?
● How does alcohol consumption affect neural recovery?
● Are the same results found for long term alcohol exposure?
● Is a sample of 13 mice large enough?
Mechanisms of neural repair have been studied. Like skin tissue, neurons do
show ability to repair and scar. What is less understood is how a onetime large
dose of alcohol could facilitate healthy neuron and brain recovery. It may be that
by delaying a healing response, the damaged neurons have time to regain some
physical proximity that was disrupted. By regaining physical proximity, the
amount of neural repair could be reduced. Further study is required to examine
the mechanisms at work.
As to long term alcohol use, a study by Vaagenes et. al. (2015) demonstrated
that repeated exposure to alcohol caused slower recovery of skills in mice.
While mixed effects modeling can give estimates on a population, an
appropriate sample size is needed. As the poster title indicates, no model is
completely accurate. To verify these results, a replication with a larger sample
size would be needed.
Fixed Effects Logistic Regression
Strictly speaking, using simple logistic regression is not appropriate here due
to the data being longitudinal. The model does not for the repeated
measurements.
●
Model coefficients for Saline treatment (-0.93, 95%CI (-1.11, -0.75)) and the
Saline by Time interaction (0.01, 95%CI (0.009, 0.02)) provide weak evidence
Mixed Effects Logistic Regression
For addressing the first research question about a difference in treatment
groups, this is a more appropriate model.
●
Model coefficients for Saline treatment (-1.09, 95%CI (-1.94, -0.25)) and the
Saline by Time interaction (0.02, 95%CI (0.01, 0.02)) provide stronger evidence
that the acute alcohol condition mice recover more quickly.
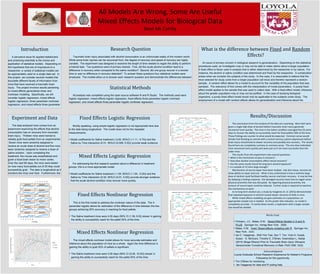
Fixed Effects Nonlinear Regression
This is the first model to address the nonlinear nature of the data. The 3-
parameter logistic allows for estimation of the difference in time between the two
groups achieving 50% accuracy in reaching for food pellets.
●
The Saline treatment mice were 4.05 days (95% CI (1.56, 6.9)) slower in gaining
the ability to successfully reach for the pellet 50% of the time.
Mixed Effects Nonlinear Regression
The mixed effects nonlinear model allows for more accurate estimates and
inference about the population of mice as a whole. Again the time difference in
gaining the ability to grab 50% of pellets is significant.
●
The Saline treatment mice were 5.26 days (95% CI (0.49, 10.02)) slower in
gaining the ability to successfully reach for the pellet 50% of the time.