SlideShare a Scribd company logo
1 of 1
Download to read offline
Background and significance
Characterizing olfactory generalization in Fischer 344 rats using behavioral reaction times
Wendy M Yoder1 Ÿ Olivia Munizza1 Ÿ Leslie Gaynor2,4 Ÿ Ethan Windham3 Ÿ Michelle Lyman4 Ÿ Barry Setlow4,5,7 Ÿ Jennifer L Bizon4,5,6,7 Ÿ David W Smith4,6
1Program in Interdisciplinary Studies, Neurobiological Sciences Ÿ 2Department of English Ÿ 3Health Science Program Ÿ 4Program in Behavioral and Cognitive Neuroscience, Department of Psychology Ÿ 5Department of Psychiatry Ÿ 6Center for Smell and Taste Ÿ 7Department of Neuroscience, University of Florida College of Medicine, Gainesville, Florida
5 5
Behavioral methodology: Operant Chamber
Acknowledgments
References
Modified Operant
Chamber
Odor Port
Odor Stream
Stimulus Behavior Response Measure Observation
Figure 2: Psychophysical principle of reaction time. Reaction times can be used to measure stimulus
intensity. In the illustration above, the hotter the flame, the faster the hand will withdrawal. Similar behavioral
methodology may be applied to odor-guided tasks to create a generalization gradient and increase difficulty.
Stimulus Behavior Response Measure Observation
Figure 4: Procedure for using non-reinforced probe trials. (A) If the rat identifies the mixture (S+ : S-) as the
target (S+), the rat will lick. If the animal decides the mixture (S+ : S-) is NOT the target (S+), the animal will not
lick. (B) How fast the rat licks in response to the mixture is a measure of how certain the rat is that the mixture
(S+ : S-) is the same as the target (S+).
=
Mixture
S+ : S-
Rat Sniffs
S+ or S- ?
Decision: S+
Rat Licks
Delay to
Decide / Lick
Probe smells
like S+
Figure 3: Operant chamber.
Licking in the presence of the
target odorant (S+) results in 5 µl
of liquid reinforcement (Ensure).
Conversely, incorrectly licking in
the presence of the control
odorant (S-) results in a 5 second
time-out; the rat cannot initiate
new trials during this interval.
Reaction times are defined as the
interval from the time of stimulus
onset until the rat makes contact
with the lick tube.4
Behavioral
Biomarker
Several
Limitations
Need Better
Translational
Measures
Odor
Identification
Target
Choices
A) Can rats be trained to “say” POPCORN?
B) Can the odor-guided task be more
difficult to minimize ceiling effects?
• Olfactory changes are an early sign of many forms of neural and cognitive dysfunction.1
• To thoroughly investigate the underlying
mechanisms involved in these processes,
cross-species assessments are needed
that are both sensitive and specific.
Figure 1: Odor identification schematic.
Rodents are frequently used in olfactory research,
but current measures are often not comparable to
olfactory tests used with human subjects.2
Cross-species
Comparisons
Step 1: Obtain thresholds for individual rats
Step 2: Reinforcement (100%) on S+ trials
Step 3: Partial reinforcement (50%)
Step 4: Non-reinforced probe trials
S+ : S- S+ : S- S+ : S-S+ S-
+ + +
Criterion:
100% Accuracyvs.
S+ S-
Criterion:
100% Accuracyvs.
S+ S-
Figure 3: Stimuli Presentation. Each regular block
contains 20 trials (10 S+ and 10 S-). Probe trials (2
per block) are pseudorandomized and presented
during 5 separate sessions (n=10 per mixture ratio).
Individual thresholds are used to generate binary mixtures
Figure 6. Comparison of
individual, threshold
estimates for octanol and
citral. Columns refer to
descending concentrations
(% v/v) of the dilutions.
Each panel/symbol
represents discrimination
accuracy for the target
odorant (octanol or citral) vs.
the odorless, control
odorant (diethyl phthalate).
Lines represent accuracy
across three consecutive
blocks for each
concentration. The lowest
concentration at which the
rat receives 85% or greater
on at least one of the three
blocks is recorded as
threshold. These are used
in subsequent steps to
match intensity levels
between odorants.
Threshold:
Lowest concentration
the rat receives ≥ 85%
vs.
S+ S-
vs.
S-S+
vs.
individual Mixture Probe Trials
Figure 8: Groupmean reaction times (ms) for binary
mixture ratio probe trials. Circles represent mean reaction
times for non-reinforced probe trials containing different
concentrations of citral and octanol. For visual simplification,
only the two highest ratios recorded as S- are shown here.
Figure 9: Individualreaction times for non-reinforced,
probe trials. Each mixture ratio contains 10 probe trials (2
per block) randomized across sessions. Ratios not shown
indicate the rats did not lick – responded to the mixture as S-.
Figure 7: Comparison of mean reaction times (ms) for
reinforced target (S+) trials and non-reinforced, probe
trials of equal concentration (threshold level). Mean
values are not statistically different (i.e., reinforcement
contingency does not affectreaction times).
Funding for this research was provided by NIH R01 AG024671
and the McKnight Brain Research Foundation.
Asymmetrical Response
Aging is a complex process and a key
risk factor for cognitive and neural
dysfunction, but declines are rapid
without early intervention. Researchers
are scrambling to identify biomarkers.
Is olfactory dysfunction
a promising behavioral
biomarker?
This measure could be
included in a battery with
other olfactory tests.
Importantly, our laboratory has expertise
assessing olfactory acuity in both
humans subjects and animal models.
Fischer 344 rats may be an important
piece of the puzzle. As these rats age,
some show cognitive declines that
correlate with olfactory impairments.
Olfactory changes may be predictive.4
For both citral and octanol, reaction times were rapid (~150-200 ms) when the
probe trials consisted of a single, monomolecular component.
Binary mixtures that differed from the target odorant by as little as 1% v/v were
different enough to increase reaction times -- rats hesitated before responding.
Reaction times changed systematically as a function of task difficulty for both
odorants, but the steepness of the generalization gradients depended on the
target odorant presented.
95:5 84:16
Figure 10. Asymmetrical responses.5 Less
citral was required to “suppress” the presence of
octanol than vice versa. On average, animals
ceased responding to the probe trials as the target
at the ratio 95:5 for octanol and 85:15 for citral.
• Probe trials “ask” the rat to respond without the
contingency of reinforcement.
• This measure captures subtle, behavioral
changes and minimizes ceiling effects.
• Mixtures can be more or less complex
depending on the experimental objectives.
Disadvantages
Advantages
• Threshold matching is labor intensive.
• Stimuli interaction effects should be
considered.
1. Atanasova, B., Graux, J., El Hage, W., Hommet, C., Camus, V., Belzung, C. 2008. Olfaction: a potential cognitive marker of psychiatric disorders.
Neuroscience and biobehavioral reviews 32(7), 1315- 25.
2. Doty R, Frye R, Agrawal U. 1989. Internal consistency reliability of the fractionated and whole University of Pennsylvania Smell Identification Test.
Perception & Psychophysics 45: 381-384.
3. LaSarge, C., Montgomery, K.S., Tucker, C., Slaton, S., Griffith, W., Setlow, B., Bizon, J. 2007. Deficits across multiple cognitive domains in a subset of aged
Fischer 344 rats. Neurobiology of aging 28(6), 928-36.
4. Slotnick, B. 2007. Odor-Sampling Time of Mice under Different Conditions. Chemical Senses 32(5), 445-54.
5. Sokolic L, Laing D, McGregor I. 2007. Asymmetric suppression of components in binary aldehyde mixtures: behavioral studies in the laboratory rat.
Chemical senses 32: 191-199.

More Related Content

Similar to Citral Octanol Poster

bioassay-converted.pptx
bioassay-converted.pptxbioassay-converted.pptx
bioassay-converted.pptxChijiokeNsofor
 
Umuc biology 102103 Success Begins / snaptutorial.com
Umuc biology 102103  Success Begins / snaptutorial.comUmuc biology 102103  Success Begins / snaptutorial.com
Umuc biology 102103 Success Begins / snaptutorial.comWilliamsTaylorza23
 
Experimental pharmacology
Experimental pharmacologyExperimental pharmacology
Experimental pharmacologyDr. Akash Jain
 
Notes Ch13
Notes Ch13Notes Ch13
Notes Ch13jmalpass
 
The Nature of Science and Experimental Design- Part 3Instruction.docx
The Nature of Science and Experimental Design- Part 3Instruction.docxThe Nature of Science and Experimental Design- Part 3Instruction.docx
The Nature of Science and Experimental Design- Part 3Instruction.docxcherry686017
 
Lecture 2 Dose Response Relationship 1
Lecture 2  Dose Response Relationship 1Lecture 2  Dose Response Relationship 1
Lecture 2 Dose Response Relationship 1Dr Shah Murad
 
Umuc biology 102103 Massive Success / snaptutorial.com
Umuc biology 102103 Massive Success / snaptutorial.comUmuc biology 102103 Massive Success / snaptutorial.com
Umuc biology 102103 Massive Success / snaptutorial.comReynolds85
 
Expt 3 Bracketing bioassay
Expt 3 Bracketing bioassayExpt 3 Bracketing bioassay
Expt 3 Bracketing bioassayMirzaAnwarBaig1
 
fnbeh-06-00059
fnbeh-06-00059fnbeh-06-00059
fnbeh-06-00059Emily Lenk
 
AUTOMATED MULTIVARIATE ANALYSIS OF PHOSPHOLIPIDOSIS IN PRIMARY HEPATOCYTES US...
AUTOMATED MULTIVARIATE ANALYSIS OF PHOSPHOLIPIDOSIS IN PRIMARY HEPATOCYTES US...AUTOMATED MULTIVARIATE ANALYSIS OF PHOSPHOLIPIDOSIS IN PRIMARY HEPATOCYTES US...
AUTOMATED MULTIVARIATE ANALYSIS OF PHOSPHOLIPIDOSIS IN PRIMARY HEPATOCYTES US...Nick Brown
 
Undergraduate Research Day Poster.compressed
Undergraduate Research Day Poster.compressedUndergraduate Research Day Poster.compressed
Undergraduate Research Day Poster.compressedJuliette Rose
 

Similar to Citral Octanol Poster (20)

Bioassays praveen tk
Bioassays praveen tkBioassays praveen tk
Bioassays praveen tk
 
bioassay-converted.pptx
bioassay-converted.pptxbioassay-converted.pptx
bioassay-converted.pptx
 
Alcohol Presentation2
Alcohol Presentation2Alcohol Presentation2
Alcohol Presentation2
 
Umuc biology 102103 Success Begins / snaptutorial.com
Umuc biology 102103  Success Begins / snaptutorial.comUmuc biology 102103  Success Begins / snaptutorial.com
Umuc biology 102103 Success Begins / snaptutorial.com
 
Experimental pharmacology
Experimental pharmacologyExperimental pharmacology
Experimental pharmacology
 
Notes Ch13
Notes Ch13Notes Ch13
Notes Ch13
 
111135 (3)
111135 (3)111135 (3)
111135 (3)
 
Ld 50
Ld 50Ld 50
Ld 50
 
The Nature of Science and Experimental Design- Part 3Instruction.docx
The Nature of Science and Experimental Design- Part 3Instruction.docxThe Nature of Science and Experimental Design- Part 3Instruction.docx
The Nature of Science and Experimental Design- Part 3Instruction.docx
 
BIOASSAYS.pptx
BIOASSAYS.pptxBIOASSAYS.pptx
BIOASSAYS.pptx
 
Bioassays
Bioassays Bioassays
Bioassays
 
SfN_Poster_2014
SfN_Poster_2014SfN_Poster_2014
SfN_Poster_2014
 
Lecture 2 Dose Response Relationship 1
Lecture 2  Dose Response Relationship 1Lecture 2  Dose Response Relationship 1
Lecture 2 Dose Response Relationship 1
 
Umuc biology 102103 Massive Success / snaptutorial.com
Umuc biology 102103 Massive Success / snaptutorial.comUmuc biology 102103 Massive Success / snaptutorial.com
Umuc biology 102103 Massive Success / snaptutorial.com
 
Bio assay of d-tubocurarine
Bio assay of d-tubocurarineBio assay of d-tubocurarine
Bio assay of d-tubocurarine
 
Expt 3 Bracketing bioassay
Expt 3 Bracketing bioassayExpt 3 Bracketing bioassay
Expt 3 Bracketing bioassay
 
fnbeh-06-00059
fnbeh-06-00059fnbeh-06-00059
fnbeh-06-00059
 
AS Sociology: Experiments
AS Sociology: ExperimentsAS Sociology: Experiments
AS Sociology: Experiments
 
AUTOMATED MULTIVARIATE ANALYSIS OF PHOSPHOLIPIDOSIS IN PRIMARY HEPATOCYTES US...
AUTOMATED MULTIVARIATE ANALYSIS OF PHOSPHOLIPIDOSIS IN PRIMARY HEPATOCYTES US...AUTOMATED MULTIVARIATE ANALYSIS OF PHOSPHOLIPIDOSIS IN PRIMARY HEPATOCYTES US...
AUTOMATED MULTIVARIATE ANALYSIS OF PHOSPHOLIPIDOSIS IN PRIMARY HEPATOCYTES US...
 
Undergraduate Research Day Poster.compressed
Undergraduate Research Day Poster.compressedUndergraduate Research Day Poster.compressed
Undergraduate Research Day Poster.compressed
 

Citral Octanol Poster

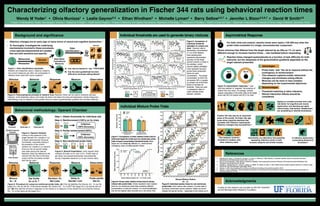
  • 1. Background and significance Characterizing olfactory generalization in Fischer 344 rats using behavioral reaction times Wendy M Yoder1 Ÿ Olivia Munizza1 Ÿ Leslie Gaynor2,4 Ÿ Ethan Windham3 Ÿ Michelle Lyman4 Ÿ Barry Setlow4,5,7 Ÿ Jennifer L Bizon4,5,6,7 Ÿ David W Smith4,6 1Program in Interdisciplinary Studies, Neurobiological Sciences Ÿ 2Department of English Ÿ 3Health Science Program Ÿ 4Program in Behavioral and Cognitive Neuroscience, Department of Psychology Ÿ 5Department of Psychiatry Ÿ 6Center for Smell and Taste Ÿ 7Department of Neuroscience, University of Florida College of Medicine, Gainesville, Florida 5 5 Behavioral methodology: Operant Chamber Acknowledgments References Modified Operant Chamber Odor Port Odor Stream Stimulus Behavior Response Measure Observation Figure 2: Psychophysical principle of reaction time. Reaction times can be used to measure stimulus intensity. In the illustration above, the hotter the flame, the faster the hand will withdrawal. Similar behavioral methodology may be applied to odor-guided tasks to create a generalization gradient and increase difficulty. Stimulus Behavior Response Measure Observation Figure 4: Procedure for using non-reinforced probe trials. (A) If the rat identifies the mixture (S+ : S-) as the target (S+), the rat will lick. If the animal decides the mixture (S+ : S-) is NOT the target (S+), the animal will not lick. (B) How fast the rat licks in response to the mixture is a measure of how certain the rat is that the mixture (S+ : S-) is the same as the target (S+). = Mixture S+ : S- Rat Sniffs S+ or S- ? Decision: S+ Rat Licks Delay to Decide / Lick Probe smells like S+ Figure 3: Operant chamber. Licking in the presence of the target odorant (S+) results in 5 µl of liquid reinforcement (Ensure). Conversely, incorrectly licking in the presence of the control odorant (S-) results in a 5 second time-out; the rat cannot initiate new trials during this interval. Reaction times are defined as the interval from the time of stimulus onset until the rat makes contact with the lick tube.4 Behavioral Biomarker Several Limitations Need Better Translational Measures Odor Identification Target Choices A) Can rats be trained to “say” POPCORN? B) Can the odor-guided task be more difficult to minimize ceiling effects? • Olfactory changes are an early sign of many forms of neural and cognitive dysfunction.1 • To thoroughly investigate the underlying mechanisms involved in these processes, cross-species assessments are needed that are both sensitive and specific. Figure 1: Odor identification schematic. Rodents are frequently used in olfactory research, but current measures are often not comparable to olfactory tests used with human subjects.2 Cross-species Comparisons Step 1: Obtain thresholds for individual rats Step 2: Reinforcement (100%) on S+ trials Step 3: Partial reinforcement (50%) Step 4: Non-reinforced probe trials S+ : S- S+ : S- S+ : S-S+ S- + + + Criterion: 100% Accuracyvs. S+ S- Criterion: 100% Accuracyvs. S+ S- Figure 3: Stimuli Presentation. Each regular block contains 20 trials (10 S+ and 10 S-). Probe trials (2 per block) are pseudorandomized and presented during 5 separate sessions (n=10 per mixture ratio). Individual thresholds are used to generate binary mixtures Figure 6. Comparison of individual, threshold estimates for octanol and citral. Columns refer to descending concentrations (% v/v) of the dilutions. Each panel/symbol represents discrimination accuracy for the target odorant (octanol or citral) vs. the odorless, control odorant (diethyl phthalate). Lines represent accuracy across three consecutive blocks for each concentration. The lowest concentration at which the rat receives 85% or greater on at least one of the three blocks is recorded as threshold. These are used in subsequent steps to match intensity levels between odorants. Threshold: Lowest concentration the rat receives ≥ 85% vs. S+ S- vs. S-S+ vs. individual Mixture Probe Trials Figure 8: Groupmean reaction times (ms) for binary mixture ratio probe trials. Circles represent mean reaction times for non-reinforced probe trials containing different concentrations of citral and octanol. For visual simplification, only the two highest ratios recorded as S- are shown here. Figure 9: Individualreaction times for non-reinforced, probe trials. Each mixture ratio contains 10 probe trials (2 per block) randomized across sessions. Ratios not shown indicate the rats did not lick – responded to the mixture as S-. Figure 7: Comparison of mean reaction times (ms) for reinforced target (S+) trials and non-reinforced, probe trials of equal concentration (threshold level). Mean values are not statistically different (i.e., reinforcement contingency does not affectreaction times). Funding for this research was provided by NIH R01 AG024671 and the McKnight Brain Research Foundation. Asymmetrical Response Aging is a complex process and a key risk factor for cognitive and neural dysfunction, but declines are rapid without early intervention. Researchers are scrambling to identify biomarkers. Is olfactory dysfunction a promising behavioral biomarker? This measure could be included in a battery with other olfactory tests. Importantly, our laboratory has expertise assessing olfactory acuity in both humans subjects and animal models. Fischer 344 rats may be an important piece of the puzzle. As these rats age, some show cognitive declines that correlate with olfactory impairments. Olfactory changes may be predictive.4 For both citral and octanol, reaction times were rapid (~150-200 ms) when the probe trials consisted of a single, monomolecular component. Binary mixtures that differed from the target odorant by as little as 1% v/v were different enough to increase reaction times -- rats hesitated before responding. Reaction times changed systematically as a function of task difficulty for both odorants, but the steepness of the generalization gradients depended on the target odorant presented. 95:5 84:16 Figure 10. Asymmetrical responses.5 Less citral was required to “suppress” the presence of octanol than vice versa. On average, animals ceased responding to the probe trials as the target at the ratio 95:5 for octanol and 85:15 for citral. • Probe trials “ask” the rat to respond without the contingency of reinforcement. • This measure captures subtle, behavioral changes and minimizes ceiling effects. • Mixtures can be more or less complex depending on the experimental objectives. Disadvantages Advantages • Threshold matching is labor intensive. • Stimuli interaction effects should be considered. 1. Atanasova, B., Graux, J., El Hage, W., Hommet, C., Camus, V., Belzung, C. 2008. Olfaction: a potential cognitive marker of psychiatric disorders. Neuroscience and biobehavioral reviews 32(7), 1315- 25. 2. Doty R, Frye R, Agrawal U. 1989. Internal consistency reliability of the fractionated and whole University of Pennsylvania Smell Identification Test. Perception & Psychophysics 45: 381-384. 3. LaSarge, C., Montgomery, K.S., Tucker, C., Slaton, S., Griffith, W., Setlow, B., Bizon, J. 2007. Deficits across multiple cognitive domains in a subset of aged Fischer 344 rats. Neurobiology of aging 28(6), 928-36. 4. Slotnick, B. 2007. Odor-Sampling Time of Mice under Different Conditions. Chemical Senses 32(5), 445-54. 5. Sokolic L, Laing D, McGregor I. 2007. Asymmetric suppression of components in binary aldehyde mixtures: behavioral studies in the laboratory rat. Chemical senses 32: 191-199.