1. THE IMPACT OF A MENTORING/FINANCIAL INCENTIVE PROGRAM ON AT-
RISK HIGH SCHOOL STUDENTS
Sean T. Galvin
Dissertation
Submitted to the Department of Leadership and Counseling
Eastern Michigan University
In partial fulfillment of the requirements for the degree of
DOCTOR OF PHILOSOPHY
Dissertation Committee:
Barbara Bleyaert, Ed.D., Committee Chair
Theresa Saunders, Ed.D., Committee Member
James Berry, Ed.D., Committee Member
Lynn Malinoff, Ed.D., Committee Member
July 2015
Ypsilanti, Michigan
2. MENTORING
AND
FINANCIAL
INCENTIVES
ii
DEDICATION
I dedicate this project to my parents, Joan and Kevin Galvin, who are directly
responsible for any and all positive aspects of my character. I must have picked up the
negative ones from a schoolyard chum.
3. MENTORING
AND
FINANCIAL
INCENTIVES
iii
ACKNOWLEDGEMENTS
I’ve been fortunate to encounter more than my share of influential people on the
road to completing this dissertation. The Eastern Michigan University College of
Education has provided me with high quality professors and classmates, not to mention
some stellar facilities.
The first person to hire me as an educator, Dr. Lynn Malinoff, also happens to be
the one who talked me into enrolling in the doctoral program at EMU. Knowing that she
had completed the program herself was a solid vicarious experience that strengthened my
self-efficacy in pursuing my doctorate.
Dr. Barbara Bleyaert, my dissertation chair, has been supportive and responsive to
all my requests since the beginning. Also, Cheyenne Luzynski was instrumental in
helping me get this project off the ground and in holding me accountable for putting in
work on Sunday afternoons.
I appreciate the support of the Wayne-Westland School District, particularly the
staff at Wayne Memorial High School, who have permitted my research and encouraged
me all the way. WMHS Principal Kevin Weber was particularly helpful by taking an
interest in my research and helping me think things through.
Thank you to Richard Helppie, Jeff Styers, and the Champions of Wayne Board
of Directors for cheering me on throughout this process.
Also, thank you to my good friend Austin Meibers, who continues to teach me
about perseverance.
4. MENTORING
AND
FINANCIAL
INCENTIVES
iv
ABSTRACT
This mixed methods study describes some outcomes of “Champions of Wayne,” a
privately funded mentoring/incentive program at an impoverished high school near
Detroit. Over 500 students enroll in the program annually. The program involves
providing high school students who choose to participate both adult mentoring and a
$200 incentive to improve one’s grades each semester. The quantitative component of
this study analyzes GPA data, while a multiple case study of six participants explores
mentoring relationships and experiences. In a comparison of the GPA of participants
versus non-participants, program participants significantly improve their grades when
compared to those students who do not participate in the program. The study revealed
that though students initially enroll because of the $200 incentive, they describe the
achievement and mentoring to be most influential in the end. A trusting relationship with
an educationally successful adult has potential to make a particularly positive impact on
an at-risk student from a family with little (or no) educational tradition. The study
concludes with recommendations for school leaders interested in implementing a similar
program, as well as a speculative discussion of how the program may have a ripple effect
on other teacher-student relationships and the overall culture of the school.
5. MENTORING
AND
FINANCIAL
INCENTIVES
v
TABLE OF CONTENTS
Chapter I: Introduction to the Study ....................................................................................1
Statement of the Problem............................................................................................................. 3
Purpose of the Study .................................................................................................................... 4
Significance of the Study ............................................................................................................. 5
Research Questions...................................................................................................................... 6
Conceptual Framework................................................................................................................ 6
Chapter II: Review of Literature........................................................................................12
Challenges of At-Risk Students ................................................................................................. 12
Financial Incentives ................................................................................................................... 16
Mentoring................................................................................................................................... 21
Definition of Key Terms............................................................................................................ 27
Chapter III: Research Design and Methodology ...............................................................29
Self as Researcher ...................................................................................................................... 29
Research Tradition ..................................................................................................................... 30
Data Collection .......................................................................................................................... 34
Quasi-Experimental Design ....................................................................................................... 36
Data Analysis ............................................................................................................................. 37
Limitations and Delimitations.................................................................................................... 40
Validity and Reliability.............................................................................................................. 41
Chapter IV: Quantitative Data and Analysis ....................................................................44
Comparability............................................................................................................................. 45
Growth Scores............................................................................................................................ 53
Program Effects.......................................................................................................................... 55
6. MENTORING
AND
FINANCIAL
INCENTIVES
vi
Quantitative Analysis – Summary of Methodology .................................................................. 59
Comparability............................................................................................................................. 60
Growth Scores............................................................................................................................ 62
Program Effects.......................................................................................................................... 63
Chapter V: Qualitative Data and Analysis.........................................................................67
Qualitative Data ......................................................................................................................... 68
Cross-Case Analysis .................................................................................................................. 79
Themes....................................................................................................................................... 85
Qualitative Analysis – Self-Efficacy Theory............................................................................. 91
Chapter VI: Conclusions and Recommendations .............................................................96
Summary of Study ..................................................................................................................... 96
Research Question 1................................................................................................................... 98
Research Question 2................................................................................................................... 99
Research Question 3................................................................................................................. 100
Research Question 4................................................................................................................. 102
Significance of Results............................................................................................................. 104
Recommendations for Champions of Wayne .......................................................................... 105
Recommendations for School Leaders .................................................................................... 106
Recommendations for Future Research ................................................................................... 107
References........................................................................................................................109
Appendices.......................................................................................................................117
Appendix A: Parent/Guardian Consent Form.......................................................................... 117
Appendix B: Student Consent Form ........................................................................................ 120
Appendix C: Wayne Memorial High School Approval........................................................... 123
7. MENTORING
AND
FINANCIAL
INCENTIVES
vii
Appendix D: EMU Internal Review Board Approval ............................................................. 124
Appendix E: Champions of Wayne Contract ..................................................................126
8. MENTORING
AND
FINANCIAL
INCENTIVES
1
CHAPTER I
INTRODUCTION
Public schools that are home to a large number of at-risk students are generally
home to low student achievement, low motivation, and high levels of student apathy.
Declining student achievement has many educators scrambling for solutions. While a
panacea has yet to be discovered, mentoring programs have shown to be helpful
(Grossman & Tierney, 1998; DuBois, Holloway, Valentine, & Cooper, 2002; Holt, Bry,
& Johnson, 2008; DuBois, Portillo, Rhodes, Silverthorn, & Valentine, 2011; Herrera,
Grossman, Kauh, & McMaken, 2011; Grossman & Bulle, 2006; Thompson & Kelly-
Vance, 2001; Grossman & Rhodes, 2002), and research suggests that financial incentives
can have an impact as well (Fryer, 2011; Raymond, 2008; Hahn, 1994).
Home to many affluent families in the 1960s and 1970s, Wayne, Michigan, has
gone through challenging economic times over the course of the past few decades
(Malinoff, 2002). As the demographics of Wayne have changed, so too have the
demographics of Wayne Memorial High School. As poverty has set in at Wayne
Memorial, achievement has gone down and the school’s reputation has declined with it
(Malinoff, 2002). Certain areas, particularly the Nor-Wayne neighborhood, have
become especially impoverished and run-down. Home now to drug addiction,
unemployment, and violence, these areas have contributed to the challenges faced by the
community and the schools.
Bill Gray (WMHS School Psychologist 1988-2013) and Valerie Orr (WMHS
Principal 2008-2013, Assistant Principal 2006-2008, and 1993 WMHS graduate) became
well aware of the declining student achievement and took action to counteract it. During
9. MENTORING
AND
FINANCIAL
INCENTIVES
2
the 2008-2009 school year, Gray and Orr initiated what came to be known as the
“Champions Program.” A self-proclaimed “trophy enthusiast,” Gray went out and
bought the largest trophy he could find (four feet tall), and approached students with the
idea of the new program. The idea was simple: Students would sign up for Champions
by setting a grade point average (GPA) goal for the semester and agreeing to meet
regularly with Mr. Gray and/or Mrs. Orr throughout the semester. If the goal was
achieved at the end of the semester, the successful student would have his/her name
engraved on the trophy and would forever be known as a Champion. Despite lackluster
results from the initial semester, Gray decided to continue developing Champions into an
established mentoring program.
At the conclusion of the 2008-2009 school year, Gray met Richard Helppie, a
1974 Wayne Memorial graduate who was recognized as the 2009 WMHS Distinguished
Alum at that year’s graduation ceremony. Helppie, a successful entrepreneur and
philanthropist, was open to Gray’s idea to “add some firepower” to the newly created
Champions Program by adding a financial incentive. Initially, Gray’s idea for the
incentive was some sort of stipend toward higher education. Helppie, owner of several
businesses in the private sector, thought that money paid directly to the students would be
much more motivating. Helppie informed Gray and Orr that the only way he would
provide the financial incentive would be if payments went directly to the students, and
ultimately got his way.
As one might expect, the introduction of the financial incentive caused the
popularity of Champions to soar. Enrollment in the program increased from 50 students
in 2009, to over 500 students in 2015. The Champions program is popular among the
10. MENTORING
AND
FINANCIAL
INCENTIVES
3
staff as well. What began as a program with a “handful” of teachers volunteering to
mentor has now grown to over 130 mentors program-wide. Over 90% of the Wayne
Memorial staff has volunteered to mentor, and almost the entire staff at Tinkham
Alternative High School is also on board with Champions.
The popularity of Champions has also created a need for a management staff. A
full-time executive director was hired before the start of the 2011-2012 school year, and a
full-time assistant director was brought on before the 2013-2014 school year.
Additional donors have joined Richard Helppie in recent years. Jeff Styers, a
successful entrepreneur and 1984 graduate of Wayne Memorial, has made significant
contributions to Champions since the summer of 2013, and has pledged to support
Champions in the future. Further, a “Hollywood Comes to Wayne”-themed movie
premiere fund-raiser took place in September, 2013, and raised $48,000 for the program.
As the program continues to develop, a board of directors is in the works. This
board will consist of committee chairs, who lead initiatives such as fund-raising,
operations, public relations, board development, and event-planning. Richard Helppie
has an extensive background in business development and organizational growth, and
guides the program accordingly.
Statement of the Problem
While the effectiveness of financial incentives on high school academic
achievement is largely debatable (Fryer, 2011; Slavin, 2010; Spencer, Noll, & Cassidy,
2005), there is no doubt that mentoring programs can have a significant impact on
academic achievement, as well as a child’s overall sense of well-being (Dubois et al.,
2011; Grossman & Tierney, 1998; Grossman & Bulle, 2006; Grossman & Rhodes, 2002;
11. MENTORING
AND
FINANCIAL
INCENTIVES
4
Thompson & Kelly-Vance, 2001). Currently, there exists very little research on
educational programs that combine mentoring and financial incentives. It is possible that
this combination has a unique impact on at-risk student achievement.
Informal interviews with Champions of Wayne officials suggest that, while many
Wayne students may not jump at the idea of signing up for an academic mentoring
program, the $200 incentive makes even the most resistant student give the program a
chance. Many successful students have reported that, while the monetary incentive was
significant in getting them to join Champions, the relationship with their mentor and the
satisfaction of achieving their goals were stronger sources of motivation in the end.
Research strongly suggests that, if at-risk youth willingly enroll in a mentoring
program, there is potential to overcome large hardships in their respective personal lives
(DuBois et al., 2002; Grossman & Tierney, 1998; Thompson & Kelly-Vance, 2001).
Effective school-based mentoring programs, especially those implemented at schools
with substantial at-risk populations, have potential to uplift both achievement and
enrollment. (Grossman & Bulle, 2006).
Purpose of the Study
The purpose of this study was to explore what motivated students at Wayne
Memorial to join the Champions of Wayne program, how participation in the program
affected them as young adults, and how it influenced their academic performance.
Wayne Memorial is home to a large proportion of at-risk students, with over 80% of the
student body eligible for a free or reduced-price lunch. Program officials tout Champions
of Wayne as an innovative and unique program that has significantly changed the lives of
Wayne Memorial students since 2009.
12. MENTORING
AND
FINANCIAL
INCENTIVES
5
Significance of the Study
Researchers generally agree that support and guidance from adults are
instrumental in the growth of adolescents into responsible citizens (Grossman & Tierney,
1998; Grossman & Rhodes, 2002; Thompson & Kelly-Vance, 2001)). In fact, people
often attribute their success to an adult who came into their lives at the right time and
paid attention to them. Historically, Americans have relied on families, schools, and
neighborhoods to provide this support for youth. However, these institutions have
changed to the point where they no longer have the capacity to deliver such support.
There are fewer adults in families today, and half of the current generation will live in a
single-parent household during some part of their childhood (Grossman & Tierney,
1998). As of 2012, more than one in five American children under the age of 18 was
living in poverty (United States Census, n.d.).
Exposure to poverty, dangerous neighborhoods, and family dysfunction often
results in children being labeled as “at-risk” (Thompson & Kelly-Vance, 2001).
Adolescents whose family income falls in the bottom 20th
percentile are six times more
likely to drop out of school compared to those in the top 20th
percentile (Holt et al.,
2008). Research has shown that at-risk students are likely to have a history of tardiness,
unexcused absences, and behavioral problems. Further, at-risk students have less self-
confidence as learners and have a locus of control that is much more externally oriented
(Thompson & Kelly-Vance, 2001). Children who do not graduate from high school face a
bleak future. Over 80% of prison populations are comprised of high-school dropouts,
and the majority of those who are law-abiding end up in dead-end careers (Kim, 2013).
13. MENTORING
AND
FINANCIAL
INCENTIVES
6
Research Questions
This study focused on four main questions:
1. What motivated students to sign up for Champions of Wayne?
2. How did students describe the impact that participation in Champions of
Wayne had on their personal lives?
3. How were students’ perceptions of school and their academic abilities
changed as members of the Champions of Wayne program?
4. How did participation in Champions of Wayne affect students’
performance in school?
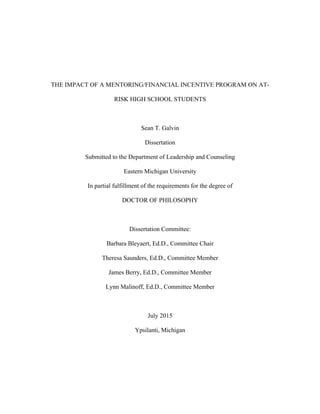
Conceptual Framework – Self-Efficacy Theory
The mentoring and financial incentive components of Champions of Wayne
seem to have potential when considering student motivational theory. According to
Bandura (1986), motivation is heavily influenced by predictions of the outcomes of a
given behavior. When considering delving into a task, human beings often imagine
future consequences or results of these actions. These predictions are based on what
Bandura refers to as a person’s “self-efficacy,” which he defines as a given person’s
belief in his/her own capabilities.
Bandura (1986) identified four (and only four) factors that comprise a
person’s self-efficacy on a given task: Mastery experiences, vicarious experiences, social
persuasion, and physiological/emotional states. Mastery experiences, the most influential
of the four factors, are the person’s direct experiences with a given task. Those who have
experienced failure will likely expect to fail, whereas those who have performed similar
tasks with success are likely to have high expectations of their abilities.
14. MENTORING
AND
FINANCIAL
INCENTIVES
7
Vicarious experiences, second-most powerful, occur when one observes
someone else either succeeding or failing at a given task. The effect on efficacy is
enhanced by how closely the observer identifies with the model being observed (Hoy &
Hoy, 2006). When models perform well, efficacy improves. However, when models
struggle and fail, efficacy suffers.
Social persuasion is not as powerful as mastery and vicarious experiences,
and is not likely to create enduring increases in efficacy. However, effective “pep talks,”
words of encouragement, and coaching have potential to create a short-term boost in
efficacy that can lead to heightened effort (Hoy & Hoy, 2006). Social persuasion can
often combat setbacks and episodes of self-doubt. The potential of persuasion is largely
dependent on the credibility, trustworthiness, and competence of the persuader (Bandura,
1986).
Finally, self-efficacy is also determined by the physiological and emotional
state of the subject. If the person facing the task is nervous, anxious, or worried, efficacy
is lowered. However, if the person is excited, well-rested, or “pumped up,” efficacy is
enhanced (Hoy & Hoy, 2006).
15. MENTORING
AND
FINANCIAL
INCENTIVES
8
Bandura’s theory of self-efficacy aligns well with the research questions for
this study. The first question has to do with motivation to sign up for the program.
Champions of Wayne has been rapidly growing in popularity since inception in 2009,
expanding from 50 to over 500 students in 2015. Bandura (1986) explains that a key
ingredient to a given student’s self-efficacy on a given task has to do with vicarious
experiences, which in this case are observed experiences of the student’s peers.
Champions of Wayne publicly celebrates successful students by way of formal banquets,
a significant social media presence, and other media outlets (newspaper, television, radio,
etc.). Further, students receiving the $200 rewards are likely to tell their friends and
SELF
EFFICACY
MASTERY
EXPERIENCES
Challenging,
yet
attainable
goals
can
motivate
and
strengthen
efOicacy
Mentoring
relationships
can
improve
resilience
VICARIOUS
EXPERIENCES
WMHS
students
likely
to
know
others
who
have
had
positive
experiences
with
CofW
Public
recognition
of
successful
students
Mentors
can
act
as
role
models,
demonstrate
efOicacy
SOCIAL
PERSUASION
Mentors
offer
support,
words
of
encouragement,
"pep
talks",
etc.
PHYSIOLOGICAL
AND
EMOTIONAL
STATE
At-‐risk
youth
can
beneOit
from
having
someone
"in
their
corner"
16. MENTORING
AND
FINANCIAL
INCENTIVES
9
classmates about it. It is possible that these vicarious experiences have led to many
students signing up for Champions of Wayne (“yes, they really pay you!”). Beyond that,
students are likely to know someone who has been successful in developing a
relationship with an adult at school and improving his or her long-term academic
performance.
Question two involves the personal lives of the students. According to
Grossman and Rhodes (2002), mentoring relationships have potential to challenge
negative views that adolescents may have of their futures, their relationships with others,
and other areas of their respective lives. Bandura (1989) explains that beliefs of one’s
efficacy apply to relationships, future aspirations, and perseverance in the face of
difficulty.
Gecas (1989) states that self-efficacy begins to develop as an infant begins to
interact with the environment. The family, then, becomes the most important
environment for development of self-efficacy, and the parents are the most significant
figures for the child. These early interactions are significantly related to the development
of a child’s self-esteem, achievement motivation, interpersonal competence, and social
behavior. Children are likely to learn to be efficacious by observing efficacious parents
(Gecas, 1989).
Given this research, one begins to understand how at-risk students may be at
a disadvantage in areas other than academics. Gecas (1989) further explains that class-
related variables such as income, education level, and employment status are strong
contributors to the development of self-efficacy. These variables also contribute directly
to a student being labeled as at-risk (Thompson & Kelly-Vance, 2001).
17. MENTORING
AND
FINANCIAL
INCENTIVES
10
Question three has to do with a given student’s perception of his/her
academic abilities. Perception of ability is the definition of self-efficacy. While
participation in Champions of Wayne cannot change the experiences a given student has
had in the past, students who participate in Champions of Wayne are likely to have had
vicarious experiences with peers who have participated in the program in the past.
Further, participating students are likely to have the social persuasion of their mentors
(pep talks, words of encouragement, etc.), and may be in a better physiological/emotional
state as a result of having a caring and responsible adult supporting them at school.
The financial incentive aspect of Champions of Wayne also has potential to
affect students’ self-efficacy. Bandura (1997) states that challenging, yet attainable goals
that are coupled with enticing incentives not only serve as motivators, but also help to
build and strengthen efficacy.
Lastly, question four involves actual performance in school. According to
Bandura (1989), greater self-efficacy leads to increased effort and greater resilience in the
face of setbacks. There is evidence to show that a high degree of self-efficacy will
increase motivation, even if the efficacy is unrealistically high (Hoy & Hoy, 2006). If
students at Wayne Memorial High School are able to increase their self-efficacy when it
comes to their schoolwork, it is quite possible that their grades will improve as well.
This study is presented in six chapters. This first chapter provides an
introduction, the conceptual framework, and the four research questions. The second
chapter presents a review of the existing research that is relevant to this study, as well as
key terms and their definitions. The methodology for this mixed-methods study is
presented in the third chapter, as is a rationale for the chosen design. The quantitative
18. MENTORING
AND
FINANCIAL
INCENTIVES
11
analysis of grade point average (GPA) data is presented in chapter four, followed by the
qualitative analysis in chapter five. Finally, chapter six provides the conclusion and
recommendations for future research.
19. MENTORING
AND
FINANCIAL
INCENTIVES
12
CHAPTER II
REVIEW OF LITERATURE
The majority of students enrolled at Wayne Memorial High School during the
2014-2015 school year were considered to be “at-risk.” Champions of Wayne involves
mentoring and financial incentives in an effort to bolster academic achievement and
enhance relationships for students and staff at Wayne Memorial.
This chapter provides a summary of the existing research on at-risk youth,
financial incentives for academic achievement in schools, and mentoring programs. A
list of key terms and their respective definitions is at the end of this chapter.
Challenges of At-Risk Students
In a study of at-risk students, Aronson (2001) identifies eight barriers that at-risk
subjects have in common: Poverty, racial and ethnic identity, isolation and lack of
exposure, hostile environments, lack of educational history (learning how to learn),
linguistic and cultural adjustment, conflict between school and home, and neglect/abuse.
Poverty. There are obvious financial challenges for those growing up in poverty,
but Aronson (2001) found underlying challenges that may be even more significant.
Respondents in her study described feelings of being labeled and stigmatized by lower-
class status, distractions from schoolwork, and heightened racial tensions for minorities.
In a study of the impact of economic hardship on families, McLoyd (1990) found
that poverty increases the risk of emotional distress in adults and renders them more
vulnerable to the debilitating effects of negative life events (job loss, eviction, etc.). This
emotional distress is further intensified if the adult is a single parent, is a minority, is
socially isolated, or if he/she takes the blame for the economic difficulty.
20. MENTORING
AND
FINANCIAL
INCENTIVES
13
McLoyd (1990) also found that poor parents are more likely to use power-
assertive parenting techniques in disciplinary situations than their affluent counterparts,
and are generally less emotionally supportive of their children. Lower-class parents often
issue commands without explanation and are less likely to consult their children about
their wishes. In many poor families, harsh and authoritative parenting strategies are met
with growing resentment and resistance from children.
Racial and ethnic identity. Aronson (2001) found that, while none of the white
respondents to her study raised the issue of race as a challenge, all of the non-white
respondents described their “non-whiteness” as a barrier to be accounted for. “If being
white is perceived as the norm, anyone non-white will at least carry an awareness of
his/her ‘difference’, an awareness that can become a heavy burden, especially when
combined with poverty.” (p. 13) McDermott & Varenne (1995) state that children from a
minority cultural background, mixed with teachers from the dominant cultural
background, often suffer enough miscommunication and alienation to give up on school
despite the fact that they are, in terms of potential, fully capable.
McLoyd (1990) found that low wages, unemployment, and an increasing
proportion of African-American families headed by a single mother are threatening the
economic well-being of African-American children. These pressures weaken
individuals’ ability to cope with new problems, making poor African-Americans more
likely to succumb to the debilitating effects of negative life events.
Isolation. At-risk students often have feelings of isolation and a general lack of
exposure to the educational and cultural opportunities enjoyed by their more privileged
21. MENTORING
AND
FINANCIAL
INCENTIVES
14
peers (McDermott & Varenne, 1995). As a result of this, at-risk students often feel that
they are constantly behind, and constantly playing “catch up.”
Hostile environments. Another common characteristic of at-risk students is
exposure to hostile environments. Impoverished parents are more likely to discipline
their children with verbal and/or physical abuse than affluent parents, thus making home
an unpleasant place to be (McLoyd, 1990). Also, low-income schools are often home to
negligent and indifferent teachers and counselors, exposing poor children to unpleasant
interactions with other adults. Further, impoverished neighborhoods often are home to
dangerous activity, negative influences, and harsh bullying (Thompson & Kelly-Vance,
2001).
Educational history. Aronson (2001) also found that at-risk students face
adversity in a lack of educational tradition, and in learning how to learn. This concept
refers to having little (or no) value placed on education in the home, having little help
with homework, being given few tools for studying, and having no exposure to a culture
of education. This condition has been identified as a main cause of the achievement gap
between privileged and underprivileged students (Alexander, Entwisle & Horsey, 1997).
Cultural adjustment. At-risk students often are forced to assimilate to cultures
different than those they are raised in, which results in a sense of alienation and a
difficulty learning new concepts (Aronson, 2001). Often, there is a distinct conflict
between values at school versus those at home (James, 2011).
Abuse/neglect. Lastly, Aronson (2001) found that many (but not all) at-risk
students endured physical and emotional abuse during their childhood. When these
22. MENTORING
AND
FINANCIAL
INCENTIVES
15
challenges are faced, academic success becomes more of a distant dream than a feasible
goal.
At-risk students respond to these hardships in a variety of ways. Aronson (2001)
categorized the stories of her respondents into six main themes: Fear and anxiety,
resentment, internalization, early maturity, shame, and self-protection.
The fear and anxiety felt by at-risk students often inhibit their social skills, study
habits, curiosity, and ease of expression. All of these are qualities that lead to academic
achievement (Aronson, 2001). Further, feelings of fear and anxiety lead to feelings of
resentment, a sense of injustice, and a feeling of powerlessness to reverse the unfortunate
conditions (James, 2011).
At-risk students also have a tendency to internalize the image projected upon
them by their adversity. Aronson (2001) found that, to varying degrees, all subjects in
her study became convinced that they were incapable of overcoming the odds against
them. Even those who have seemingly beaten the odds and “made it” still admit to
struggling with this psychological challenge.
Another common response to growing up at-risk is a feeling of shame. McLoyd
(1990) found that at-risk youth often feel the shame of being poor and the shame of not
belonging. Poor children often take on responsibilities such as caring for younger
siblings and working to help with family finances, causing them to grow up faster than
their more affluent peers.
Lastly, the adversity faced by at-risk students often results in their tendency to
create a wall around themselves and to protect themselves from further hardships
23. MENTORING
AND
FINANCIAL
INCENTIVES
16
(Aronson, 2001). Many lose motivation, others develop into disruptive students, and
some slowly become what Aronson refers to as “invisible pupils.” (p. 15)
Financial Incentives
Basic economic theory suggests that human beings will increase output if
provided a significant monetary incentive (Pink, 2010). Monetary rewards for
achievement are common practice in the business world; however they are rarely used in
schools (Spencer et al., 2005), and the mere mention of doing so is controversial (Fryer,
2011). In recent years, however, policy makers and education researchers have become
increasingly interested in the potential of incentives in education (Bettinger, 2012).
Controversy. Although the idea of incentivizing student achievement with
money has been supported by many (Bettinger, 2012; Fryer, 2011; Slavin, 2008; Spencer
et al., 2005; Flora & Flora, 1999), others have approached the concept with great
skepticism and indignation (Raymond, 2008; Kohn, 1993). In fact, more Americans
support spanking in public schools (26%) than they do financial incentives (23%) (Allan
& Fryer, 2011).
Intrinsic and extrinsic motivation. Those opposed to financial incentives in
education often cite the relationship between extrinsic and intrinsic motivation (Kohn,
1993; Benabou & Tirole, 2003). Extrinsic motivators such as rewards are often used to
get individuals to engage in behaviors they might not otherwise engage in (Deci,
Koestner, & Ryan, 1999). Extrinsic motivators have long been a part of schools, and
have traditionally been advocated by many educators (Deci, Koestner, & Ryan, 2001).
Recently, however, attention has been drawn to psychological experiments that
have demonstrated negative effects on students’ intrinsic motivation caused by extrinsic
24. MENTORING
AND
FINANCIAL
INCENTIVES
17
rewards. A common argument against extrinsic rewards is that, while the frequency of
the wanted behavior will increase in the short term, when the reinforcement is later
withdrawn, students will engage in the activity even less than they did before the
reinforcement was initiated (Deci et. al, 1999; Benabou & Tirole, 2003). As part of his
argument against rewards in education, Kohn (1993) claims to have “irrefutable evidence
that people who are trying to earn a reward end up doing a poorer job on many tasks than
people who are not.” (p. 49) Further, Deci and Ryan (1985) have long argued that
intrinsic motivation results in creativity, flexibility, and spontaneity; whereas extrinsic
motivation results in pressure, tension and anxiety.
Others, however, argue that extrinsic motivation often leads to intrinsic—even
after the extrinsic motivation is taken away. In a study of the “Book It!” children’s
reading program’s impact on the reading habits of college students, Flora and Flora
(1999) found that external motivation can serve as a great base for future intrinsic
motivation. Also, a meta-analysis of 96 experimental studies conducted by Cameron and
Pierce (1994) found that extrinsic rewards do not negatively impact intrinsic motivation.
Further, Cameron and Pierce make an important distinction between types of rewards:
When rewards are delivered contingent upon some level of performance, positive results
often occur. However, when rewards are contingent upon engagement on a given task,
regardless of the subjects’ level of performance, an undermining effect is possible
(Cameron & Pierce, 1994).
When applied to the theory of self-efficacy described by Bandura (1986), a
mastery experience is a mastery experience, regardless of the motivation for doing so.
When working with at-risk youth who have experienced failure, Nunn and Parish (1992)
25. MENTORING
AND
FINANCIAL
INCENTIVES
18
suggest providing youth with opportunities for success, and subsequently focusing on that
success over any previous failures.
In sum, some researchers believe that extrinsic motivators will reduce intrinsic
motivation in the long term, while others see no harm whatsoever. Perhaps Deci (1975)
articulates it best, “If a person’s feelings of competence and self-determination are
enhanced, his/her intrinsic motivation will increase. I suggest that some rewards or
feedback will increase intrinsic motivation through this process and others will decrease
it.” (p. 41)
Effects of financial incentives on achievement. Effects on motivation aside,
several studies have been conducted to determine the effects of financial incentives on
student achievement (Fryer, 2011; Hahn, 1994; Rodriguez-Planas, 2012; Slavin, 2010;
Spencer et al., 2005; Raymond, 2008; Bettinger, 2012). Generally, these studies are in
agreement that financial incentives have at least a small positive impact on student
achievement. The most effective ways to structure and implement incentive programs,
however, are debatable as incentive programs can be structured in a multitude of ways.
Districts and schools can pick and choose which behaviors and tasks to provide
incentives for, the amount to be paid, and the frequency of payment (Fryer, 2011).
In a comprehensive study of 21 different incentive programs around the world,
Slavin (2010) found that, overall, incentive programs have potential. His findings,
however, were mixed. He found the effects of incentives on volitional outcomes—school
attendance, participation in exams, etc.—to show modest gains in secondary schools, but
not for primary schools. Further, the outcomes of incentives not directly volitional—such
as grade attainment and learning—were found to be minimal.
26. MENTORING
AND
FINANCIAL
INCENTIVES
19
In a large study of incentive programs involving 250 schools and roughly 36,000
students, Dr. Roland Fryer of Harvard University set up differently structured incentive
programs in five large U.S. cities (Chicago, Dallas, Houston, New York, and
Washington, DC). Two of these programs incentivized what Fryer calls academic
outputs (grades and test scores), while the other three programs focused on academic
inputs (attendance, behavior, reading books).
The setup of the Chicago experiment was very simple. Students would be
rewarded with $50 for each “A” on their report card, $35 for each “B,” $20 for each “C,”
and no reward for a “D” or a failing grade. The average student in this experiment
received $695.61 for the school year, but surprisingly, the incentives did very little to
increase achievement, “treatment students passed approximately one-half a course more
on average than control students.” (Allan & Fryer, 2011)
In New York, students were incentivized to perform on standardized tests.
Students were offered a small stipend ($5 to $10) for completing the exam, and more
money ($25 to $50) for a perfect score. The results showed no statistical improvement.
In some instances, incentivized students actually scored lower than those in the control
group (Allan & Fryer, 2011).
Fryer suggests that programs based on outputs are ineffective. He found that
virtually all students were excited about the idea of getting paid to perform academically,
but they had little idea of how to actually raise their achievement. When asked how they
would improve, students generally responded that they would try harder or read test
questions more carefully. Rarely did these students answer that they would attend school
27. MENTORING
AND
FINANCIAL
INCENTIVES
20
more often, complete homework assignments, or ask for help with confusing topics.
(Allan & Fryer, 2011)
While the output programs were ineffective, Fryer found success with programs
based on inputs that students could more easily comprehend and control. These programs
incentivized students to read books (Dallas), attend school and complete assignments
(Washington), and master math objectives (Houston).
In Washington, students were given as much as $10 per day to attend class,
behave, wear a uniform, and complete assignments. Students in the treatment group
responded with increased attendance, decreased behavior issues, and improved academic
performance.
Fryer and his team also had success in Houston, where students were incentivized
with two dollars for each mathematics quiz they passed. These students ended up
mastering 125 percent more math objectives than their counterparts in the control group.
The most successful of Fryer’s incentive programs took place in Dallas, where
students were incentivized to read books. If participating students could pass a brief quiz
to prove they read a given book (over 80,000 to choose from), they would be rewarded
with two dollars. Fryer concluded that, “paying students to read books yields large and
statistically significant increases in reading comprehension.” (2011)
In sum, Fryer found the output programs had a statistical impact of zero. There
were marginal improvements, but nowhere near statistically significant. The input
programs, however, showed much stronger results. Fryer explained his reasoning behind
this, “Despite showing that students were excited about the incentive programs, the
qualitative data also demonstrate that students had little idea about how to translate their
28. MENTORING
AND
FINANCIAL
INCENTIVES
21
enthusiasm into tangible steps designed to increase their achievement” (2011). Fryer
concludes that students understand how to control inputs such as attendance, punctuality,
and homework completion. If they can push themselves to accomplish the incentivized
inputs, the outputs (grades and test scores) will follow (2011).
It is important to note that all five of Fryer’s major experiments involved
underachieving districts, four of which had over 90% of students receiving a free or
reduced lunch (Washington, DC, had more than 70% meet this criterion). Generally
speaking, the majority of the students involved in these experiments were low achievers.
Research suggests that incentives may be more effective when dealing with high-
achieving students from low socioeconomic districts (Spencer et. al, 2005). In a study of
an existing program set up to incentivize high achieving high school students (grades 9-
12), researchers found that, not only did incentives persuade students to achieve more,
but it also helped them to overcome obstacles in their lives. “For students who live in
poor, under resourced neighborhoods, the impact of monetary rewards may provide not
only financial but also psychological relief…monetary rewards may be especially
beneficial to these youth because they may alleviate the stress associated with economic
challenges.” (p. 218)
While researchers generally agree that properly-structured incentive programs
have potential, there is also agreement that incentives are not a panacea (Fryer, 2011).
Mentoring
Mentoring programs offer another possible solution to the complexity of problems
at-risk youth face (Thompson & Kelly-Vance, 2001). The concept of mentoring dates
back to ancient Greek mythology. In Homer’s The Odyssey, a character named Mentor is
29. MENTORING
AND
FINANCIAL
INCENTIVES
22
entrusted with the responsibility of drawing out the full potential of Telemachus, another
character in the story (Anderson & Shannon, 1998). Contemporary definitions of
mentoring generally include a one-on-one relationship between two people, one of whom
is older and more experienced in a certain capacity (Thompson & Kelly-Vance, 2008).
Research strongly suggests that a strong relationship with a mentor can
significantly change the life of an at-risk child (DuBois et al., 2011; Grossman & Bulle,
2006; Grossman & Tierney, 1998). As a result, there are over 5,000 youth mentoring
programs operating in the United States today, and an increasing amount of public money
is being allotted to such programs (DuBois et al., 2011).
Potential impacts of mentoring. Over the past few decades, researchers have
determined that at-risk youth who participate in high-quality mentoring programs are
more likely to improve their behavior and attendance in school (Holt et al., 2002; DuBois
et al., 2002), reduce their use of drugs and alcohol (Grossman & Bulle, 2006) improve
perceptions of their futures (DuBois et al., 2002), and improve their overall academic
performance (Grossman & Tierney 1998, Dubois et al. 2002, Holt et al. 2002). Also, at-
risk youth who spend sufficient time with a mentor are more likely to be connected to
their school environment and to view adults in the school as helpful and caring (Holt et
al., 2002).
Additionally, some existing research suggests that mentors may have a positive
impact on adolescents’ relationships with their families, friends, teachers, and other
adults in their lives. Positive mentoring relationships have potential to challenge negative
views that adolescents may hold of various relationships they have with others, and
30. MENTORING
AND
FINANCIAL
INCENTIVES
23
demonstrate that positive, caring relationships with these people are possible (Grossman
& Rhodes, 2002).
Resiliency, defined as the ability to rebound after an upset or trauma and the
resourceful use of support networks, has proven to be a vital attribute of a successful
student (Grossman & Bulle, 2006). Findings from a longitudinal study that lasted over
40 years reveal that one of the key distinguishing features separating resilient at-risk
youth from those who fall behind is a meaningful, long-lasting relationship with a caring,
responsible adult (Werner & Smith, 1992).
School-based mentoring. Because youth spend almost a third of their waking
hours at school (Herrera et. al, 2011), school-based mentoring programs allow mentors
convenient access to youth on a regular basis. The benefits of school-based mentoring,
however, do not end at convenience. Studies have shown that participation in school-
related activities has a positive impact on students’ sense of school belonging, which can
lead to increased attendance and overall academic performance (Grossman, Walker,
Kotloff, & Pepper, 2001). Also, peers may see attention from adults in a very positive
light, thus boosting the status of the mentored child (Grossman & Bulle, 2006).
Peer influence. In general, children become increasingly influenced by their
peers as they transition from childhood to adolescence (Fuligni, Eccles, Barber &
Clements, 2001). In a three-year longitudinal study of nearly 7,000 adolescents (grades
9-11) in Wisconsin and California, Mounts and Steinberg (1995) found adolescent
academic achievement to be influenced by peers, both positively and negatively. They
also found adolescent drug and alcohol use to be largely influenced by peers.
31. MENTORING
AND
FINANCIAL
INCENTIVES
24
Research has also shown peer influence to extend to adolescents’ choice of
extracurricular activities. Mahoney and Stattin (2000) found that youth were more likely
to participate in a given activity if one of their friends was planning on participating as
well. Further, the study observed that students who participated in structured activities
after school reported larger peer groups and were less likely to engage in antisocial
behaviors such as delinquency, criminality, school dropout, and alcohol/drug use.
Natural relationships vs. planned relationships. According to Floyd (1993),
there are two types of mentoring relationships: Natural relationships and planned
relationships. Natural mentoring occurs through friendship, coaching, teaching, and
counseling. Planned mentoring, on the contrary, occurs through structured programs in
which mentors and mentees are matched through a formal selection process. While
natural relationships have proven to be most successful, planned relationships have
potential to be just as effective if planned properly. According to Grossman and Bulle
(2006), most people feel comfortable at the beginning of a relationship with people who
are similar to themselves in some way. Thus, identification of shared interests between
mentor and mentee is important to a planned relationship.
While school-based mentoring programs tend to focus on the academic success of
a given student, there is considerable research supporting the idea that the most effective
mentoring relationships are derived from informal or social interactions (Herrera et al.,
2011). Further, mentoring tandems who play games, eat lunch together, and just “hang
out” are more likely to report having a close relationship than those who spend a majority
of their time together on schoolwork (Grossman & Bulle, 2006).
32. MENTORING
AND
FINANCIAL
INCENTIVES
25
Challenges of mentoring programs. While most researchers agree that
mentoring programs can have a positive effect on at-risk youth, there is also agreement
that poorly structured programs can actually have a negative effect on those they serve
(Smith & Stormont, 2011). In fact, it is estimated that only about half of planned youth
mentoring relationships last beyond a few months (Spencer et al., 2005). When
relationships terminate prematurely, they have potential to do much more harm than good
(Grossman & Rhodes, 2002).
Adolescents are especially vulnerable to issues of acceptance and rejection,
especially when family dynamics are unstable (Lerner & Galambos, 1998). If a
mentoring relationship were to become negative, fall apart, or end early, mentees may
end up with profound feelings of disappointment, rejection, and betrayal (Rhodes, Liang,
& Spencer, 2009).
Because the processes of changing attitudes, relationships, and perceptions of
reality are complex, the benefits of mentoring emerge over a relatively long period of
time (Grossman & Rhodes, 2002). In a qualitative study of mentoring relationships,
Styles and Morrow (1992) found that mentoring relationships needed to be in place for at
least six months before true benefits began to emerge.
Mentoring AND incentive programs. Fryer (2011) states that students
participating in incentive programs are genuinely excited about improving their academic
performance, but generally have little idea as to how to translate this enthusiasm to
tangible steps toward success. Given the potential impact of an adult mentor as discussed
by DuBois et al. (2011), one wonders if the missing puzzle piece to incentive programs
33. MENTORING
AND
FINANCIAL
INCENTIVES
26
could be mentoring. Where there is limited research on the power of incentives, research
on programs that combine incentives and mentoring is even more scarce.
Hahn (1994) evaluated one significant program that has attempted the
combination of mentoring and financial incentives (among a host of other services) in the
Quantum Opportunities Program (QOP), which operated in five different communities
(Philadelphia, Oklahoma City, San Antonio, Saginaw, and Milwaukee) from 1989 to
1994. The program, funded by the Ford Foundation, randomly assigned 25 9th
grade
students to a treatment and control group (a total of 50 students in each city).
QOP guaranteed participants up to 250 hours of education, 250 hours of
development activities, and 250 hours of mentoring services each full year from the ninth
grade through graduation (or for four full years for those who dropped out). Incentives of
roughly $1 per hour were offered for participation in programming, with $100 bonuses
set for certain levels of participation achieved. The program was designed to encourage
long-term involvement in an array of services, and to provide meaningful relationships
with adults without fear of the relationships ending prematurely (Hahn, 1994). On
average, $10,600 was spent on each pupil over four years, with roughly 50% of the
money spent on stipends and bonuses to participants, and the other 50% spent on
program costs.
In the end, Hahn (1994) found that QOP members were more likely to graduate
high school, enroll in post-secondary school, receive an honor or award, be hopeful about
their future, and more likely to consider their life a success. Further, QOP members were
less likely to be high school dropouts and less likely to have children during their high
school years.
34. MENTORING
AND
FINANCIAL
INCENTIVES
27
Perhaps most encouragingly, Hahn (1994) found that most participants stayed
with the program for all four years, and that the consistent mentoring had an impact over
time. “If young people are connected with caring adults for sustained periods of time,
year-round, results do emerge.” (p. 16)
Key Terms:
Mentoring: A one-on-one relationship between two people, one of whom is older and
more experienced in a certain capacity. Mentoring involves teaching, sponsoring,
encouraging, counseling, and befriending (Thompson and Kelly-Vance, 2001).
At-risk: Students exposed to poverty, dangerous neighborhoods, and family dysfunction
(i.e., single parent homes, abusive/neglectful caretakers, out of home placement, etc.).
Often, these factors result in risky behavior (i.e., early sexual behavior, truancy,
drug/alcohol use, associating with delinquent peers, etc.) (Thompson & Kelly-Vance,
2001).
Intrinsic Motivation: Engagement in a certain behavior for no recognizable reward
other than the activity itself (Flora & Flora, 1999).
Extrinsic Motivation: Engagement in a behavior because of an incentive that is not a
part of the activity (Flora & Flora, 1999).
Extrinsic Rewards: Any mechanism intended to motivate or reinforce a given behavior.
Examples include financial incentives, gold stars, pizza parties, honor rolls, and even
verbal rewards (i.e., “nice job!”) (Deci et al., 2001).
Educational Autonomy: The ability to take responsibility for one’s own learning
(Moeller, Theiler, & Wu, 2012).
35. MENTORING
AND
FINANCIAL
INCENTIVES
28
Role Model: A person whom others look to as an example to be imitated (Herrera et al.,
2011).
Incentive: For purposes of this study, incentives will be defined as a payment or
concession to stimulate greater output (Fryer, 2011).
Culture: A whole way of life of a social group or society through which a social order is
communicated, reproduced, experienced and explored (Williams, 1981).
Self-Efficacy: An individual’s beliefs about his/her personal competence or effectiveness
in a given area (Hoy & Hoy, 2006).
36. MENTORING
AND
FINANCIAL
INCENTIVES
29
CHAPTER III
RESEARCH DESIGN AND METHODOLOGY
The purpose of this study was to understand the experience of at-risk students
involved in the Champions of Wayne mentoring and incentive program at Wayne
Memorial High School. While there is an abundance of research on the impact of
mentoring programs, as well as a growing body of research on the impact of monetary
incentive on at-risk students, very little research exists on the combination of the two.
Further, Champions of Wayne is an increasingly popular program that is being replicated
at other high schools in the Detroit area, yet the programs exist with little formal
evaluation.
This chapter explores the research methods necessary to understand the
experience of individual students who enroll in Champions of Wayne.
Self as Researcher
The motivation to conduct this research came from my current role as Executive
Director of Champions of Wayne. The program, which originated in 2009, was
facilitated by the school’s principal and psychologist until the summer of 2011. That
summer, the decision to hire a full time director was made and I was hired from my role
at Franklin Middle School (which feeds directly into Wayne Memorial High School).
During my time in this role, I have witnessed many hard-working students achieve their
goals, and have also observed students who have remained largely apathetic toward their
schoolwork and their futures despite enrollment in Champions.
37. MENTORING
AND
FINANCIAL
INCENTIVES
30
Like many educators, I was interested in the potential of various interventions for
at-risk students. Further, it has been beneficial for me as director of the program to gain a
deeper understanding of the program I lead and where improvements might be made.
Research Tradition – Mixed Methods
As more and more children fall victim to the perils of growing up in poverty,
single-parent homes, and other challenges faced by those labeled “at-risk,” educators are
scrambling for ways to counteract these problems. Mentoring and financial incentives
have both been looked at as potentially helpful in uplifting children from the cycle of
poverty (Hahn, 1994; DuBois et. al, 2002), but both have been found to have their limits
(Fryer, 2011; Grossman & Tierney, 1998).
Krathwohl (2009) poses the question, “Is the phenomenon best described in numbers
or with words?” (p. 28) When examining the two aspects of Champions of Wayne—
mentoring and financial incentives—the answer was both. Looking at the research
literature used for this study, I found the vast majority of financial incentive studies to be
quantitative, while the vast majority of studies on mentoring have been qualitative. This
is largely because, when attempting to answer the question, “Did (or Does) the program
work?” different strategies were used to answer the question.
Educational programs geared around financial incentives tend to be focused on short-
term gains in a given academic area (grades, test scores, attendance, etc.). Across the
board, these programs have awarded the financial incentives based on some sort of
quantifiable achievement (increase in GPA, achieving a certain test score, attend school a
certain number of days per week, etc.). Champions of Wayne is no different, motivating
students by setting a customized GPA goal that is based on the career average GPA of
38. MENTORING
AND
FINANCIAL
INCENTIVES
31
that particular student. This setup begs the question, “Does the incentive work?” Which
ties directly into research question #4, “How does participation in Champions of Wayne
affect students’ performance in school?” Krathwohl (2009) states that numbers often
have the significant advantage over words because we can differentiate far more precisely
with numbers. For example, let’s assume one student improves from a 2.3 GPA to a 3.0,
and another improves from a 0.3 to a 2.5. Both students have made considerable
academic improvements, but their GPAs differentiate them. Thus, a quantitative aspect
of this study was necessary.
On the contrary, mentoring relationships are more difficult to quantify, and
exploration of an interpersonal relationship seemed best described by words and not
numbers. As Krathwohl (2009) points out, “Adding qualitative data to a quantitative
study can help keep researchers close to participants so they learn what lies behind the
numbers—information crucial to their proper interpretation.” (p. 236) If a student were to
significantly improve his/her GPA, it is worthwhile to know what factors led to this
improvement. Perhaps the financial incentive fueled the achievement, or perhaps this
particular student built a stronger self-efficacy as a result of a positive interpersonal
relationship. Qualitative data can provide this crucial information.
A mixed-methods approach, then, was driven by the study’s needs, and not by the
“desire to be trendy” (Miles, Huberman & Saldana, 2014, p. 43).
Multiple Case Study. While several qualitative approaches to this study may
have been appropriate, I chose to use a multiple case study.
Understanding mentoring relationships, self-efficacy of students, and academic
performance required a detailed look at students’ lives: Family dynamics, academic
39. MENTORING
AND
FINANCIAL
INCENTIVES
32
history, attitudes toward school, perceptions of ability, perception of future, etc. A
narrative would definitely have provided an understanding of the lives of each subject,
but would not have been geared toward understanding their experience with Champions
of Wayne. An ethnography, while very interesting, would have focused on
understanding the culture of the entire student body and missed out on the details of
specific mentoring relationships.
A phenomenological study, which describes the meaning for several individuals who
have experienced a concept or phenomenon (Creswell, 2007) was also considered and
seems to overlap somewhat with the case study. While students in Champions of Wayne
were experiencing the same overall program, it is important to understand that all
mentoring relationships are unique, and that students likely had unique experiences as a
part of the program. According to Merriam (1998), “Case study has proven particularly
useful for studying educational innovations, for evaluating programs, and for informing
policy.” (p. 41) Further, considering the complex nature of mentoring relationships, there
seems to be an unlimited number of variables that might have influenced a given
student’s experience. Merriam (1998) also explains that case studies are particularly
advantageous when variables are so embedded in the situation that they are impossible to
identify ahead of time.
Considering the size of the Champions of Wayne program (over 500 students enrolled
for the semester), an individual case study may have been too narrow to capture the
varying experiences of students in the program. Stake (2013) explains that an important
reason for multiple case research examine how programs and phenomena interact in
different situations. Students at Wayne Memorial came from varying backgrounds, were
40. MENTORING
AND
FINANCIAL
INCENTIVES
33
paired with varying mentors, and are likely to have had vastly different experiences in the
program. To address these variances, a multiple case study was conducted. Merriam
(1998) argues that the more cases involved in a study, and the greater the variation across
the cases, the more compelling the interpretation is likely to be. Also, a common strategy
for enhancing validity and generalizability is to include multiple cases.
According to Creswell (2007), case study research involves the study of an issue
explored through one or more cases within a certain setting or context. Case studies are
conducted through detailed data collection over a period of time, using multiple sources
of information.
To select participants for this study, I used purposeful sampling (Creswell, 2007).
Participants in Champions of Wayne varied in terms of grade, GPA, race, gender,
socioeconomic status, sexual orientation, and so on. I selected five students who I
believed would each show different perspectives on the program. Stake (2013) claims
that the benefits of multiple case study will be limited if fewer than four cases are chosen,
and will be unmanageable if more than 10 cases are chosen. Further, Miles et. al (2014)
suggest “five richly researched cases” (p. 34) for multiple case studies.
The five students were selected from different categories:
• An academically-sound student (2.5 GPA or better) who successfully
attains his/her goal for the fall 2014 semester
• An academically-sound student (2.5 GPA or better) who does not achieve
his/her goal
• A low-achieving student (below 2.5 GPA) who is successful
• A low-achieving student who is unsuccessful
41. MENTORING
AND
FINANCIAL
INCENTIVES
34
• The fifth student was selected based on a need for variety and diversity
among cases
Stake (2013) suggests that one of the main criteria for selecting cases is to provide
diversity across contexts.
Data Collection
Yin (2003) recommends six types of information to collect: Documents, archival
records, interviews, direct observations, participant-observations, and physical artifacts.
Documents were obtained in the form of a student’s school assignments,
Champions contract (with goals, etc.), and other related school paperwork. Archival
records such as a student’s academic and behavioral history were also used.
The interviews were a key component to understanding each student, their
relationships, and their overall experiences as a part of Champions of Wayne. These
interviews were conducted in the interest of understanding their experience and the
meaning they make of that experience.
I interviewed each of the students following their respective experiences as
participants in Champions of Wayne for the 2014-2015 fall semester. In an effort to
understand each student as an individual, the interviews were semi-structured.
Krathwohl (2009) explains that, while no interview is entirely unstructured, less-
structured interviews provide more opportunity to explore the respondent’s view of the
world.
While the interviews were relatively unstructured, I approached each interview
with a list of issues to be covered. Patton (1987) describes six categories of questions
that can be asked during a qualitative interview:
42. MENTORING
AND
FINANCIAL
INCENTIVES
35
• Experience/behavior – events that could have been observed
• Opinion/belief – respondent’s thoughts regarding their experience and what it
means to them
• Feelings – Emotional response to the experience
• Knowledge – Facts that the subject knows
• Senses – What can be seen, smelled, heard, tasted or touched
• Background/demographics – the location of the respondent relative to others
I was sure to cover all six categories of questions with each student, and also attempted to
understand basic concepts regarding each student including:
• Family dynamics
• Reasoning for joining Champions of Wayne
• Dynamics of relationship with mentor
• How the $200 incentive affected personal motivation
• Perceptions of ability
• Perceptions of future
Each interview was what Krathwohl (2009) describes as a “focused interview” (p. 299).
Questions initially searched broad areas to find what was significant, then delved into
increasingly narrow areas when significance was found.
Direct observations and participant-observations were made and recorded
throughout the semester, and were relatively easy to conduct given that I was present in
the school on a daily basis.
This data collection led to a detailed description of each student, their history,
motivation, and experience in the program (Stake, 1995).
43. MENTORING
AND
FINANCIAL
INCENTIVES
36
Quantitative Research – Quasi-Experimental Design
For the quantitative part of the study, a quasi-experimental design was used.
Estimation of the effect of participation in Champions of Wayne on academic
achievement required a comparison between what happened as a result of the treatment
(treatment group), and what would have happened if the treatment had not been
implemented (control group) (Reichardt, 2009).
While a randomized experiment would likely have produced more credible
results, ethical concerns made the quasi-experiment a more desirable option. A truly
randomized sample would have meant that some students would have randomly been
assigned to Champions of Wayne, while others would have been randomly forbidden
from participating (Reichardt, 2009). This quasi-experiment used a treatment group
comprised mostly of students who were proactive in signing up for the program, and a
control group of those who, for one reason or another, elected not to participate. This
provided a clear distinction between those with a mentor and an incentivized goal, and
those without an incentive and an official mentor.
Because Champions of Wayne set customized GPA goals for each
enrolled student based on their respective cumulative GPAs, the quantitative component
of this study focused on the GPA growth for each student. GPA growth (GROWTH) was
be calculated by subtracting each student’s cumulative GPA (CAREER) from their
respective semester GPAs (SEM). The formula will look like this:
• SEM – CAREER = GROWTH
44. MENTORING
AND
FINANCIAL
INCENTIVES
37
For example, Student A entered fall semester carrying a 2.5 CAREER GPA and
subsequently earned a 2.8 SEM, while Student B entered the semester with a 2.1
CAREER and earned a 1.5 SEM.
• Student A: 2.8 – 2.5 = 0.3
• Student B: 1.5 – 2.1 = -0.6
• Student A saw a GPA GROWTH of 0.3 while Student B recorded a -0.6.
The main independent variable for this study was participation in Champions of
Wayne. Students either did or did not participate. Other independent variables that were
analyzed were ethnicity, socioeconomic status, grade level, and gender. The dependent
variable was the GROWTH statistic.
As a member of the Wayne Memorial High School staff, I had access to student
academic records and profiles via Zangle, the web-based student information system
utilized by the Wayne-Westland district.
Data Analysis
As opposed to collecting data for an entire year and then taking the summer to
“go over my notes” (Miles et. al, 2014), I analyzed data concurrently with collection.
Analysis of qualitative data—particularly interviews—was first coded as spelled
out by Saldana (2013). The first cycle of coding grouped subject responses into an array
of categories. Then, the second cycle grouped the existing codes into a smaller number
of themes.
Once codes and themes emerged, interviews and observations were analyzed on
both a within-case basis and a cross-case basis (Miles et. al, 2014). The within-case
45. MENTORING
AND
FINANCIAL
INCENTIVES
38
analysis allowed for study of each student as an individual, whereas the cross-case
analysis led to noteworthy similarities and differences between the cases.
Presentation of this data in chapter five is according to Stake (1995), who
suggests presenting large amounts of data for the reader to self-analyze. He also suggests
seven steps for presenting this data:
1. Opening each case with a selected vignette
2. Describe the issues that will help the reader understand each case
3. Present a body of data
4. Develop a few key issues
5. Probe the issues with experiential data and indications of how points were
confirmed
6. Summarize understandings of each case
7. Use a closing vignette to remind the reader that this is just one person’s encounter
with a complex case
After the data presentation, Yin (2003) suggests creating a word table to display
themes and show how the cases relate to one another. This table has two columns: One
for the themes and the other with a quote from each student that applies directly to the
given theme. After the word table, I compared and contrasted these themes with existing
literature on at-risk students, mentoring, and financial incentives.
Creswell (2007) discusses the use of computer programs in qualitative data
analysis, and suggests that these programs are most useful when analyzing 500 or more
pages of text. While these programs have the ability to streamline the coding process,
Creswell also notes that they put a machine between the researcher and the actual data,
46. MENTORING
AND
FINANCIAL
INCENTIVES
39
creating an uncomfortable distance between the two. I decided to analyze the qualitative
data myself.
Creswell (2007) notes that the processes of data collection, analysis and reporting
do not necessarily have distinct steps. These processes are interrelated, and often occur
simultaneously. Further, Creswell states that qualitative researchers often learn by doing,
and that each study is crafted somewhat differently. He refers to the “data analysis
spiral” (p. 150) where researchers tend to move in analytic circles—data presentation to
analysis, back to presentation and further analysis—rather than in a fixed linear fashion.
Quantitative data analysis begins with a look at the comparability of the treatment
and control groups. To determine statistical similarity of the two populations (treatment
and control) in terms of ethnicity, gender, socioeconomic status, and grade level (9-12),
chi-square tests were used. According to Krathwohl (2009), chi-squares test the fit of
treatment and control groups, as well as eliminate the alternate explanation of sampling
and chance error.
After addressing comparability, quantitative analysis focuses on the GROWTH
statistic. The quantitative analysis targeted research question #4, which asks: How does
participation in Champions of Wayne affect students’ performance in school? The null
hypothesis is that there is no difference between the treatment and control groups, and the
alternative hypothesis is that there is a difference between the two:
H0: There is no difference between the academic growth of students enrolled in
Champions of Wayne and the growth of students not enrolled in Champions of
Wayne.
47. MENTORING
AND
FINANCIAL
INCENTIVES
40
H1: There is a difference between the academic growth of students enrolled in
Champions of Wayne and the growth of students not enrolled in Champions of
Wayne.
To answer this question and determine whether to accept or reject the null
hypothesis (and thus retain the alternate hypothesis), an independent samples t-test is
conducted. Krathwohl (2009) states, “The t-test of differences between means is widely
regarded as accurate and sensitive.” (p. 473)
According to Krathwohl (2009), most social science researchers use a 68%, 95%,
or 99% confidence level when conducting t-tests and chi-square tests. For purposes of
this study, which involves relatively large populations but does not involve life-and-death
decisions, a 95% confidence level is used (p = 0.05).
Limitations/Delimitations
While the mixed methods approach likely makes this a stronger study than strictly
a quantitative or qualitative study (Creswell, 2007), this study is not without limitations
and delimitations.
First, the study is conducted over the course of only one semester, which breaks
down to about four months of schooling and mentoring. Styles and Morrow (1992) state
that mentor-mentee relationships take at least six months before they begin to show true
progress. Some of the relationships studied were preexisting, as many upperclassmen
have known their mentors for years. Others, however, were brand new. The vast
majority of ninth graders, and an assortment of upperclassmen likely had just met their
mentors.
48. MENTORING
AND
FINANCIAL
INCENTIVES
41
Further, the multiple case study involved five out of over 500 participating
students. Purposeful sampling addressed this and ensured a representative sample, but
hundreds of stories remain untold.
On the quantitative side, it can be argued that grades, GPAs, and the GROWTH
statistic are imperfect. While they may be the best available quantitative measures of
academic achievement, GPAs do not account for course rigor (calculus vs. basket-
weaving) or variance in teacher grading habits.
Also, the goal-setting process for Champions of Wayne was an inexact science.
The goals, set by the program director, were generally a 15% increase from a given
student’s cumulative GPA (Cumulative GPA x 1.15 = Goal). The director, however,
analyzed each student’s schedule, course/teacher difficulty, and several other factors
before setting the goal. Often, a student who had experienced a particular life hardship
was given a more reachable goal. Other times, a student who was identified as “talented
but lazy” was challenged with a GPA goal much greater than the usual 15% increase.
Validity, Reliability and Generalizibility
Considering the fact that the two main aspects of the Champions of Wayne
program are mentoring and financial incentives to improve grades, the mixed methods
study was imperative to the validity of the study. While a qualitative study made sense
when examining the effects of mentoring relationships, the face validity of the study
would have suffered without a quantitative element. Krathwohl (2009) defines face
validity as the appearance of validity to a layperson, or someone not as familiar with the
actual validity of a given study. The quantitative element of the study helps to satisfy the
question: “Does this actually work?” In other words, if Champions of Wayne placed an
49. MENTORING
AND
FINANCIAL
INCENTIVES
42
incentive on improving one’s GPA, did students who participated in Champions of
Wayne actually improve their GPAs?
The validity of the qualitative side of the study depends largely on my ability to
remove bias from the interviews and observations. As director of the program, and
someone who has worked with many of these students for over five years, it was
challenging to maintain a researcher perspective at all times. Based on suggestions from
Miles, Huberman and Saldana (2014) to minimize bias, I did my best to:
• Keep research questions firmly in mind
• Show my field notes to colleagues and get their feedback
• Triangulate with several data collection methods
• Think conceptually
• Include dissidents and people with different points of view
Triangulation. Krathwohl (2009) notes that validity is increased when data
is triangulated between two or more sources to establish factual accuracy. For example,
one student claimed that he got in far less trouble in high school than he did in his middle
school days. District behavioral data was obtained to corroborate his story.
The reliability of the quantitative analysis was improved by the fact that the
GROWTH statistic is customized for each student. Instead of comparing the average
GPAs of the treatment and control groups without regard to previous achievement, I
analyzed the differences in growth from the beginning of the semester until the end. This
particularly affects the internal consistency reliability (Krathwohl, 2009).
50. MENTORING
AND
FINANCIAL
INCENTIVES
43
For the qualitative analysis, many of the same measures put into place to improve
validity also helped with reliability. Stability reliability (Krathwohl, 2009) was improved
by multiple sources of data.
Considering the sample sizes that are involved in the quantitative analysis (524
students for the treatment group and 1,142 for control), this study has potential to make a
significant contribution to the relatively small amount of research surrounding incentive
programs. That said, it does not provide a definitive answer to the question of whether or
not incentive programs are effective. Because this is a quasi-experiment and not a
random sample, generalizability is somewhat limited. While the intent is to provide valid
and reliable qualitative research, the complex nature of human relationships makes it
nearly impossible to assert that the mentoring relationships involved in this study will be
easy to replicate.
51. MENTORING
AND
FINANCIAL
INCENTIVES
44
CHAPTER IV
QUANTITATIVE DATA AND ANALYSIS
This chapter presents a statistical analysis of the Champions of Wayne program
from the fall semester of the 2014-2015 school year. The first section is an analysis of
the comparability of the treatment group (students enrolled in Champions of Wayne) and
the control group. The following section is an analysis of the GPA growth for each group
overall, and the last section of this chapter provides a look at GPA growth within each
group.
The financial incentive aspect of Champions of Wayne involved a $200 incentive
for each student who achieved a customized semester grade point average (GPA) goal.
These goals were set by the program director, and generally involved a 15%
improvement from each student’s CAREER (cumulative) GPA. For example, a student
with a 3.0 CAREER GPA likely had a goal of a 3.5 GPA for the semester.
Because the financial incentive was based on individual GPA growth, the
quantitative analysis focused on the GROWTH statistic, which was calculated by
subtracting each student’s CAREER GPA from his/her semester GPA (SEM). This
analysis sought to determine whether or not there were statistically significant differences
between the treatment and control groups. A 95% confidence level was used (p=0.05).
For the fall semester of 2014, Wayne Memorial High School was home to 1,666
students who started and finished the semester. Students who enrolled or withdrew
during the semester were dropped from the study, as were students in the SXI
(cognitively impaired) department. Of the population, 524 students were enrolled in
Champions of Wayne, leaving 1,142 who were not.
52. MENTORING
AND
FINANCIAL
INCENTIVES
45
Comparability
In the following tables, Group 1 refers to students enrolled in Champions, and
Group 2 refers to those not enrolled. For purposes of this study, each population is
broken down into four subcategories: Ethnicity, Socioeconomic Status (Free Lunch,
Reduced-Price Lunch, or Full Pay Lunch), Grade Level (9-12), and Gender. Before GPA
results, comparability of the treatment and control groups is discussed.
Ethnicity. Table 1 shows the breakdown of both groups in terms of ethnicity.
Wayne Memorial is home to large African-American and white populations, and has
smaller Native American, Latino, and Asian populations. The smaller populations are
small enough (less than 50 students in each group) that they are grouped together as
“Other” for purposes of this study.
Table 1
Ethnicity
Group Frequency Percent Valid Percent
Cumulative
Percent
African-American 199 38.0 38.0 38.0
Other 25 4.7 4.8 42.7
White 300 57.3 57.3 100.0
1
Total 524 100.0 100.0
African-American 379 33.2 33.2 33.2
Other 80 7.0 7.0 40.2
White 683 59.8 59.8 100.0
2
Total 1142 100.0 100.0
Table 1 makes it evident that the two groups are proportionally close, but not
exactly equal. For example, Group 1 (Champions) is comprised of 38% African-
American students, while Group 2 (control) is 33.2% African-Americans.
In Table 2, actual count (same information as Table 1) is displayed above the
53. MENTORING
AND
FINANCIAL
INCENTIVES
46
“expected count,” which represents the number of each demographic that would be in
each group if both populations were evenly distributed across ethnicity. Table 2 shows
that the actual count of each ethnicity is not exactly the same as the expected count;
however, the actual count does seem to be somewhat close to the expected count in each
ethnicity. For example, if Champions of Wayne enrollment across ethnicity were to
mirror that of Wayne Memorial High School, 181.8 African American students would be
expected to enroll in Champions of Wayne (first row, Group 1). The actual enrollment,
however, is slightly higher at 199. This means there is a slightly higher percentage of
African-American students enrolled in Champions of Wayne than in the overall Wayne
Memorial student body. Further, there is s slightly lower percentage of white and “other”
students enrolled in Champions of Wayne than in the overall student body. The question
then becomes, is this a statistically significant difference?
Table 2
Ethnicity
Actual Count vs. Expected Count
Group
1 2 Total
Count 199 379 578African-
American Expected Count 181.8 396.2 578.0
Count 25 80 105Other
Expected Count 33.0 72.0 105.0
Count 300 683 983
Ethnicity
White
Expected Count 309.2 673.8 983.0
Count 524 1142 1666Total
Expected Count 524.0 1142.0 1666.0
Table 3 displays results from a chi-square test. For this study, as well as most
social science research, a 95% level of significance (p=0.05) is used. With that, the
54. MENTORING
AND
FINANCIAL
INCENTIVES
47
Pearson Chi-Square significance value would need to be below 0.05 for the two groups
(Champions and control) to be considered statistically different. Table 3 displays a value
of 0.06.
Table 3
Ethnicity
Chi-Square Tests
Value df
Asymp. Sig.
(2-sided)
Pearson Chi-
Square
5.618a
2 .060
Likelihood Ratio 5.731 2 .057
N of Valid Cases 1666
p = 0.06
Socioeconomic Status. Table 4 presents a socioeconomic breakdown of the two
groups. Again, both groups seem to be proportionally even when looking at
representation from students receiving a free lunch, a reduced-price lunch, and those who
pay for their lunch in full.
Table 4
Socioeconomic Status
Free, Reduced, and Full-Pay Lunch Status
Group Frequency Percent Valid Percent
Cumulative
Percent
Free 287 54.8 54.8 54.8
Full-pay 175 33.4 33.4 88.2
Reduced 62 11.8 11.8 100.0
1
Total 524 100.0 100.0
Free 642 56.2 56.2 56.2
Full-pay 391 34.2 34.2 90.5
Reduced 109 9.5 9.5 100.0
2
Total 1142 100.0 100.0
55. MENTORING
AND
FINANCIAL
INCENTIVES
48
Table 5 and Table 6 show that there is very little difference between the two
groups in terms of socioeconomic status. The actual counts are similar to the expected
counts, and the significance value of 0.36 is far above the critical 0.05.
Table 5
Socioeconomic Status
Actual Count vs. Expected Count
Group
1 2 Total
Count 287 642 929Free
Expected
Count
292.2 636.8 929.0
Count 175 391 566Full-pay
Expected
Count
178.0 388.0 566.0
Count 62 109 171
STATUS
Reduced
Expected
Count
53.8 117.2 171.0
Count 524 1142 1666Total
Expected
Count
524.0 1142.0 1666.0
Table 6
Socioeconomic Status
Chi-Square Tests
Value df
Asymp. Sig.
(2-sided)
Pearson Chi-
Square
2.041a
2 .360
Likelihood Ratio 1.996 2 .369
N of Valid Cases 1666
p = 0.36
56. MENTORING
AND
FINANCIAL
INCENTIVES
49
Grade Level. Similar to many other high schools, students at Wayne Memorial
are grouped into four grades: 9th
, 10th
, 11th
, and 12th
grade. It is important to note that
students are grouped into these grades based on completed credits, and not necessarily by
how many years they have been in high school. For example, a 9th
grade student who
fails a number of classes his/her first year in high school will be classified as a 9th
grader
the following year.
Table 7 presents a breakdown of each group by grade level (Group 1:
Champions, Group 2: Control). One noteworthy difference emerges when looking at the
percentage of 9th
graders enrolled in Champions (20.4%) and the percentage of 9th
graders in the control group (35.6%).
Table 7
Grade Level
Group Frequency Percent
Cumulative
Percent
9 107 20.4 20.4
10 117 22.3 42.7
11 156 29.8 72.5
12 144 27.5 100.0
1
Total 524 100.0
9 406 35.6 35.6
10 268 23.5 59.0
11 235 20.6 79.6
12 233 20.4 100.0
2
Total 1142 100.0
Table 8 shows the actual count in each group as compared to the expected count.
57. MENTORING
AND
FINANCIAL
INCENTIVES
50
Table 8
Grade Level
Actual Count vs. Expected Count
Group
1 2 Total
Count 107 406 5139
Expected
Count
161.4 351.6 513.0
Count 117 268 38510
Expected
Count
121.1 263.9 385.0
Count 156 235 39111
Expected
Count
123.0 268.0 391.0
Count 144 233 377
GRADE
12
Expected
Count
118.6 258.4 377.0
Count 524 1142 1666Total
Expected
Count
524.0 1142.0
1666.
0
Table 9 displays chi-square, or “goodness of fit” test, to determine if the two
groups are statistically different in terms of grade-level. The key number here is the 0.00
value in the first row (Pearson Chi-Square).
58. MENTORING
AND
FINANCIAL
INCENTIVES
51
Table 9
Grade Level
Chi-Square Tests
Value df
Asymp.
Sig. (2-
sided)
Pearson Chi-
Square
47.798a
3 .000
Likelihood
Ratio
49.100 3 .000
Linear-by-
Linear
Association
40.768 1 .000
N of Valid
Cases
1666
p = 0.000
Gender. The number and percentage of males and females in each group is
displayed in Table 10. There is a noticeable difference in the Champions group (Group
1), which is comprised of 319 females and 205 males. Roughly 61% of students enrolled
in Champions of Wayne are female.
Table 10
Gender
Group Frequency Percent
Valid
Percent
Cumulative
Percent
F 319 60.9 60.9 60.9
M 205 39.1 39.1 100.0
1 Valid
Total 524 100.0 100.0
F 542 47.5 47.5 47.5
M 600 52.5 52.5 100.0
2 Valid
Total 1142 100.0 100.0
59. MENTORING
AND
FINANCIAL
INCENTIVES
52
The actual count of each gender is compared with the expected count if the
student population were evenly distributed. There are more female students at Wayne
Memorial than male students.
Table 11
Gender
Actual Count vs. Expected Count
Group
1 2 Total
Count 319 542 861F
Expected
Count
270.8 590.2 861.0
Count 205 600 805
GENDER
M
Expected
Count
253.2 551.8 805.0
Count 524 1142 1666Total
Expected
Count
524.0 1142.0 1666.0
The chi-square, or “goodness of fit” test is displayed in Table 12. Again, the third
column of the first row (Pearson Chi-Square) is the key figure. A value of greater than
0.05 would result in a 95% confidence that the two groups are statistically equal in terms
of gender representation. Below 0.05 leads to a conclusion that the two groups are
statistically different.
60. MENTORING
AND
FINANCIAL
INCENTIVES
53
Table 12
Gender
Chi-Square Tests
Value df
Asymp. Sig.
(2-sided)
Exact Sig. (2-
sided)
Exact Sig. (1-
sided)
Pearson Chi-
Square
25.894a
1 .000
Continuity
Correctionb 25.360 1 .000
Likelihood Ratio 26.065 1 .000
Fisher's Exact
Test
.000 .000
N of Valid Cases 1666
p = 0.000
Growth Scores
Research question #4 asks: How does participation in Champions of Wayne
impact students’ performance in school? Largely, this is where the quantitative analysis
comes into play. Each student at Wayne Memorial enters a given semester with a career
(or average) GPA. For students in grades 10-12, this is an average of each semester GPA
that they have achieved in high school until the beginning of the given semester.
Obviously, ninth graders will not have a career high school GPA entering their first
semester, but cumulative middle school GPAs were obtained for each ninth grader to be
used as a baseline for their GPA growth.
With the Career GPA (CAREER) as the baseline, and the 2014 fall semester GPA
as a measure of academic performance, each student ends up with a difference between
the two numbers, which represents their growth. The formula to calculate growth for
each student would then be: SEM1 – CAREER = GROWTH.
61. MENTORING
AND
FINANCIAL
INCENTIVES
54
For example, student A enters the semester with a 2.0 CAREER, and obtains a 2.6
SEM1:
2.6 – 2.0 = +0.6 GROWTH
On the flip side, student B enters the semester with a 2.0 CAREER and obtains a
1.8 SEM1:
1.8 – 2.0 = -0.2 GROWTH
Because the Champions of Wayne incentive is based on growth off of a career
GPA in a given semester, this is the key statistic for the quantitative analysis.
The mean (average) GROWTH score for each group is displayed in Table 13.
The Champions group (Group 1) has an average GROWTH of 0.13, while the average
GROWTH for the control group (Group 2) is -0.29. The difference between the two
means is 0.42.
Table 13
Mean (average) GROWTH
Group 1 (Champions) vs. Group 2 (Control)
Group N Mean Std. Deviation
Std. Error
Mean
1 524 .12912 .635156 .027747GROWTH
2 1142 -.29096 1.292141 .038236
To determine if this is a significant difference, an independent samples T-test was
conducted. Table 14 displays the results of the T-test. The significance value under
Levine’s Test is less than 0.05, which means that the two means are not statistically
equal. Further, the T-test concludes that there is a 95% confidence that, if the test were to
be run again with similar groups, the difference between the two mean GROWTH scores
(Champions and control) would be between 0.32 and 0.51.
62. MENTORING
AND
FINANCIAL
INCENTIVES
55
Table 14
GROWTH Averages
Champions vs. Control
Independent Samples Test
Levene's Test for
Equality of
Variances t-test for Equality of Means
95% Confidence
Interval of the
Difference
F Sig. t df
Sig. (2-
tailed)
Mean
Difference
Std. Error
Difference Lower Upper
Equal
variances
assumed
162.186 .000 7.060 1664 .000 .420082 .059501 .303378 .536787
Differ
ence
Equal
variances
not assumed
8.892 1656.781 .000 .420082 .047243 .327420 .512745
p = 0.000
Program Effects
The significant difference in GROWTH between treatment and control groups
warrants a deeper look into the subgroups of both. Table 15 displays mean GROWTH
scores as they pertain to ethnicity. African-American students scored above the mean in
both groups (Champions and control), while white students scored slightly below.
63. MENTORING
AND
FINANCIAL
INCENTIVES
56
Table 15
GROWTH Averages
Champions vs. Control
By Ethnicity
Difference
Group ETHNICITY Mean N
Std.
Deviation
African-
American
.15328 199 .609778
Other -.05864 25 .607244
White .12874 300 .653062
1
Total .12912 524 .635156
African-
American
-.26516 379 1.287994
Other -.24001 80 1.238030
White -.31125 683 1.302009
2
Total -.29096 1142 1.292141
Table 16 presents GROWTH scores for each group, broken down by
socioeconomic status. Consistently, students in the Champions group (treatment) scored
positive GROWTH means, while students in the control group scored in the negative
across the board. There are differences, however, within each group. The treatment
group shows an increase in GROWTH scores as socioeconomic status increases, with
more affluent students outperforming less. Students receiving a free or reduced price
lunch in the control group, however, outperformed their more affluent counterparts.
64. MENTORING
AND
FINANCIAL
INCENTIVES
57
Table 16
GROWTH Averages
Champions vs. Control
By Socioeconomic Status
Difference
Group STATUS Mean N
Std.
Deviation
Free .09702 287 .697351
Full-pay .17642 175 .525742
Reduced .14419 62 .615549
1
Total .12912 524 .635156
Free -.28284 642 1.315433
Full-pay -.30519 391 1.273631
Reduced -.28778 109 1.229001
2
Total -.29096 1142 1.292141
Table 17 displays the GROWTH scores for each group, broken down by grade
level. Average GROWTH was negative for all grade levels in the control group, while
only 9th
graders had a negative average GROWTH score in the treatment group.
65. MENTORING
AND
FINANCIAL
INCENTIVES
58
Table 17
GROWTH Averages
Champions vs. Control
By Grade Level
Difference
Group
GRAD
E Mean N
Std.
Deviation
9 -.32403 107 .583432
10 .06275 117 .568731
11 .29579 156 .614484
12 .33919 144 .565229
1
Total .12912 524 .635156
9 -.39149 406 1.319560
10 -.28066 268 1.372561
11 -.21055 235 1.275654
12 -.19687 233 1.150052
2
Total -.29096 1142 1.292141
Mean GROWTH scores according to gender were also analyzed. Table 18
presents the results. Females outperformed males in both groups.
Table 18
GROWTH Averages
Champions vs. Control
By Gender
Difference
Group GENDER Mean N
Std.
Deviation
F .13728 319 .652502
M .11642 205 .608537
1
Total .12912 524 .635156
F -.27590 542 1.335905
M -.30457 600 1.252257
2
Total -.29096 1142 1.292141
66. MENTORING
AND
FINANCIAL
INCENTIVES
59
Quantitative Analysis - Summary of Methodology
Champions of Wayne combines mentoring with financial incentives that are based
on customized goals for each individual student. Largely, these are grade point average
(GPA) goals based on levels of previous achievement. Research question 4 asks: How
does participation in Champions of Wayne affect students’ performance in school?
While the other three research questions lend themselves to a qualitative study, this
question is best answered in a quantitative manner. The null hypothesis (H0) and the
alternate hypothesis (H1) are expressed as:
H0: There is no difference between the academic growth of students enrolled in
Champions of Wayne and the growth of students not enrolled in Champions of Wayne.
H1: There is a difference between the academic growth of students enrolled in
Champions of Wayne and the growth of students not enrolled in Champions of Wayne.
For this study, a 95% confidence level (p = 0.05) is used, meaning that t-tests and
chi-square tests must have significance values below 0.05 to reject the null hypothesis
and conclude that there is a significant difference between the two populations.
The effect of participation in the program was tested by comparing a treatment
group—Wayne Memorial High School students who participated in Champions of
Wayne during fall semester 2014-2015—and a control group—WMHS students who did
not participate in Champions.
The key statistic of analysis for this study was the GROWTH score, which is
calculated by subtracting each student’s cumulative (Career) GPA from the GPA earned
during the fall semester. Because Champions of Wayne incents improvement from
previous levels of achievement, this was the logical method of quantitative analysis.