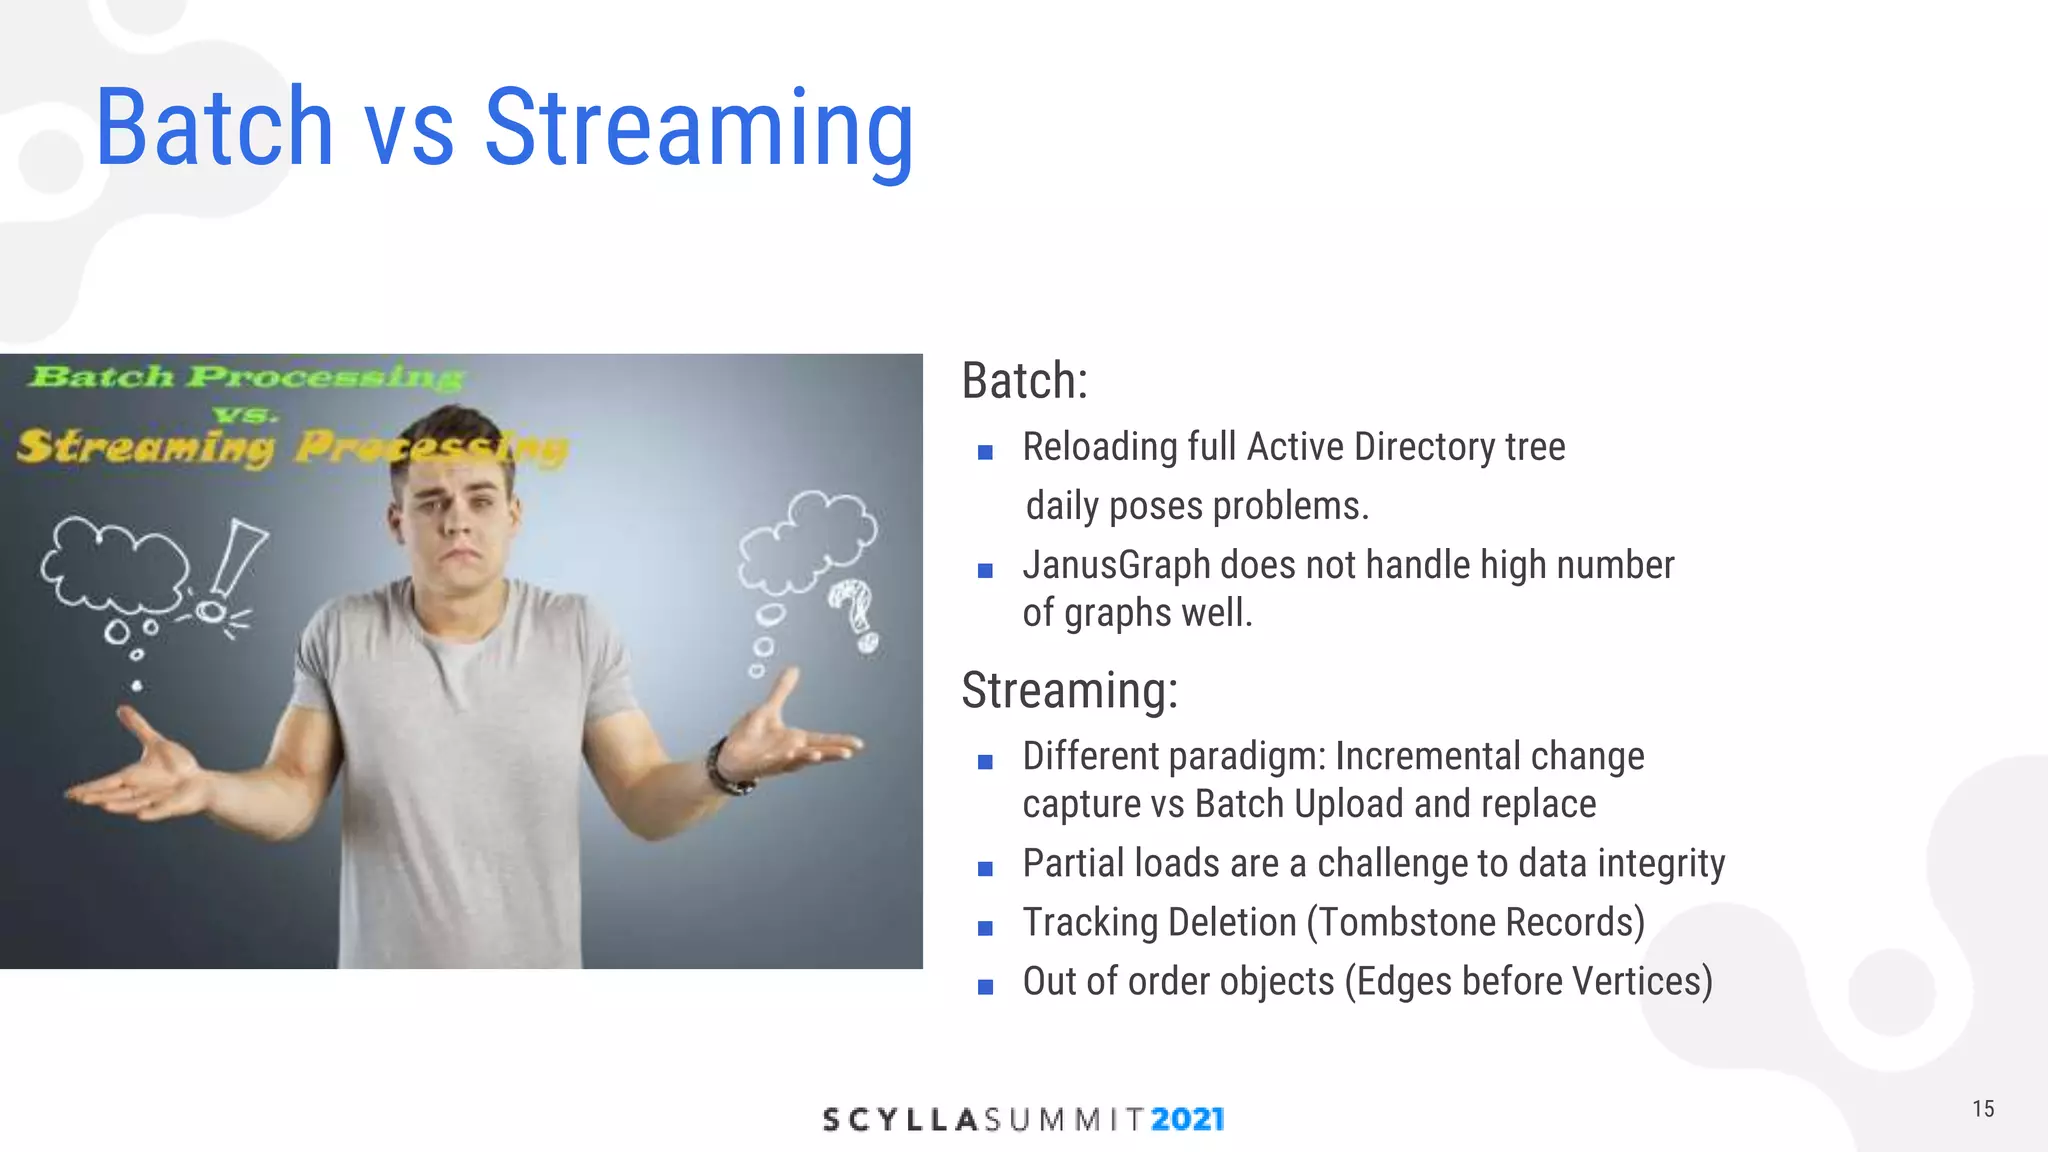
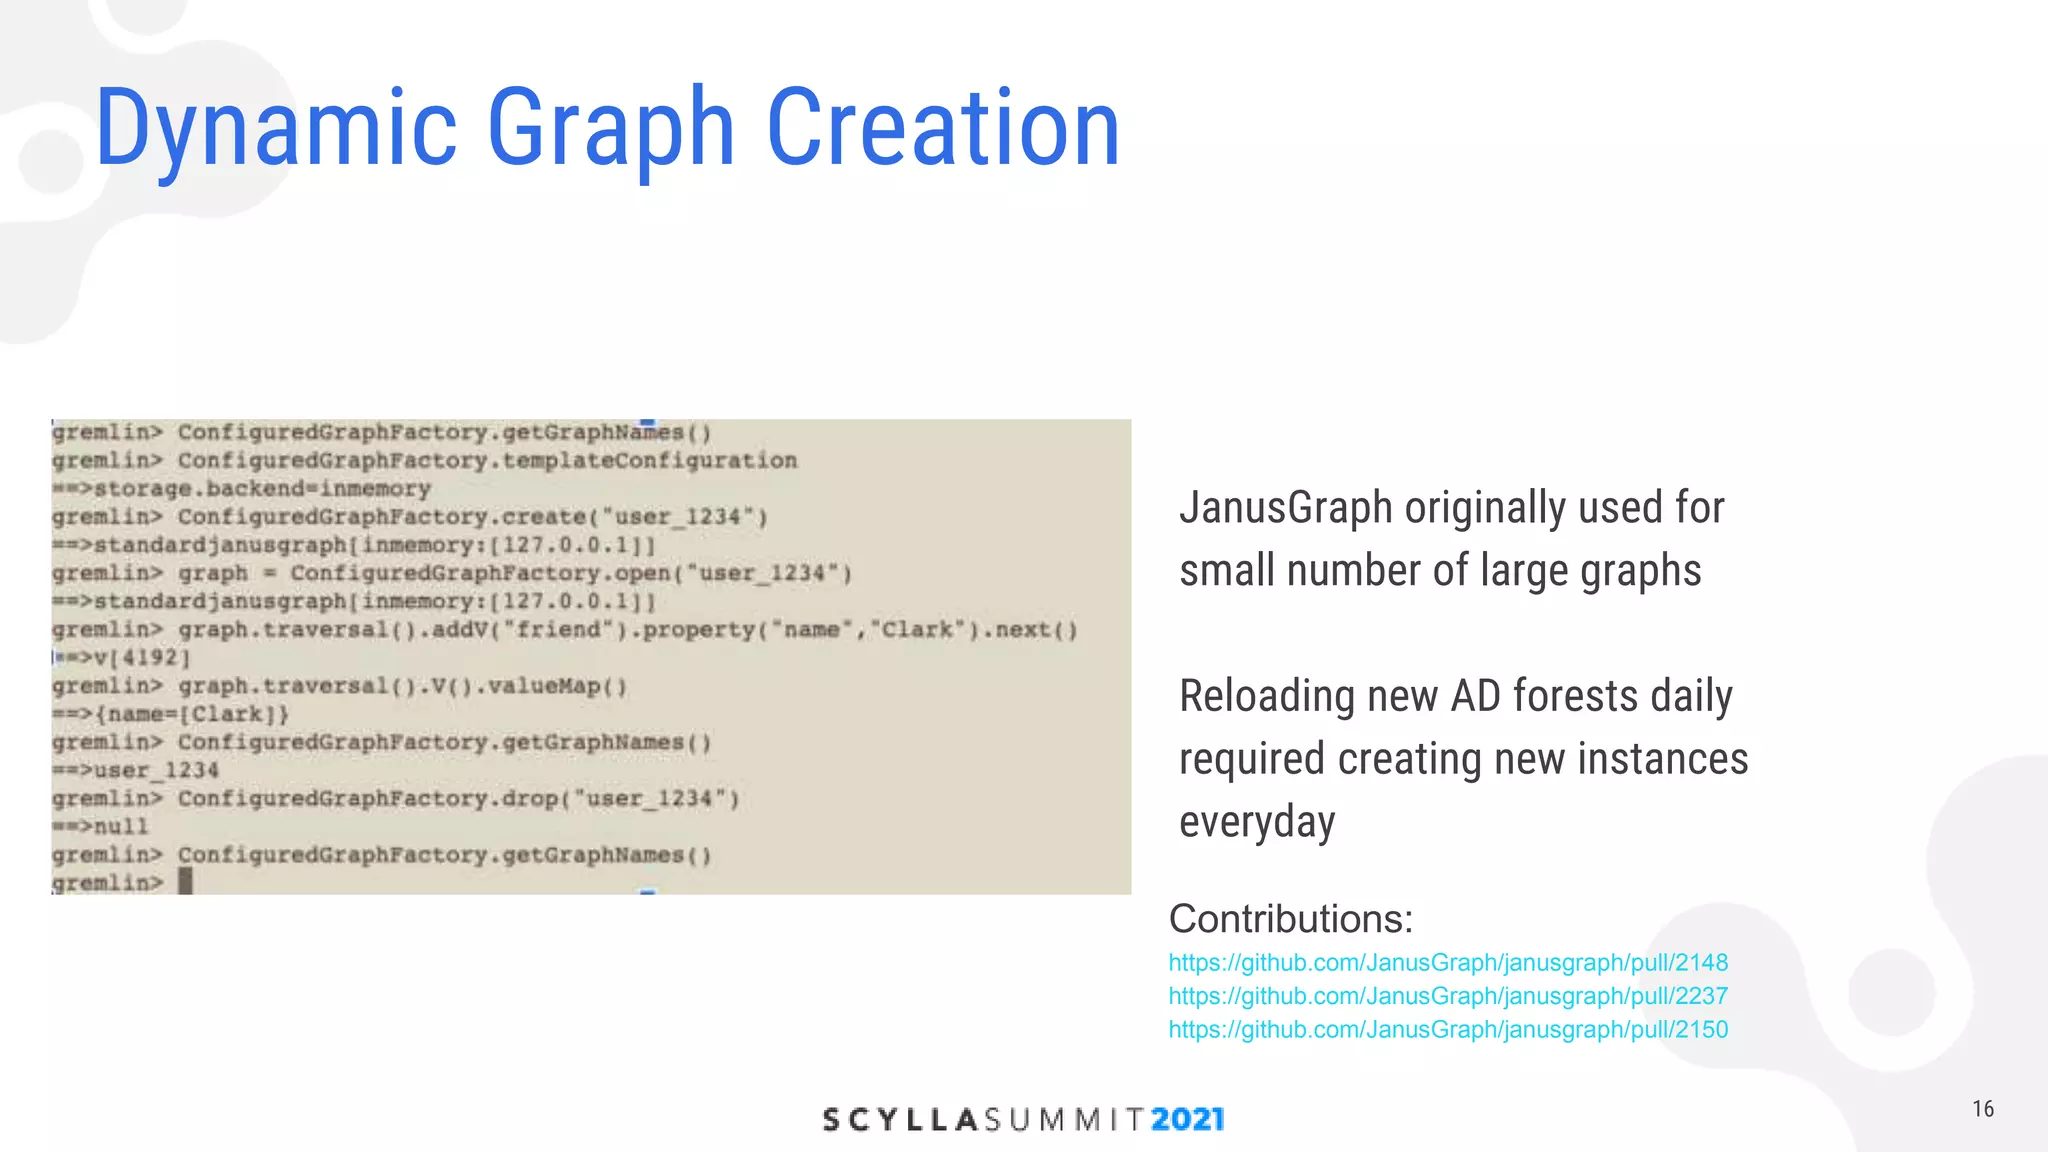
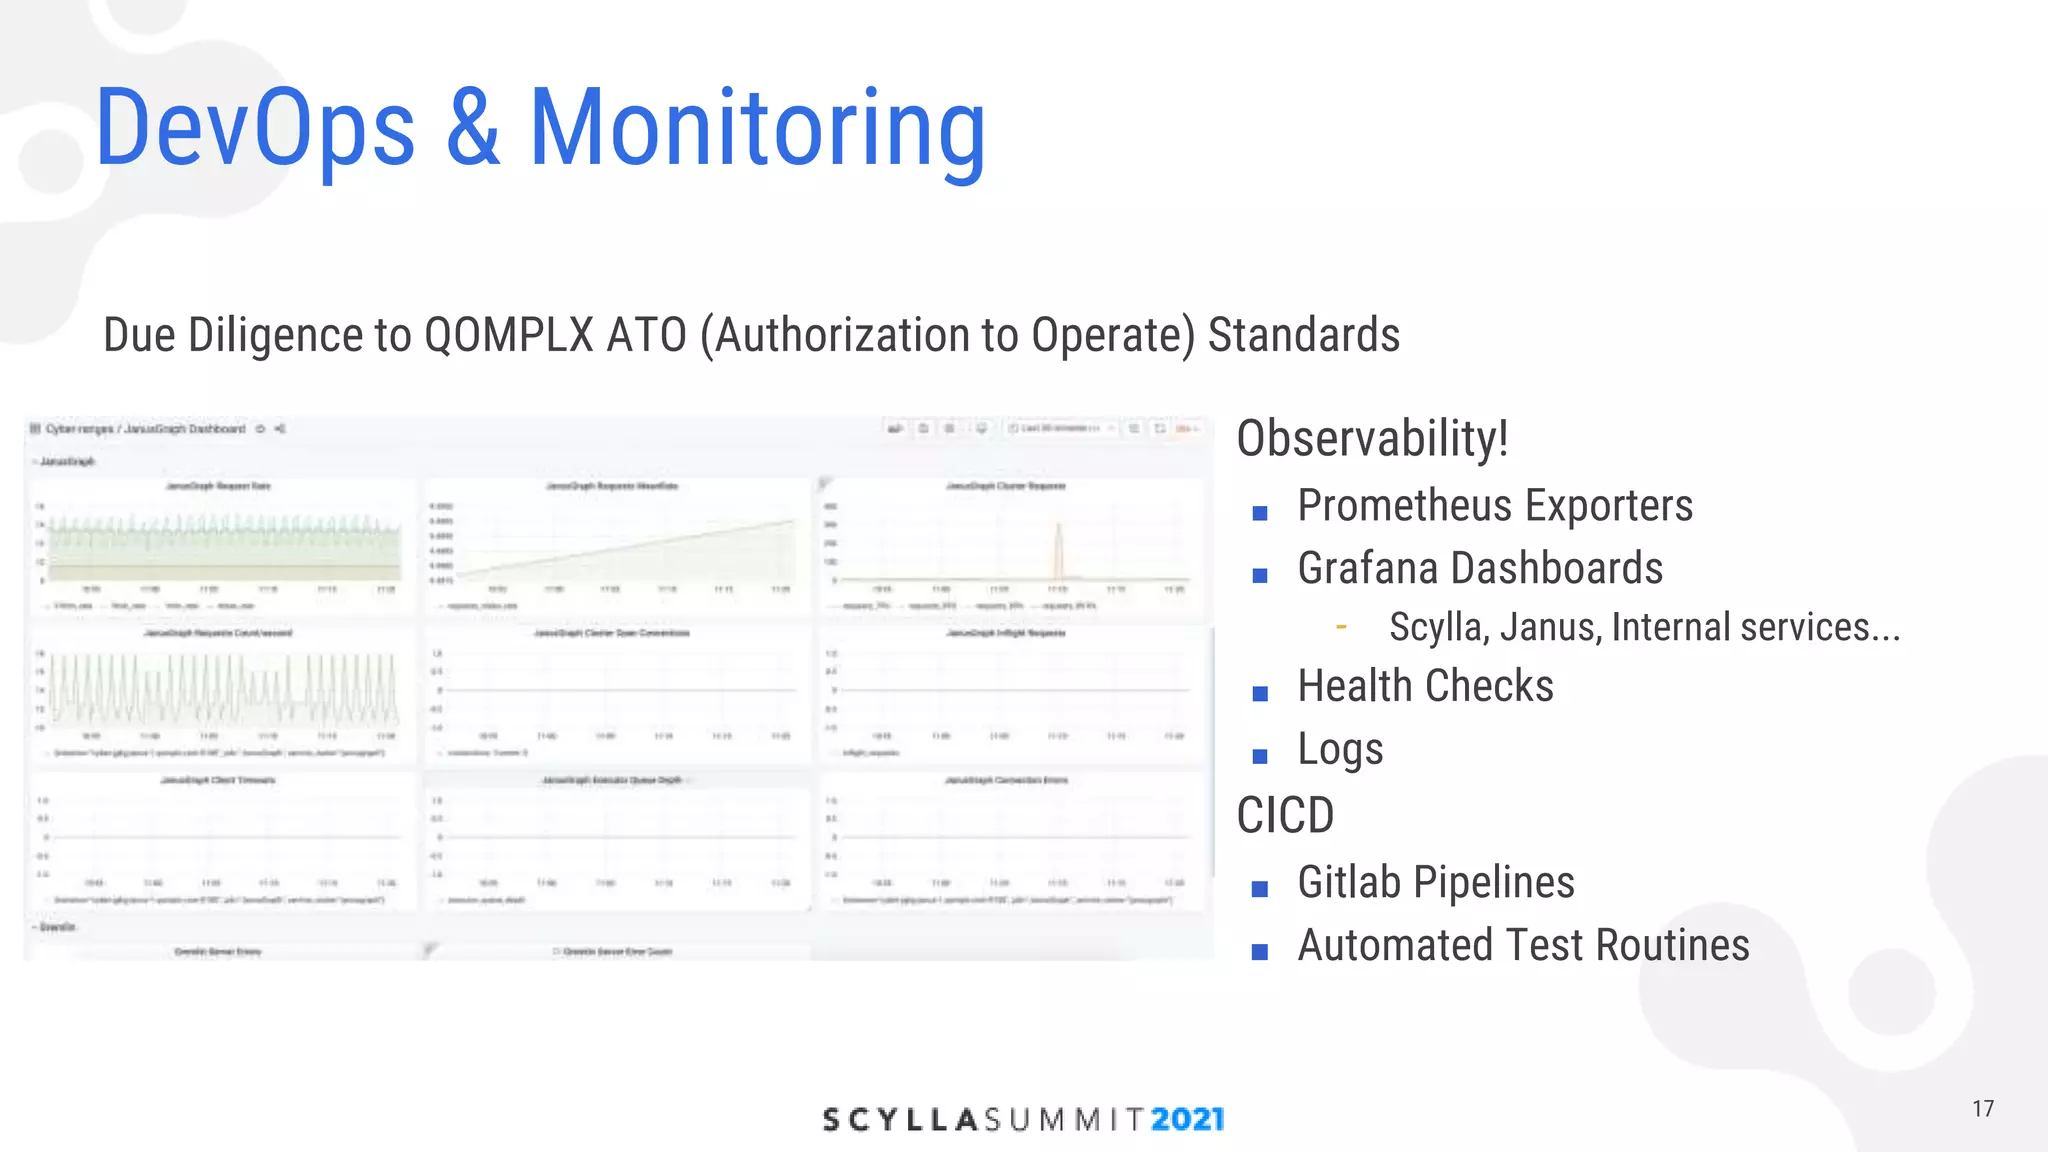
Using ScyllaDB with JanusGraph for Cyber Security

Editor's Notes

  • #11 So what did we learn during this project?
  • #12 First of all, as if we needed another reminder, graph analytics jobs are tough and computationally expensive. While not all applications require subsecond responses - in this case, our SOC analysts did. We couldn't afford to wait several minutes or hours in order to do some of the path analysis you saw in Angad’s demo.
  • #13 OLAP workloads in Janus are commonly offloaded to Spark. As a baseline, we tried the well worn path of Janus + Spark. While we still offer this facility for some more generalized workloads, for the SOC analysts a 30min response time for some of the queries you saw was just not going to cut it. Shorter path queries would return in several minutes or hours, longer queries were wholly impractical - taking days or simply not completing at all.
  • #14 Therefore, for a small number of key computations, we opted to use something called boostgraph. Boostgraph is a minimum subset of the graph stored in-memory. While you can’t use it as a proper graph database, you can use if for very specific computations. It can be spun and down as needed quickly to keep an eye on hosting costs and you can manage your instance size so that you allocate only the amount of memory that you need.
  • #15 And it was worth it. In boostgraph, we were able to get the most common path queries to return subsecond. This is what the SOC analyst use cases required and was a game changer in terms of the sorts of user experience we were able to provide.
  • #16 Another key takeaway, as is common in most data pipelines, was whether updates coming in from client’s Active Directory instances would come in as a batch or streaming message based. Streaming presents problems in sequencing of data (what happens when edges come in before the vertices they connect). How do you send over deletions or user’s removed from AD? And in general, detecting changes in AD is not that easy to begin with. We also learned that wholesale batches posed challenges as well. Rather than doing upserts into fully populated graphs, we opted to keep multiple revisions of a client’s AD representation (today, yesterday, etc). And due to the nuances of how the AD is organized at the client, a single client many have many AD instances and consequently many revisions of that graph.
  • #17 So a big new learning, that required patches submitted back to the Janus community, was how to handle a high number of average sized graphs. In many graph discussions, you see discussions around how to handle BIG graphs - and while some of our graphs can be of decent size, our challenge was not with abnormally large graphs but rather how to deal with ALOT of distinct graphs. So we found ourselves traipsing through a part of the Janus codebase that was especially immature and needed some surgery. Namely the ability to add and remove graphs on the fly - which we did by submitting updates to the ConfiguredGraphFactory. And in doing so, we also learned that having a high number of graphs also applies alot of memory pressure on the heap. So we had to also address the fashion of pruning older revisions to clean up the previous instances.
  • #18 What can we say about monitoring and devops deployment? Keeping multiple representations of graph data updated in hosted service, don’t cut corners. Qomplx’s advanced ATO process provided a good rubric for getting ready and keeping optics on the system.
  • #19 And lastly, why we’re all here. Having spoken at the last scylla summit about how much we like Scylla underneath Janus as the storage layer, our perspective has only strengthen. What can I say, it just works. In a challenging, multi technology environment, there was no drama.