1. 29 January 2014
Scania Year-end Report, January–December 2013
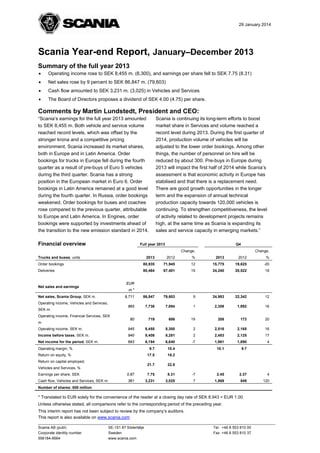
Summary of the full year 2013
•
Operating income rose to SEK 8,455 m. (8,300), and earnings per share fell to SEK 7.75 (8.31)
•
Net sales rose by 9 percent to SEK 86,847 m. (79,603)
•
Cash flow amounted to SEK 3,231 m. (3,025) in Vehicles and Services
•
The Board of Directors proposes a dividend of SEK 4.00 (4.75) per share.
Comments by Martin Lundstedt, President and CEO:
Scania is continuing its long-term efforts to boost
market share in Services and volume reached a
record level during 2013. During the first quarter of
2014, production volume of vehicles will be
adjusted to the lower order bookings. Among other
things, the number of personnel on hire will be
reduced by about 300. Pre-buys in Europe during
2013 will impact the first half of 2014 while Scania’s
assessment is that economic activity in Europe has
stabilised and that there is a replacement need.
There are good growth opportunities in the longer
term and the expansion of annual technical
production capacity towards 120,000 vehicles is
continuing. To strengthen competitiveness, the level
of activity related to development projects remains
high, at the same time as Scania is expanding its
sales and service capacity in emerging markets.”
“Scania’s earnings for the full year 2013 amounted
to SEK 8,455 m. Both vehicle and service volume
reached record levels, which was offset by the
stronger krona and a competitive pricing
environment. Scania increased its market shares,
both in Europe and in Latin America. Order
bookings for trucks in Europe fell during the fourth
quarter as a result of pre-buys of Euro 5 vehicles
during the third quarter. Scania has a strong
position in the European market in Euro 6. Order
bookings in Latin America remained at a good level
during the fourth quarter. In Russia, order bookings
weakened. Order bookings for buses and coaches
rose compared to the previous quarter, attributable
to Europe and Latin America. In Engines, order
bookings were supported by investments ahead of
the transition to the new emission standard in 2014.
Financial overview
Full year 2013
Q4
Change,
Trucks and buses, units
Change,
2013
2012
%
2013
2012
%
Order bookings
80,935
71,945
12
15,775
19,625
-20
Deliveries
80,464
67,401
19
24,240
20,522
18
9,711
86,847
79,603
9
24,983
22,342
12
865
7,736
7,694
1
2,308
1,992
16
80
719
606
19
208
173
20
Operating income, SEK m.
945
8,455
8,300
2
2,516
2,165
16
Income before taxes, SEK m.
940
8,408
8,281
2
2,483
2,125
17
Net income for the period, SEK m.
693
6,194
6,640
-7
1,961
1,890
4
Operating margin, %
9.7
10.4
10.1
9.7
Return on equity, %
17.5
19.2
21.7
22.8
EUR
Net sales and earnings
m.*
Net sales, Scania Group, SEK m.
Operating income, Vehicles and Services,
SEK m.
Operating income, Financial Services, SEK
m.
Return on capital employed,
Vehicles and Services, %
Earnings per share, SEK
0.87
7.75
8.31
-7
2.45
2.37
4
Cash flow, Vehicles and Services, SEK m.
361
3,231
3,025
7
1,869
849
120
Number of shares: 800 million
* Translated to EUR solely for the convenience of the reader at a closing day rate of SEK 8.943 = EUR 1.00.
Unless otherwise stated, all comparisons refer to the corresponding period of the preceding year.
This interim report has not been subject to review by the company’s auditors.
This report is also available on www.scania.com
Scania AB (publ)
Corporate identity number
556184-8564
SE-151 87 Södertälje
Sweden
www.scania.com
Tel. +46 8 553 810 00
Fax +46 8 553 810 37
2. Scania Year-end Report January-December 2013
Business overview
Number of vehicles
delivered
2010
2011
2012
Net sales (SEK m.)
2013
2010
27,000
2011
2012
Operating income (SEK m.)
2013
2010
25,000
24,000
2012
2013
3,600
20,000
21,000
3,200
2,800
18,000
15,000
15,000
2,400
2,000
12,000
10,000
1,600
9,000
1,200
6,000
5,000
800
3,000
0
2011
4,000
400
Q1
Q2
Q3
Q4
0
Q1
Q2
Q3
Q4
0
Q1
Q2
Q3
Q4
Sales performance
During the full year 2013, total vehicle deliveries reached a record level and increased by 19 percent to
80,464 (67,401) units, compared to the same period of 2012. Net sales rose by 9 percent to SEK 86,847 m
(79,603). Currency rate effects had a negative impact of 5 percent on sales.
Order bookings rose by 12 percent to 80,935 (71,945) vehicles, compared to the full year 2012.
During the fourth quarter, deliveries increased by 18 percent to 24,240 (20,522) vehicles and net sales
rose to SEK 24,983 m. (22,342), an upturn of 12 percent. Currency rate effects had a negative impact of
4 percent on sales. Order bookings fell by 20 percent to 15,775 (19,625) vehicles.
Strong position in transition to Euro 6
In March 2013, Scania unveiled Scania Streamline, a new long-haulage truck concept featuring refined
technology and new solutions that enable customers to reduce fuel consumption by up to 8 percent. The
trucks have an aerodynamic design and feature a new version of the Scania Opticruise automated
gearchanging system. Scania also expanded its engine range, adding second generation Euro 6 engines,
which have lower fuel consumption than their Euro 5 predecessors. Scania can offer a complete range of
Euro 6 engines and has extensive experience, due to early introduction of Euro 6 vehicles. The Euro 6
vehicles Scania uses in its own haulage operations, along with Scania Euro 6 test vehicles operated by
customers have covered more than 26 million kilometres. Overall, Scania has a strong position in the
transition to Euro 6.
Adjustment of production rate
In Europe, production volume was record high during the fourth quarter, which was the last quarter for
production of Euro 5 vehicles for the European market. In Latin America, temporary uncertainty regarding
subsidised financing in Brazil meant that production during the fourth quarter was stopped for one week
longer than planned. Production volume in Europe and Latin America will be adjusted to lower demand
during the first quarter of 2014. The adjustment will be handled using the existing flexibility at Scania,
among other ways by adjusting working hours downward within the framework of the time bank system.
The number of personnel on hire will be reduced by about 300 during the first quarter of 2014.
Stabilisation in Europe
Pre-buys in Europe in terms of order bookings during the second and third quarters of 2013 will impact the
first half of 2014 while Scania’s assessment is that economic activity has stabilised and that there is a
replacement need. Demand for used vehicles in Europe is good and used vehicle inventories fell
significantly during the fourth quarter. The price level of new trucks improved somewhat in late 2013 due to
the introduction of Streamline. In a global perspective, there are good growth opportunities in the longer
term and the expansion of annual technical production capacity towards 120,000 vehicles is continuing.
2
3. Scania Year-end Report January-December 2013
The truck market
Order bookings
Scania's order bookings during the full year 2013 amounted to 73,678 (65,885) trucks, an increase of
12 percent compared to the same period in 2012. In the fourth quarter, order bookings decreased by
21 percent to 14,273 (18,177) units. Order bookings were lower than in the third quarter of 2013, mainly in
Europe.
The downturn in Europe during the fourth quarter was a correction from a high level in the third quarter of
2013, when order bookings in Europe were supported by customers that invested in Euro 5 vehicles before
the transition to Euro 6. Compared to the fourth quarter of 2012, the decrease was 21 percent to 5,908
(7,470) trucks. The majority of order bookings in the fourth quarter was for Euro 6 trucks. The Euro 6
emission standard was introduced in the European Union on December 31, 2013. Owing to significantly
more advanced technology, trucks with Euro 6 engines command a higher sales price than equivalent Euro
5 vehicles.
Order bookings in Latin America remained at a good level, in line with the third quarter of 2013. Compared
to the fourth quarter of 2012, order bookings in Latin America decreased sharply by 42 percent to 4,226
(7,308) trucks. During the fourth quarter of 2012, extensive subsidies were available for investments in new
vehicles, which resulted in exceptionally high order bookings in Brazil. The fourth quarter of 2013 was
partly dominated by uncertainty regarding the terms of subsidised financing but in late December, the
Brazilian government announced that subsidised financing would continue in 2014. Subsidised financing
will also continue to be available in Argentina.
In Eurasia, order bookings decreased due to a weakening demand in Russia. Order bookings totalled
1,058 (1,323) trucks in Eurasia. In Asia, order bookings improved to 2,174 (1,335) units compared to the
fourth quarter of 2012, which was mainly due to a sharp rise in the Middle East from a low level. Compared
to the third quarter of 2013, order bookings increased in Hong Kong while they weakened in Israel.
In Africa, order bookings decreased somewhat in South Africa compared to the third quarter of 2013, while
they were stable compared to the fourth quarter of 2012. In Oceania, order bookings increased in Australia.
Total order bookings in the Africa and Oceania region were 22 percent higher at 907 (741) units, compared
to the fourth quarter of 2012. Compared to the third quarter of 2013, order bookings were stable.
Deliveries
Scania's total truck deliveries increased by 21 percent to 73,611 (61,051) units during the full year
compared to 2012, the highest level in Scania’s history. During the fourth quarter, deliveries increased by
18 percent to a record high 22,249 (18,819) trucks. In Europe, deliveries rose by 38 percent to 11,549
(8,396) units compared to the fourth quarter of 2012, supported by Euro 5 vehicles that were ordered
during the second and third quarters. In Eurasia, deliveries fell by 28 percent to 1,704 (2,368) trucks.
In Latin America, deliveries rose by 12 percent to 6,115 (5,472) units compared to the fourth quarter of
2012, driven by Brazil. In Asia, deliveries increased by 9 percent compared to the fourth quarter of 2012 to
1,908 (1,750) trucks.
Sales
Net sales of trucks rose by 16 percent to SEK 57,502 m. (49,580) during the full year. During the fourth
quarter, sales rose by 17 percent to SEK 17,423 m. (14,872).
The total European market for heavy trucks
The total market for heavy trucks in 26 of the European Union member countries (all EU countries except
Bulgaria and Malta) plus Norway and Switzerland increased by 8 percent to about 238,200 units during the
full year 2013. Scania truck registrations amounted to some 33,100 units, equivalent to a market share of
about 13.9 (13.2) percent.
3
4. Scania Year-end Report January-December 2013
Scania trucks
Order bookings
Deliveries
12 months
Europe
Eurasia
12 months
Change,
12 months
12 months
2013
2012
%
2013
2012
Change,
%
35,179
28,695
23
32,625
27,720
18
6,107
6,801
-10
6,260
6,798
-8
19,899
18,833
6
23,756
15,391
54
Asia
8,731
8,362
4
7,400
8,089
-9
Africa and Oceania
3,762
3,194
18
3,570
3,053
17
73,678
65,885
12
73,611
61,051
21
America*
Total
*Refers to Latin America
The bus and coach market
Order bookings
Order bookings for buses and coaches improved during the full year 2013 and Scania received major
orders in Russia, Malaysia and Taiwan during the first half of the year.
Scania’s total order bookings for buses and coaches increased by 20 percent to 7,257 (6,060) units during
the full year 2013 compared to 2012. During the fourth quarter, order bookings increased by 4 percent to
1,502 (1,448) units compared to the corresponding period of 2012. In Europe, order bookings amounted to
468 units (348).
Compared to the fourth quarter of 2012, order bookings fell by 25 percent in Latin America. The downturn
was primarily related to Brazil and Mexico.
In Asia, order bookings decreased to 266 (297) buses and coaches compared to the fourth quarter of
2012, mainly attributable to Taiwan and Israel but moderated somewhat by an increase in India. Order
bookings in Africa and Oceania rose by 114 percent and the upturn was mainly attributable to Australia.
Deliveries
Scania’s bus and coach deliveries totalled 6,853 (6,350) units during the full year 2013. In the fourth
quarter, deliveries rose by 17 percent to 1,991 (1,703) units compared to the corresponding period of 2012.
In Europe, deliveries increased by 4 percent compared to the fourth quarter of 2012. In Latin America,
deliveries were down by 13 percent. In Asia, deliveries increased by 73 percent, while deliveries of buses
and coaches in Africa and Oceania rose by 16 percent during the fourth quarter.
Net sales
Net sales of buses and coaches fell by 8 percent to SEK 6,610 m. (7,196) during the full year 2013. During
the fourth quarter, sales increased by 16 percent to SEK 2,064 m. (1,775).
Scania buses and coaches
Order bookings
Deliveries
12 months
12 months
Change,
12 months
12 months
2013
2012
%
2013
2012
%
Europe
1,252
1,032
21
1,000
1,312
-24
Eurasia
825
178
-
850
198
-
America*
2,604
3,016
-14
2,778
2,738
1
Asia
1,638
1,250
31
1,388
1,304
6
938
584
61
837
798
5
7,257
6,060
20
6,853
6,350
8
Africa and Oceania
Total
Change,
*Refers to Latin America
Engines
Order bookings
Total engine order bookings rose by 10 percent to 7,246 (6,594) units during the full year 2013. Compared
to the fourth quarter of 2012, order bookings were 27 percent higher at 1,775 (1,402) units. Order bookings
were supported by customers that invested before year-end, when new emission standards (Stage IV/Tier4
Final) entered into effect.
4
5. Scania Year-end Report January-December 2013
Deliveries
Engine deliveries fell by 4 percent to 6,783 (7,063) units during the full year. Fourth quarter deliveries rose
by 34 percent to 2,148 (1,602) engines. The upturn was mainly attributable to Great Britain and South
Korea.
Net sales
During 2013, sales decreased to SEK 1,140 m. (1,245). During the fourth quarter, sales rose by 24 percent
to SEK 368 m. (296).
Services
Record high volume and negative currency rate effects
Service revenue amounted to SEK 17,510 m. (17,092) during the full year 2013. Currency rate effects had
a negative impact, while more workshop hours and parts together with somewhat higher prices had a
positive impact. In local currencies, revenue increased by 6 percent.
In Europe, service revenue rose slightly to SEK 11,802 m. (11,601) compared to the full year 2012. In Latin
America, revenue rose by 4 percent to SEK 2,584 m. (2,474) and revenue in Asia was 5 percent higher
than the year-earlier period at SEK 1,317 m. (1,251). In Africa and Oceania, service revenue decreased by
3 percent to SEK 1,134 m. (1,168), while in Eurasia it increased by 13 percent to SEK 673 m. (598)
compared to the full year 2012.
During the fourth quarter, service revenue increased by 4 percent to SEK 4,522 m. (4,332). In local
currencies, revenue rose by 6 percent, with higher volume of workshop hours and parts.
Earnings
Vehicles and Services
Full year 2013
Operating income in Vehicles and Services totalled SEK 7,736 m. (7,694) during the full year 2013. Higher
vehicle deliveries and higher service volume had a positive effect. The high capacity utilisation had a
positive impact but additional costs had a negative effect, since the production level was close to capacity
in the fourth quarter. There were also several adjustments of the daily production rate during 2013, which
affected production costs negatively.
Negative currency rate effects, as well as a competitive pricing environment, adversely impacted margins.
Furthermore, Scania has been paying a so-called utilisation fee per truck sold in Russia, which lowered
earnings. Compared to the full year 2012, the total currency rate effect was negative and amounted to
about SEK 1,735 m.
Scania’s research and development expenditures amounted to SEK 5,854 m. (5,312). After adjusting for
SEK 1,123 m. (860) in capitalised expenditures and SEK 293 m. (229) in depreciation of previously
capitalised expenditures, recognised expenses increased to SEK 5,024 m. (4,681).
The fourth quarter of 2013
Operating income in Vehicles and Services totalled SEK 2,308 m. (1,992) during the fourth quarter of 2013.
Higher vehicle deliveries and higher service volume had a positive effect. The high capacity utilisation had
a positive impact but additional costs had a negative effect, since the production level was close to
capacity in the fourth quarter.
Somewhat higher new truck prices related to the introduction of Streamline had some positive effect.
Compared to the fourth quarter of 2012, the total currency rate effect was negative and amounted to about
SEK 300 m.
Scania’s research and development expenditures amounted to SEK 1,661 m. (1,454). After adjusting for
SEK 351 m. (329) in capitalised expenditures and SEK 84 m. (62) in depreciation of previously capitalised
expenditures, recognised expenses increased to SEK 1,394 m. (1,187).
5
6. Scania Year-end Report January-December 2013
Financial Services
Customer finance portfolio
At the end of 2013, the size of Scania’s customer finance portfolio amounted to SEK 48.9 billion, which
was SEK 3.8 billion higher than the end of 2012. In local currencies, the portfolio increased by SEK 4.2
billion, equivalent to 9 percent.
Penetration rate
The penetration rate was 33 (38) percent during the full year 2013 in those markets where Scania has its
own financing operations. The decrease was mainly due to changes in market mix.
Operating income
Operating income in Financial Services increased to a record high SEK 719 m. (606) during the full year
2013, compared to 2012. A larger portfolio and higher margins had a positive impact on earnings. During
the fourth quarter, operating income amounted to SEK 208 m. (173). Overdue receivables and bad debt
expenses decreased during the quarter.
Scania Group
During the full year 2013, Scania’s operating income amounted to SEK 8,455 m. (8,300). Operating margin
amounted to 9.7 (10.4) percent. Scania’s net financial items totalled SEK -47 m. (-19). Net interest items
amounted to SEK -63 m. (133). Net interest items were adversely affected by a lower interest margin and a
lower average net cash position in Vehicles and Services, compared to one year earlier. Other financial
income and expenses totalled SEK 16 m. (-152). This included SEK 72 m. (-90) in valuation effects related
to financial instruments where hedge accounting was not applied.
The Scania Group’s tax expense amounted to SEK 2,214 m. (1,641), equivalent to 26.3 (19.8) percent of
income before taxes. Net income for the period totalled SEK 6,194 m. (6,640), equivalent to a net margin of
7.1 (8.3) percent. Earnings per share amounted to SEK 7.75 (8.31).
Cash flow
Vehicles and Services
Scania’s cash flow in Vehicles and Services amounted to SEK 3,231 m. (3,025) during the full year 2013.
Tied-up working capital decreased by SEK 102 m., despite a negative impact from redemption of some
SEK 800 m. related to PRI Swedish pension system debt during the first quarter.
Net investments amounted to SEK 5,320 m. (4,455), including SEK 1,123 m. (860) in capitalisation of
development expenses. At the end of 2013, the net cash position in Vehicles and Services amounted to
SEK 8,843 m. compared to a net cash position of SEK 9,361 m. at the end of 2012.
Scania Group
Scania’s cash flow in Financial Services amounted to SEK -3,336 m. (-4,089) during the full year 2013 due
to a growing customer finance portfolio. Together with the dividend to the shareholders and the positive
cash flow in Vehicles and Services, the Group’s net debt increased by about SEK 3.6 billion compared to
the end of 2012.
Parent Company
The assets of the Parent Company, Scania AB, consist of shares in Scania CV AB. Scania CV AB is the
parent company of the Group that comprises all production and sales and service companies as well as
other companies. Income before taxes of Scania AB totalled SEK 7,000 m. (4,000) during the full year
2013.
6
7. Scania Year-end Report January-December 2013
Miscellaneous
Number of employees
At the end of 2013, the number of employees totalled 40,953 compared to 38,597 on the same date in
2012.
Material risks and uncertainty factors
The section entitled “Risks and risk management” in Scania’s Annual Report for 2012 describes Scania’s
strategic, operational, legal and financial risks. Note 2 of the same report provides a detailed account of
key judgements and estimates. Note 30 of the same report describes the financial risks, such as currency
risk and interest rate risk. The risks that have the greatest impact on financial performance and on
reporting for the Group and the Parent Company are summarised as follows:
a) Sales with obligations
About 10 percent of the vehicles Scania sells are delivered with residual value obligations or repurchase
obligations. These are recognised as operating lease contracts, with the consequence that recognition of
revenue and earnings is allocated over the life of the obligation (contract). If there are major changes in the
market value of used vehicles, this increases the risk of future losses when selling returned vehicles. When
a residual value obligation is deemed likely to cause a future loss, a provision is made in cases where the
expected loss exceeds the as-yet-unrecognised profit on the vehicle. At the end of 2013, obligations
related to residual value or repurchases amounted to about SEK 9.9 billion compared to SEK 8.6 billion at
the end of 2012.
b) Credit risks
In its Financial Service operations, Scania has an exposure in the form of contractual future payments.
This exposure is reduced by the collateral Scania has in the form of the right to repossess the underlying
vehicle. In case the market value of the collateral does not cover the exposure to the customer, Scania
runs a credit risk. Reserves for probable losses in Financial Service operations are set aside in the
estimated amounts required.
Accounting principles
Scania applies International Financial Reporting Standards (IFRSs) as adopted by the EU. This Interim
Report for the Scania Group has been prepared in accordance with IAS 34, “Interim Financial Reporting”
and the Annual Accounts Act. New and revised standards and interpretations that are being applied from
from 1 January 2013 include the following:
Amendment to IAS 19, “Employee Benefits” – Scania already applies the method for measurement of
pension liabilities contained in the new proposal, except that the returns on pension assets shall be
measured based on the same discount rate as pension liabilities rather than on the estimated return.
Since the size of plan assets is relatively small, the standard has not had any material effect on the
financial statements, other than in relation to special pay toll tax, which is now included in provisions for
pensions. The amendment means that in the Year-end Report SEK 373 m. is transferred from “Other
provisions” to “Provisions for pensions” on 31 December 2013 (restatement of periods for 2012: SEK 554
m. on 31 Dec 2012; SEK 378 m. on 30 Sep 2012; SEK 380 m. on 30 Jun 2012 and SEK 378 m. on 31 Mar
2012).
IFRS 13, “Fair Value Measurement” – The standard is being introduced to create a uniform definition of fair
value and uniform valuation methods for measurement of fair value. New disclosure requirements are also
being introduced. The change has meant that Scania now also includes a credit risk component upon
valuation of derivatives, which has not had any significant impact on the financial statements.
Amendment to IAS 1, “Presentation of Financial Statements” – implies new disclosure requirements of
components accounted for in other comprehensive income in respect of items that may be reclassified to
net income and those which will not be reclassified to net income.
7
8. Scania Year-end Report January-December 2013
Amendments to IFRS 7 “Financial instruments: Disclosures”. The amendment relates to new disclosure
requirements for offsetting financial assets and liabilities.
Accounting principles and calculation methods are otherwise unchanged from those applied in the Annual
Report for 2012.
The Interim Report for the Parent Company, Scania AB, has been prepared in accordance with the Annual
Accounts Act and recommendation RFR 2, “Accounting for Legal Entities” of the Swedish Financial
Reporting Board.
Dividend
Scania’s Annual General Meeting on 3 May 2013 approved a dividend for 2012 of SEK 4.75 (5.00) per
share for the financial year 2012. A total of SEK 3,800 was transferred to the shareholders.
Proposed dividend and Annual General Meeting
The Board of Directors proposes a dividend of SEK 4.00 (4.75) per share for the financial year 2013, with
12 May 2014 as the record date. This means that a total of SEK 3,200 m. will be transferred to the
shareholders provided that the Annual General Meeting approves the Board’s proposal. Scania’s Annual
General Meeting for the financial year 2013 will be held on 7 May 2014 in the Marcus Wallenberg Hall at
Scania’s Head Office in Södertälje, Sweden.
Södertälje, 29 January 2014
Martin Lundstedt
President and CEO
8
9. Scania Year-end Report January-December 2013
Financial information from Scania
This Year-end Report and calendar
This Year-end Report will be presented at a press and analyst conference held at Moderna Museet in
Stockholm at 11.00 CET on 29 January 2014. A telephone conference will also be held at 14.00 CET.
Information about participation is available on www.scania.com.
Calendar 2014
Week commencing 17 March
Publication of Annual Report 2013 on www.scania.com
25 April
Interim Report, January-March 2014
18 July
Interim Report, January-June 2014
22 October
Interim Report, January-September 2014
Forward-looking statements
This report contains forward-looking statements that reflect management’s current views with respect to
certain future events and potential financial performance. Such forward-looking statements involve risks
and uncertainties that could significantly alter potential results. The statements are based on assumptions,
including assumptions related to general economic and financial conditions in the company's markets and
the level of demand for the company's products.
This report does not imply that the company has undertaken to revise these forward-looking statements,
beyond what is required by the rule book for issuers at the NASDAQ OMX Stockholm, if and when
circumstances arise that will lead to changes compared to the date when these statements were issued.
The Interim Report for the first nine months of 2013 stated the following:
“Order bookings for trucks in Europe continued to improve during the third quarter. Demand has been
supported by customers that are investing in Euro 5 vehicles before year-end, when the transition to Euro 6
will occur. There is also a replacement need. Order bookings in Latin America remained at a good level but
decreased compared to the high level of the previous quarters. Order bookings for buses and coaches fell
related to Latin America and Asia. In Engines, order bookings increased in Europe compared to the second
quarter, driven by investments ahead of the transition to the new emission standard in 2014. Scania has
raised its daily production rate in Europe while increasing flexibility at its production units. There are good
growth opportunities and the expansion of annual technical production capacity towards 120,000 vehicles
is continuing. To strengthen competitiveness, the level of activity related to development projects remains
high, at the same time as Scania is expanding its sales and service capacity in emerging markets.”
Contact persons
Per Hillström
Investor Relations
Tel. +46 8 553 502 26
Mobile tel. +46 70 648 30 52
Erik Ljungberg
Corporate Relations
Tel. +46 8 553 835 57
Mobile tel. +46 73 988 35 57
The information in this Year-end Report is that which Scania is required to disclose under Sweden’s Securities Market
Act and/or the Financial Instruments Trading Act. It was released for publication at 09.30 CET on 29 January 2014.
9
10. Consolidated income statements
Full year
Q4
EUR m.*
2013
2012
Change
in %
2013
2012
9,711
-7,302
2,409
86,847
-65,303
21,544
79,603
-58,927
20,676
9
11
4
24,983
-18,865
6,118
22,342
-17,026
5,316
-562
-865
-119
-5,024
-7,740
-1,065
-4,681
-7,286
-1,042
7
6
2
-1,394
-2,137
-287
-1,187
-1,923
-225
2
865
21
7,736
27
7,694
-22
1
8
2,308
11
1,992
503
-327
176
12
188
4,494
-2,920
1,574
111
1,685
4,576
-3,095
1,481
65
1,546
-2
-6
6
71
9
1,174
-755
419
36
455
1,124
-735
389
33
422
-77
-31
80
945
-686
-280
719
8,455
-650
-290
606
8,300
6
-3
19
2
-180
-67
208
2,516
-170
-79
173
2,165
-7
2
-63
16
133
-152
-21
-12
-27
-13
-5
940
-247
-47
8,408
-2,214
-19
8,281
-1,641
2
35
-33
2,483
-522
-40
2,125
-235
693
6,194
6,640
-7
1,961
1,890
-101
-907
-1,178
73
88
0
0
-101
0
-3
-910
2
3
-17
-1,190
1
13
87
0
13
101
Other comprehensive income for the period
Total comprehensive income for the period
90
-20
70
-31
662
803
-179
624
-286
5,908
-1,243
216
-1,027
-2,217
4,423
-171
35
-136
-49
1,912
-910
104
-806
-705
1,185
Net income attributable to:
Scania shareholders
Non-controlling interest
694
-1
6,201
-7
6,646
-6
1,963
-2
1,893
-3
Total comprehensive income attributable to:
Scania shareholders
Non-controlling interest
662
0
5,913
-5
4,431
-8
1,913
-1
1,185
-8
-328
-2,929
-2,698
-797
-697
7.75
17.5
9.7
8.31
19.2
10.4
2.45
2.37
10.1
9.7
Amounts in SEK m. unless otherwise stated
Vehicles and Services
Net sales
Cost of goods sold
Gross income
Research and development expenses
Selling expenses
Administrative expenses
Share of income from associated
companies and joint ventures
Operating income, Vehicles and Services
Financial Services
Interest and lease income
Interest and depreciation expenses
Interest surplus
Other income and expenses
Gross income
Selling and administrative expenses
Bad debt expenses, realised and anticipated
Operating income, Financial Services
Operating income
Interest income and expenses
Other financial income and expenses
Total financial items
Income before taxes
Taxes
Net income for the period
Other comprehensive income
Items that may be reclassified subsequently to
net income
Translation differences
Cash flow hedges
change in value for the year
reclassification to operating income
Taxes
Items that will not be reclassified to net income
Re-measurement of defined benefit plans 3
Taxes
Operating income includes depreciation of
Earnings per share, SEK (no dilution)
Return on equity, percent 1, 2
Operating margin, percent
1
1
Attributable to Scania shareholders' portion of net income.
2
Calculations are based on rolling 12-month income.
3
The discount rate in calculating the Swedish pension liability has changed to 4.0 percent as of 31 December.
* Translated solely for the convenience of the reader at a closing exchange rate of SEK 8.9430 = EUR 1.00.
10
11. Net sales and deliveries, Vehicles and Services
Full year
Amounts in SEK m. unless otherwise stated
Q4
EUR m.
2013
2012
Change
in %
2013
2012
6,431
739
127
1,958
549
259
10,063
-352
9,711
57,502
6,610
1,140
17,510
4,912
2,319
89,993
-3,146
86,847
49,580
7,196
1,245
17,092
4,492
1,892
81,497
-1,894
79,603
16
-8
-8
2
9
23
10
66
9
17,423
2,064
368
4,522
1,294
735
26,406
-1,423
24,983
14,872
1,775
296
4,332
1,192
614
23,081
-739
22,342
4,879
677
2,633
868
654
9,711
43,631
6,052
23,551
7,760
5,853
86,847
41,714
5,972
18,391
7,843
5,683
79,603
5
1
28
-1
3
9
13,501
1,689
6,037
2,110
1,646
24,983
11,260
1,965
5,841
1,766
1,510
22,342
73,611
6,853
6,783
61,051
6,350
7,063
21
8
-4
22,249
1,991
2,148
18,819
1,703
1,602
Net sales
Trucks
Buses *
Engines
Service-related products
Used vehicles
Miscellaneous
Delivery sales value
Revenue deferrals 1
Net sales
Net sales 2
Europe
Eurasia
America **
Asia
Africa and Oceania
Net sales
Total delivery volume, units
Trucks
Buses*
Engines
1
Refers to the difference between sales value based on deliveries and revenue recognised as income.
2
Revenues from external customers by location of customers.
* Including body-built buses and coaches.
** Refers mainly to Latin America
11
12. Quarterly data, earnings
2013
2012
EUR m.
Q4
Q3
Q2
Q1
Q4
Q3
Q2
Q1
2,793
-2,109
684
24,983
-18,865
6,118
19,725
-14,720
5,005
22,798
-17,287
5,511
19,341
-14,431
4,910
22,342
-17,026
5,316
17,923
-13,213
4,710
19,211
-14,012
5,199
20,127
-14,676
5,451
-156
-239
-32
-1,394
-2,137
-287
-1,168
-1,841
-241
-1,355
-2,004
-269
-1,107
-1,758
-268
-1,187
-1,923
-225
-958
-1,736
-254
-1,313
-1,897
-250
-1,223
-1,730
-313
1
258
8
2,308
4
1,759
8
1,891
1
1,778
11
1,992
-4
1,758
13
1,752
7
2,192
Interest and lease income
Interest and depreciation expenses
Interest surplus
Other income and expenses
Gross income
131
-84
47
4
51
1,174
-755
419
36
455
1,118
-724
394
43
437
1,106
-719
387
7
394
1,096
-722
374
25
399
1,124
-735
389
33
422
1,118
-760
358
5
363
1,180
-805
375
14
389
1,154
-795
359
13
372
Selling and administrative expenses
Bad debt expenses
Operating income, Financial Services
-20
-8
23
-180
-67
208
-164
-64
209
-173
-74
147
-169
-75
155
-170
-79
173
-153
-90
120
-165
-42
182
-162
-79
131
Operating income
Interest income and expenses
Other financial income and expenses
Total financial items
Income before taxes
Taxes
Net income for the period
281
-2
-1
-3
278
-59
219
2,516
-21
-12
-33
2,483
-522
1,961
1,968
-7
50
43
2,011
-549
1,462
2,038
-27
-15
-42
1,996
-623
1,373
1,933
-8
-7
-15
1,918
-520
1,398
2,165
-27
-13
-40
2,125
-235
1,890
1,878
33
-30
3
1,881
-380
1,501
1,934
37
-91
-54
1,880
-425
1,455
2,323
90
-18
72
2,395
-601
1,794
2.45
10.1
1.83
10.0
1.72
8.9
1.75
10.0
2.37
9.7
1.88
10.5
1.82
10.1
2.24
11.5
Amounts in SEK m. unless otherwise stated
Vehicles and Services
Net sales
Cost of goods sold
Gross income
Research and development expenses
Selling expenses
Administrative expenses
Share of income in associated companies and joint
ventures
Operating income, Vehicles and Services
Financial Services
Earnings per share, SEK *
Operating margin, in percent
* Attributable to Scania shareholders' portion of net income
12
13. Consolidated balance sheets by business segment
Amounts in SEK m.
unless otherwise stated
2013
EUR m.
31 Dec
30 Sep
2012
30 Jun
31 Mar
31 Dec
30 Sep
30 Jun
31 Mar
Vehicles and Services
Assets
Non-current assets
Intangible assets
Tangible assets
Lease assets
Shares and participations
Interest-bearing receivables
Other receivables 1, 2
451
2,419
746
55
1
314
4,033
21,638
6,669
490
5
2,808
3,738
21,259
6,178
477
2
2,607
3,529
21,099
6,132
492
0
2,571
3,332
20,616
5,780
487
0
2,757
3,138
20,594
5,992
491
8
2,565
2,830
20,083
5,447
481
65
2,590
2,688
20,190
5,528
514
154
2,547
2,597
20,248
5,162
481
207
2,469
Current assets
Inventories
Interest-bearing receivables
Other receivables 3
Current investments
Cash and cash equivalents
Total assets
1,627
11
1,146
5
1,001
7,776
14,552
96
10,243
47
8,957
69,538
15,305
86
10,186
59
9,330
69,227
15,246
95
10,679
46
11,053
70,942
15,246
102
10,134
47
12,586
71,087
14,235
93
9,684
129
11,561
68,490
14,974
178
9,341
143
9,347
65,479
15,283
159
9,127
454
7,636
64,280
14,447
173
8,960
142
14,578
69,464
3,555
6
3,561
31,792
57
31,849
30,120
58
30,178
28,631
60
28,691
31,129
61
31,190
30,133
62
30,195
29,152
63
29,215
28,479
70
28,549
31,502
1
31,503
57
513
2,846
5,076
3,479
2,477
1,148
242
2,688
643
307
608
5,748
2,745
5,436
5,425
2,465
4,741
6,394
2,513
4,505
6,315
2,555
4,324
7,102
2,584
4,635
6,305
2,547
4,858
5,978
2,771
4,900
5,945
2,793
4,416
204
2,396
7,776
1,825
21,422
69,538
1,806
21,766
69,227
1,866
21,897
70,942
1,808
21,416
71,087
1,643
19,854
68,490
1,594
19,812
65,479
1,607
20,233
64,280
1,630
20,489
69,464
61
542
633
563
802
670
705
773
619
38
345
255
319
318
340
579
130
223
25
228
249
280
344
518
590
371
471
34
307
212
222
376
344
463
381
364
-989
-8,843
-6,970
-6,403
-9,554
-9,361
-8,573
-7,999
-12,039
Equity and liabilities
Equity
Scania shareholders
Non-controlling interest
Total equity
Interest-bearing liabilities
Non-current liabilities
Provisions for pensions
Other provisions
Other liabilities 1, 4
Current liabilities
Provisions
Other liabilities 5
Total equity and liabilities
1
Including deferred tax
2
Including derivatives with positive value
for hedging of borrowings
3
Including derivatives with positive value
for hedging of borrowings
4
Including derivatives with negative value
for hedging of borrowings
5
Including derivatives with negative value
for hedging of borrowings
Net cash (-) / Net debt (+) excl.
provisions for pensions, incl.
derivatives as above
13
15. Consolidated balance sheets by business segment
Amounts in SEK m.
unless otherwise stated
2013
EUR m.
31 Dec
30 Sep
2012
30 Jun
31 Mar
31 Dec
30 Sept
30 Jun
31 Mar
Eliminations
Assets
Lease assets
Other current receivables
Current investments
Total assets
-175
-66
0
-241
-1,564
-587
0
-2,151
-1,422
-461
0
-1,883
-1,421
-506
0
-1,927
-1,385
-552
0
-1,937
-1,466
-605
0
-2,071
-1,441
-622
0
-2,063
-1,521
-500
-299
-2,320
-1,572
-473
0
-2,045
Equity and liabilities
Interest-bearing liabilities
Other current liabilities
Total equity and liabilities
0
-241
-241
0
-2,151
-2,151
0
-1,883
-1,883
0
-1,927
-1,927
0
-1,937
-1,937
0
-2,071
-2,071
0
-2,063
-2,063
-299
-2,021
-2,320
0
-2,045
-2,045
452
2,424
1,634
55
2,693
4,046
21,678
14,610
490
24,082
3,749
21,299
13,160
477
22,830
3,539
21,134
12,906
492
23,068
3,342
20,649
12,144
487
22,239
3,150
20,628
12,661
491
22,996
2,842
20,115
11,855
481
22,099
2,702
20,221
12,216
514
21,655
2,612
20,281
11,751
481
21,532
344
3,079
2,869
2,819
2,972
2,801
2,818
2,751
2,680
1,627
1,720
14,552
15,377
15,305
14,765
15,246
14,692
15,246
14,102
14,235
14,007
14,974
13,067
15,283
13,526
14,447
13,424
1,179
5
1,069
13,202
10,542
47
9,562
118,065
10,435
59
9,604
114,552
10,930
46
11,389
116,261
10,306
47
12,910
114,444
10,116
129
11,918
113,132
9,498
143
9,890
107,782
9,572
155
7,955
106,550
9,412
142
14,810
111,572
4,144
6
4,150
37,055
57
37,112
35,142
58
35,200
33,619
60
33,679
35,856
61
35,917
34,942
62
35,004
33,756
63
33,819
33,150
70
33,220
36,102
1
36,103
3,282
647
308
676
29,350
5,788
2,750
6,048
31,867
5,462
2,470
5,330
32,812
6,430
2,518
5,103
30,148
6,349
2,561
4,890
26,146
7,136
2,590
5,240
22,392
6,331
2,552
5,474
20,825
6,004
2,776
5,507
23,219
5,971
2,797
5,024
1,619
206
2,314
13,202
14,483
1,841
20,693
118,065
11,239
1,812
21,172
114,552
12,746
1,871
21,102
116,261
12,079
1,812
20,688
114,444
16,305
1,650
19,061
113,132
16,445
1,598
19,171
107,782
17,094
1,611
19,513
106,550
17,150
1,634
19,674
111,572
61
542
633
563
802
670
705
773
619
38
345
255
319
318
340
579
130
223
25
228
249
280
344
518
590
371
471
Scania Group
Assets
Non-current assets
Intangible assets
Tangible assets
Lease assets
Shares and participations
Interest-bearing receivables
Other receivables 1, 2
Current assets
Inventories
Interest-bearing receivables
Other receivables 3
Current investments
Cash and cash equivalents
Total assets
Total equity and liabilities
Equity
Scania shareholders
Non-controlling interest
Total equity
Non-current liabilities
Interest-bearing liabilities
Provisions for pensions
Other provisions
Other liabilities 1, 4
Current liabilities
Interest-bearing liabilities
Provisions
Other liabilities 5
Total equity and liabilities
1
Including deferred tax
2
Including derivatives with positive
value for hedging of borrowings
3
Including derivatives with positive
value for hedging of borrowings
4
Including derivatives with negative
value for hedging of borrowings
5
Including derivatives with negative
value for hedging of borrowings
34
307
212
222
376
344
463
381
364
Equity/assets ratio, percent
31.4
31.4
30.7
29.0
31.4
30.9
31.4
31.2
32.4
15
16. Statement of changes in equity
Full year
EUR m.
2013
2012
Equity, 1 January
Net income for the period
Other comprehensive income for the period
Dividend
Change in non-controlling interest 1
Total equity at the end of the period
3,914
693
-32
-425
4,150
35,004
6,194
-286
-3,800
37,112
34,512
6,640
-2,217
-4,000
69
35,004
Attributable to:
Scania AB shareholders
Non-controlling interest 1
4,144
6
37,055
57
34,942
62
EUR m.
Full year
2013
2012
9,711
86,847
79,603
503
4,494
4,576
-203
-1,812
-1,728
10,011
89,529
82,451
Operating income, Vehicles and Services
Operating income, Financial Services
865
80
7,736
719
7,694
606
Operating income, Scania Group
945
8,455
8,300
Amounts in SEK m. unless otherwise stated
1
During the second quarter of 2012, 51% of the distributor in
Iraq was acquired.
Information about segments
Amounts in SEK m. unless otherwise stated
Revenue from external customers, Vehicles and
Services
Revenue from external customers, Financial
Services
Elimination related to lease income on operating
leases
Revenue from external customers, Scania
Group
16
17. Cash flow statement
Full year
Amounts in SEK m. unless otherwise stated
2013
2012
EUR m.
2013
2012
Q4
Q3
Q2
Q1
Q4
Q3
Q2
Q1
Operating activities
Income before tax
Items not affecting cash flow
Taxes paid
Cash flow from operating activities
before change in working capital
of which: Vehicles and Services
Financial Services
940
363
-267
8,408
3,236
-2,394
8,281
2,935
-2,496
2,483
1,018
-500
2,011
766
-508
1,996
772
-610
1,918
680
-776
2,125
844
-436
1,881
687
-437
1,880
748
-557
2,395
656
-1,066
1,036
945
91
9,250
8,449
801
8,720
8,038
682
3,001
2,822
179
2,269
2,028
241
2,158
1,982
176
1,822
1,617
205
2,533
2,339
194
2,131
1,942
189
2,071
1,872
199
1,985
1,885
100
Change in working capital etc., Vehicles and Services 1
Cash flow from operating activities
11
1,047
102
9,352
-558
8,162
491
3,492
-63
2,206
88
2,246
-414
1,408
126
2,659
-385
1,746
-923
1,148
624
2,609
-595
-463
-1,058
-5,320
-4,137
-9,457
-4,455
-4,771
-9,226
-1,444
-2,207
-3,651
-1,347
-657
-2,004
-1,330
-1,137
-2,467
-1,199
-136
-1,335
-1,616
-2,363
-3,979
-1,150
-836
-1,986
-943
-834
-1,777
-746
-738
-1,484
361
-372
3,231
-3,336
3,025
-4,089
1,869
-2,028
618
-416
740
-961
4
69
849
-2,169
407
-647
6
-635
1,763
-638
Investing activities
Net investments, Vehicles and Services 1
Net investments in credit portfolio etc., Financial Services
Cash flow from investing activities
Cash flow from Vehicles and Services
Cash flow from Financial Services
Financing activities
Change in debt from financing activities
Ch
i d bt f
fi
i
ti iti
Dividend
Cash flow from financing activities
Cash flow for the year
Cash and cash equivalents at beginning of period
Exchange rate differences in cash and cash equivalents
Cash and cash equivalents at end of period
225
2,016
2 016
5 912
5,912
158
-1,757
1 757
2,698
2 698
917
3,412
3 412
2,349
2 349
-2,031
2 031
2,182
2 182
-425
-200
-3,800
-1,784
-4,000
1,912
158
-1,757
-3,800
-1,102
917
3,412
2,349
-4,000
-6,031
2,182
-211
-1,889
848
-1
-1,555
-1,323
990
2,092
2,109
-6,660
3,307
1,333
-53
1,069
11,918
-467
9,562
11,648
-578
11,918
9,604
-41
9,562
11,389
-230
9,604
12,910
-198
11,389
11,918
2
12,910
9,890
-64
11,918
7,955
-174
9,890
14,810
-195
7,955
11,648
-145
14,810
1
Net investments and change in working capital related to rental of vehicles during the
first quarter of 2012 have been adjusted without impact on total cash flow. The
negative impact on net investments and the positive impact from the change in working
capital were overstated by SEK 247 m. This change was made in the June reporting.
17
18. Fair value of financial instruments
In Scania’s balance sheet, items carried at fair value are mainly derivatives and current investments. Fair value is
established according to various levels, defined in IFRS 13, that reflect the extent to which market values have been
utilised. Current investments and cash and cash equivalents are measured according to Level 1, i.e. quoted prices in
active markets for identical assets, and amounted to SEK 1,002 m. (1,188). Other assets that are carried at fair value
refer to derivatives. These assets are measured according to Level 2, which is based on data other than the quoted
prices that are part of Level 1 and refer to directly or indirectly observable market data, such as discount rate and credit
risk. These items are carried under Other non-current receivables SEK 542 m. (670), Other current receivables SEK 345
m. (361), Other non-current liabilities SEK 228 m. (518) and Other current liabilities SEK 311 m. (346).
For financial instruments that are carried at accrued cost, fair value disclosures are provided in the table below. Fair value
of financial instruments such as trade receivables, trade payables and other non-interest-bearing financial assets and
liabilities that are recognised at accrued cost minus any impairment losses, is regarded as coinciding with the carrying
amount.
For further information about financial instruments, see Note 31 Financial instruments in Scania’s Annual Report for
2013.
Scania Group, SEK m.
31 December 2013
Non-current interest-bearing receivables
Current interest-bearing receivables
Non-interest-bearing trade receivables2
Current investments and Cash and cash equivalents
1
Other non-current receivables
2
Other current receivables
Total assets
Non-current interest-bearing liabilities
Current interest-bearing liabilities
Trade payables4
3
Other non-current liabilities
4
Other current lliabilities
Total liabilities
Total
carrying
amount
24,082
15,377
6,737
9,609
970
356
57,131
29,350
14,483
8,682
228
311
53,054
31 December 2012
Total fair Total carrying
amount
value
24,206
22,996
15,408
14,007
6,737
6,090
9,596
12,047
970
1,119
356
360
57,273
56,619
29,570
26,146
14,524
16,305
8,682
7,671
228
518
311
346
53,315
50,986
Total fair
value
23,146
14,032
6,090
12,041
1,119
360
56,788
26,677
16,321
7,671
518
346
51,533
1
Financial instruments included in the balance sheet under "Other non-current receivables", SEK 3,079 m. (2,801)
Financial instruments included in the balance sheet under "Other current receivables", SEK 10,542 m. (10,116)
3
Financial instruments included in the balance sheet under "Other non-current liabilities", SEK 6,048 m. (5,240)
4
Financial instruments included in the balance sheet under "Other current liabilities", SEK 20,693 m. (19,061)
2
Financial assets and liabilities that have been offset against each other consists of loan receivables and borrowings.
Gross amounts total SEK 1,279 m. (2,369) and SEK 1,118 m. (1,975), respectively. The amount that has been offset
from each amount totals SEK 1,118 m. (1,975).
Financial assets and liabilities that may be offset consist of derivatives covered by legally binding master netting
agreements. The carrying amounts of assets and liabilities total SEK 887 m. (1,010) and SEK 499 m. (861), respectively.
The amount that has not been offset from each amount totals SEK 413 m. (623).
18
19. Number of employees
2013
2012
Production and corporate units
Research and development
Sales and service companies
Vehicles and Services
31 Dec
19,069
3,596
17,549
40,214
30 Sep
19,056
3,580
17,380
40,016
30 Jun
18,732
3,550
17,121
39,403
31 Mar
17,619
3,529
16,840
37,988
31 Dec
17,792
3,509
16,605
37,906
30 Sep
17,776
3,480
16,649
37,905
30 Jun
17,373
3,465
16,294
37,132
31 Mar
17,194
3,427
16,079
36,700
Financial Services
Total number of employees
739
40,953
723
40,739
713
40,116
702
38,690
691
38,597
675
38,580
670
37,802
666
37,366
19
20. Quarterly data, units by geographic area
2013
Full year
2012
Q4
Q3
Q2
Q1
Full year
Q4
Q3
Q2
Q1
Order bookings, trucks
Europe
Eurasia
America **
Asia
Africa and Oceania
Total
35,179
6,107
19,899
8,731
3,762
73,678
5,908
1,058
4,226
2,174
907
14,273
11,267
1,611
4,131
2,540
926
20,475
9,970
1,882
5,757
1,970
1,115
20,694
8,034
1,556
5,785
2,047
814
18,236
28,695
6,801
18,833
8,362
3,194
65,885
7,470
1,323
7,308
1,335
741
18,177
6,136
1,743
5,003
1,629
926
15,437
7,970
2,319
3,730
3,141
876
18,036
7,119
1,416
2,792
2,257
651
14,235
Trucks delivered
Europe
Eurasia
America**
Asia
Africa and Oceania
Total
32,625
6,260
23,756
7,400
3,570
73,611
11,549
1,704
6,115
1,908
973
22,249
6,864
1,610
5,512
1,541
920
16,447
7,758
1,746
6,648
2,262
946
19,360
6,454
1,200
5,481
1,689
731
15,555
27,720
6,798
15,391
8,089
3,053
61,051
8,396
2,368
5,472
1,750
833
18,819
5,835
1,607
3,388
1,460
746
13,036
6,638
1,687
2,801
2,479
742
14,347
6,851
1,136
3,730
2,400
732
14,849
Order bookings, buses*
Europe
Eurasia
America **
1,252
825
2,604
468
45
507
187
227
426
336
192
679
261
361
992
1,032
178
3,016
348
25
677
193
13
788
180
88
939
311
52
612
Asia
Africa and Oceania
Total
1,638
938
7,257
266
216
1,502
268
226
1,334
483
180
1,870
621
316
2,551
1,250
584
6,060
297
101
1,448
306
188
1,488
230
113
1,550
417
182
1,574
1,000
850
2,778
1,388
837
6,853
278
201
749
480
283
1,991
274
322
616
383
202
1,797
289
227
677
319
170
1,682
159
100
736
206
182
1,383
1,312
198
2,738
1,304
798
6,350
267
56
859
277
244
1,703
380
54
874
322
181
1,811
382
49
433
362
221
1,447
283
39
572
343
152
1,389
Buses delivered*
Europe
Eurasia
America **
Asia
Africa and Oceania
Total
* Including body-built buses and coaches.
** Refers to Latin America
20
21. Parent Company Scania AB, financial statements
Full year
EUR m.
2013
2012
787
-5
782
7,041
-41
7,000
4,063
-63
4,000
2013
2012
EUR m.
31 Dec
30 Sep
943
8,435
8,401
1,249
2,192
11,167
19,602
8,001
16,402
Equity
2,192
19,602
16,402
Total shareholders' equity
2,192
19,602
16,402
EUR m.
2013
31 Dec
2012
31 Dec
16,402
16,402
7,000
-3,800
19,602
4,000
-4,000
16,402
Amounts in SEK m. unless otherwise stated
Income statement
Financial income and expenses*
Allocations*
Income taxes
Net income
Balance sheet
Assets
Financial non-current assets
Shares in subsidiaries
Current assets
Due from subsidiaries
Total assets
Equity
Statement of changes in equity
Equity, 1 January
Net income
Total comprehensive income
Dividend
Equity
1,834
0
783
-426
2,191
*Full year 2012 has been adjusted according to RFR 2, regarding
recognition of group contributions
21