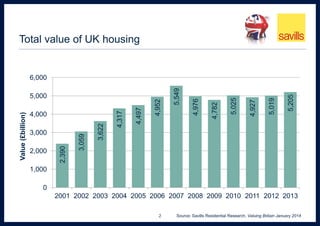
Valuing Britain
Part I
The Value of Housing Across the UK

January 2014

1
Dull but important stuff
 Stock valued in November of each year having regard to:
 changes in the Land Registry Index at a local level;
 changes in the level of housing stock ; and
 shifts in tenure (having regard to recent trends)
 Owner occupied housing valued on a vacant possession basis.
 Private rented housing and social housing valued subject to tenants rights of
occupation.
 All stock valued at a local authority level with base data on the make up of stock
and the nature occupation taken from the 2001 and 2011 census.

2

Source: Savills Residential Research, Valuing Britain January 2014
Total value of UK housing

 The total value of UK housing stock is £5.205
trillion.
 The value of housing stock in the UK increased by
£186 billion in 2013.
 It is still £344 billion below the 2007 level but
higher than at any point since that date.

3

Source: Savills Residential Research, Valuing Britain January 2014
Total value of UK housing

2,000

5,205

5,019

4,927

5,025

4,782

5,549

4,976

4,497

4,317

3,622

3,000

3,059

4,000

2,390

Value (£billion)

5,000

4,952

6,000

1,000
0
2001 2002 2003 2004 2005 2006 2007 2008 2009 2010 2011 2012 2013
4

Source: Savills Residential Research, Valuing Britain January 2014
Value by region

 London and the South East account for
 26% of the housing stock of the UK
 42% of the value of all housing stock in the UK

5

Source: Savills Residential Research, Valuing Britain January 2014
Division by region
Value
£billion
LONDON
SOUTH EAST

Units
thousand

% Value

% Units

1,236

3,438

23.7%

12.3%

950

3,726

18.3%

13.4%

Value £bn
Wales

NE

N Ireland

E Mids
London

EAST

528

2,550

10.1%

9.1%
Y&H

SOUTH WEST

485

2,426

9.3%

8.7%

NORTH WEST

402

3,164

7.7%

11.3%

WEST MIDLANDS

342

2,394

6.6%

8.6%

SCOTLAND

306

2,531

5.9%

9.1%

YORKS & THE HUMBER

298

2,340

5.7%

8.4%

EAST MIDLANDS

276

1,988

5.3%

7.1%

WALES

178

1,392

3.4%

5.0%

NORTH EAST

127

1,186

2.4%

4.3%

NORTHERN IRELAND

76

754

1.5%

2.7%

Scotland

W Mids

SE
NW

SW
East

6

Source: Savills Residential Research, Valuing Britain January 2014
Changes in value
 The value of housing stock in London rose by over £100bn in 2013,
accounting for more than half of the total growth of the value of housing
stock across the UK.
 Every region of the UK except Wales, the North East and North West saw
an increase in the value of its housing stock in 2013.
 Over 5 years the value of housing stock in London has risen by over
£300bn (i.e. a figure equivalent to the current day value of all housing in
Scotland).
 Over that same period, housing in the rest of the south of England has
risen by £131bn.
 Across the remainder of the UK the value of housing is over £200bn
below the level at the end of 2008.
7

Source: Savills Residential Research, Valuing Britain January 2014
Change in value
5 year change in total value

£billion

1 year

5 year

LONDON

105.8

304.5

SOUTH EAST

33.3

79.9

EAST

17.5

32.0

SOUTH WEST

11.8

18.9

WEST MIDLANDS

6.7

- 16.6

NORTHERN IRELAND

4.9

- 33.1

0%

SCOTLAND

4.6

- 22.8

-10%

EAST MIDLANDS

3.8

- 8.6

40%
30%
20%
10%

-20%
YORKS & THE HUMBER

1.8

- 32.5

WALES

- 0.1

- 12.9

NORTH EAST

- 1.6

- 21.9

NORTH WEST

-2.1

- 57.8

-30%
-40%

8

Source: Savills Residential Research, Valuing Britain January 2014
By sector

 Owner occupied housing accounts for 70% of the total value of all
housing in the UK, with a broadly even split between that mortgage free
and subject to a mortgage.
 Housing in the private rented sector now accounts for 19% of value,
within touching distance of £1 trillion.

9

Source: Savills Residential Research, Valuing Britain January 2014
By Sector
Value £ billion
Value
£billion

Owner Occupied
Un-mortgaged

1,783

Units
thousand

8,339

% Value

34%

Social
Rented
Sector
7%

% Units

30%

Owner Occupied
Mortgaged

1,845

8,643

35%

Private Rented
Sector

989

5,109

19%

18%

Social Rented
Sector

337

4,758

6%

17%

Other

250

1,039

5%

Owner
Occupied
Unmortgaged
34%

Private
Rented
Sector
19%

31%

4%

Other
5%

Owner
Occupied
Mortgaged
35%

10

Source: Savills Residential Research, Valuing Britain January 2014
Shifts in value by sector
 The value of housing in the private rented sector rose by more than any
other sector in 2013 (£76 billion).
 Housing in the private rented sector has risen by over £275 billion over
the past five years, whilst the value of owner occupied property subject to
a mortgage has fallen by more than £170 billion.
 Over 10 years private rented housing has gone form accounting for 12%
of the value of UK housing stock to 19%.
 Over the same period owner occupied property subject to a mortgage has
gone from 44% of value to 35% of value.

11

Source: Savills Residential Research, Valuing Britain January 2014
Shift in value by sector
Distribution of Value

Change in Value
Owner Occupied
Un-mortgaged

1 year
£billion

5 year
£billion

+64

Owner Occupied Unmortgaged
Private Rented Sector
Other

+86

100%
90%
80%

Owner Occupied Mortgaged

+20

Owner Occupied Mortgaged
Social Rented Sector

-172

6%

7%

12%

14%

6%
19%

70%
60%

Private Rented Sector

+76

Social Rented Sector

+13

44%

+12

41%

34%

34%

34%

2003

+277

2008

2013

50%

35%

40%
30%

Other

+13

20%

+27

10%
0%

12

Source: Savills Residential Research, Valuing Britain January 2014
The dominance of London
 Together the housing in the 10 most valuable London boroughs stands at
£609 billion.
 That is now 9% more than the combined figures for Scotland, Wales and
Northern Ireland, having risen by £55 billion over the past year (£46 billion
more than the value growth in the three regions).
 The value of housing in Kensington and Chelsea and Westminster stands
at over £200 billion, 15% more than the total value of the housing stock of
Wales.
 Value growth in the borough of Wandsworth of £8bn in 2013 is on a par
with that seen in Kensington and Chelsea.

13

Savills Residential Research, Valuing Britain January 2014
10 most valuable boroughs in London
Change in Value £m

Local Authority

Value £m

% change in Value

1 year

5 year

1 year

5 year

Westminster

103,166

8,957

39,649

9.5%

48.3%

Kensington and Chelsea

100,316

8,089

35,773

8.8%

42.9%

Wandsworth

66,818

8,068

21,660

13.7%

30.1%

Barnet

58,943

4,513

12,165

8.3%

16.4%

Camden

58,081

4,831

20,411

9.1%

41.4%

Richmond upon Thames

46,714

3,381

11,909

7.8%

24.5%

Ealing

45,130

3,706

10,583

8.9%

19.9%

Bromley

44,518

3,273

6,360

7.9%

8.1%

Lambeth

42,829

5,423

14,297

14.5%

31.1%

Hammersmith and Fulham

42,798

5,045

14,294

13.4%

32.5%

55,286

187,101

10.0%

44.3%

Total

609,312

14

Source: Savills Residential Research, Valuing Britain January 2014
Beyond London

 Beyond London the biggest value growth was seen in Aberdeen where
growth of £1.7 billion was £232 million higher than that seen in Elmbridge
(Surrey).
 The 10 local authorities showing the biggest value growth outside of
London in the past 5 years have seen the value of housing rise by £33
billion.
 The 10 most valuable London boroughs saw the value of their housing
stock rise by over five and a half times that figure.

15

Source: Savills Residential Research, Valuing Britain January 2014
Biggest increase in £m beyond London
Local Authority

Value £m

1 year change £m

Local Authority

Value £m

5 year change £m

Aberdeen City

18,347

1,720

Brighton and Hove

31,399

5,040

Elmbridge

32,372

1,488

Elmbridge

32,372

4,460

Aberdeenshire

19,683

1,423

Bristol, City of

35,179

4,107

Bath & NE Somerset

20,198

1,256

Wokingham

21,149

3,003

Bristol, City of

35,179

1,245

Waverley

20,949

2,900

Birmingham

54,103

1,222

Guildford

21,566

2,837

Brighton and Hove

31,399

1,147

Reigate and Banstead

19,293

2,760

St Albans

23,515

961

St Albans

23,515

2,734

Wiltshire

44,138

957

Windsor and Maidenhead

23,463

2,640

Wokingham

21,149

957

Wiltshire

44,138

2,570

12,375

Total

Total

300,082

16

273,023

33,050

Source: Savills Residential Research, Valuing Britain January 2014

The Value of Housing across the UK Part 1

  • 1.
    Valuing Britain Part I TheValue of Housing Across the UK January 2014 1
  • 2.
    Dull but importantstuff  Stock valued in November of each year having regard to:  changes in the Land Registry Index at a local level;  changes in the level of housing stock ; and  shifts in tenure (having regard to recent trends)  Owner occupied housing valued on a vacant possession basis.  Private rented housing and social housing valued subject to tenants rights of occupation.  All stock valued at a local authority level with base data on the make up of stock and the nature occupation taken from the 2001 and 2011 census. 2 Source: Savills Residential Research, Valuing Britain January 2014
  • 3.
    Total value ofUK housing  The total value of UK housing stock is £5.205 trillion.  The value of housing stock in the UK increased by £186 billion in 2013.  It is still £344 billion below the 2007 level but higher than at any point since that date. 3 Source: Savills Residential Research, Valuing Britain January 2014
  • 4.
    Total value ofUK housing 2,000 5,205 5,019 4,927 5,025 4,782 5,549 4,976 4,497 4,317 3,622 3,000 3,059 4,000 2,390 Value (£billion) 5,000 4,952 6,000 1,000 0 2001 2002 2003 2004 2005 2006 2007 2008 2009 2010 2011 2012 2013 4 Source: Savills Residential Research, Valuing Britain January 2014
  • 5.
    Value by region London and the South East account for  26% of the housing stock of the UK  42% of the value of all housing stock in the UK 5 Source: Savills Residential Research, Valuing Britain January 2014
  • 6.
    Division by region Value £billion LONDON SOUTHEAST Units thousand % Value % Units 1,236 3,438 23.7% 12.3% 950 3,726 18.3% 13.4% Value £bn Wales NE N Ireland E Mids London EAST 528 2,550 10.1% 9.1% Y&H SOUTH WEST 485 2,426 9.3% 8.7% NORTH WEST 402 3,164 7.7% 11.3% WEST MIDLANDS 342 2,394 6.6% 8.6% SCOTLAND 306 2,531 5.9% 9.1% YORKS & THE HUMBER 298 2,340 5.7% 8.4% EAST MIDLANDS 276 1,988 5.3% 7.1% WALES 178 1,392 3.4% 5.0% NORTH EAST 127 1,186 2.4% 4.3% NORTHERN IRELAND 76 754 1.5% 2.7% Scotland W Mids SE NW SW East 6 Source: Savills Residential Research, Valuing Britain January 2014
  • 7.
    Changes in value The value of housing stock in London rose by over £100bn in 2013, accounting for more than half of the total growth of the value of housing stock across the UK.  Every region of the UK except Wales, the North East and North West saw an increase in the value of its housing stock in 2013.  Over 5 years the value of housing stock in London has risen by over £300bn (i.e. a figure equivalent to the current day value of all housing in Scotland).  Over that same period, housing in the rest of the south of England has risen by £131bn.  Across the remainder of the UK the value of housing is over £200bn below the level at the end of 2008. 7 Source: Savills Residential Research, Valuing Britain January 2014
  • 8.
    Change in value 5year change in total value £billion 1 year 5 year LONDON 105.8 304.5 SOUTH EAST 33.3 79.9 EAST 17.5 32.0 SOUTH WEST 11.8 18.9 WEST MIDLANDS 6.7 - 16.6 NORTHERN IRELAND 4.9 - 33.1 0% SCOTLAND 4.6 - 22.8 -10% EAST MIDLANDS 3.8 - 8.6 40% 30% 20% 10% -20% YORKS & THE HUMBER 1.8 - 32.5 WALES - 0.1 - 12.9 NORTH EAST - 1.6 - 21.9 NORTH WEST -2.1 - 57.8 -30% -40% 8 Source: Savills Residential Research, Valuing Britain January 2014
  • 9.
    By sector  Owneroccupied housing accounts for 70% of the total value of all housing in the UK, with a broadly even split between that mortgage free and subject to a mortgage.  Housing in the private rented sector now accounts for 19% of value, within touching distance of £1 trillion. 9 Source: Savills Residential Research, Valuing Britain January 2014
  • 10.
    By Sector Value £billion Value £billion Owner Occupied Un-mortgaged 1,783 Units thousand 8,339 % Value 34% Social Rented Sector 7% % Units 30% Owner Occupied Mortgaged 1,845 8,643 35% Private Rented Sector 989 5,109 19% 18% Social Rented Sector 337 4,758 6% 17% Other 250 1,039 5% Owner Occupied Unmortgaged 34% Private Rented Sector 19% 31% 4% Other 5% Owner Occupied Mortgaged 35% 10 Source: Savills Residential Research, Valuing Britain January 2014
  • 11.
    Shifts in valueby sector  The value of housing in the private rented sector rose by more than any other sector in 2013 (£76 billion).  Housing in the private rented sector has risen by over £275 billion over the past five years, whilst the value of owner occupied property subject to a mortgage has fallen by more than £170 billion.  Over 10 years private rented housing has gone form accounting for 12% of the value of UK housing stock to 19%.  Over the same period owner occupied property subject to a mortgage has gone from 44% of value to 35% of value. 11 Source: Savills Residential Research, Valuing Britain January 2014
  • 12.
    Shift in valueby sector Distribution of Value Change in Value Owner Occupied Un-mortgaged 1 year £billion 5 year £billion +64 Owner Occupied Unmortgaged Private Rented Sector Other +86 100% 90% 80% Owner Occupied Mortgaged +20 Owner Occupied Mortgaged Social Rented Sector -172 6% 7% 12% 14% 6% 19% 70% 60% Private Rented Sector +76 Social Rented Sector +13 44% +12 41% 34% 34% 34% 2003 +277 2008 2013 50% 35% 40% 30% Other +13 20% +27 10% 0% 12 Source: Savills Residential Research, Valuing Britain January 2014
  • 13.
    The dominance ofLondon  Together the housing in the 10 most valuable London boroughs stands at £609 billion.  That is now 9% more than the combined figures for Scotland, Wales and Northern Ireland, having risen by £55 billion over the past year (£46 billion more than the value growth in the three regions).  The value of housing in Kensington and Chelsea and Westminster stands at over £200 billion, 15% more than the total value of the housing stock of Wales.  Value growth in the borough of Wandsworth of £8bn in 2013 is on a par with that seen in Kensington and Chelsea. 13 Savills Residential Research, Valuing Britain January 2014
  • 14.
    10 most valuableboroughs in London Change in Value £m Local Authority Value £m % change in Value 1 year 5 year 1 year 5 year Westminster 103,166 8,957 39,649 9.5% 48.3% Kensington and Chelsea 100,316 8,089 35,773 8.8% 42.9% Wandsworth 66,818 8,068 21,660 13.7% 30.1% Barnet 58,943 4,513 12,165 8.3% 16.4% Camden 58,081 4,831 20,411 9.1% 41.4% Richmond upon Thames 46,714 3,381 11,909 7.8% 24.5% Ealing 45,130 3,706 10,583 8.9% 19.9% Bromley 44,518 3,273 6,360 7.9% 8.1% Lambeth 42,829 5,423 14,297 14.5% 31.1% Hammersmith and Fulham 42,798 5,045 14,294 13.4% 32.5% 55,286 187,101 10.0% 44.3% Total 609,312 14 Source: Savills Residential Research, Valuing Britain January 2014
  • 15.
    Beyond London  BeyondLondon the biggest value growth was seen in Aberdeen where growth of £1.7 billion was £232 million higher than that seen in Elmbridge (Surrey).  The 10 local authorities showing the biggest value growth outside of London in the past 5 years have seen the value of housing rise by £33 billion.  The 10 most valuable London boroughs saw the value of their housing stock rise by over five and a half times that figure. 15 Source: Savills Residential Research, Valuing Britain January 2014
  • 16.
    Biggest increase in£m beyond London Local Authority Value £m 1 year change £m Local Authority Value £m 5 year change £m Aberdeen City 18,347 1,720 Brighton and Hove 31,399 5,040 Elmbridge 32,372 1,488 Elmbridge 32,372 4,460 Aberdeenshire 19,683 1,423 Bristol, City of 35,179 4,107 Bath & NE Somerset 20,198 1,256 Wokingham 21,149 3,003 Bristol, City of 35,179 1,245 Waverley 20,949 2,900 Birmingham 54,103 1,222 Guildford 21,566 2,837 Brighton and Hove 31,399 1,147 Reigate and Banstead 19,293 2,760 St Albans 23,515 961 St Albans 23,515 2,734 Wiltshire 44,138 957 Windsor and Maidenhead 23,463 2,640 Wokingham 21,149 957 Wiltshire 44,138 2,570 12,375 Total Total 300,082 16 273,023 33,050 Source: Savills Residential Research, Valuing Britain January 2014