Advantages of the self organizing controller for high-pressure sterilization ...
WFIRM POSTER FINAL VERSION
1. Institute for Regenerative Medicine
Sarthak Patnaik, Prafulla Chandra, Christina Ross, Yuanyuan Zhang, and Benjamin S. Harrison
Wake Forest Institute for Regenerative Medicine, Wake Forest School of Medicine, Winston-Salem, NC 27157
Introduction
With recent advances in technology, researchers have devised methods for the
development and implantation of engineered biomaterials to replace injured tissues
and organs. This has become increasingly important as the supply of tissues and
organs does not come close to meeting the demand worldwide. Through the general
evolution toward microscale patterning, it has become possible to potentially offset this
lack of supply through the development of piezoelectric ink jet processing of
biomaterials and cells. This work aims to develop of living cells via small droplets and
layering them within hydrogels in order to develop three-dimensional substitute tissue.
There are several parameters on our bioprinter that we can change to affect the
printing process. As this technology is a very recent development, we still do not know
how to change these parameters to print cells in the most effective manner; this
became the main problem for us to solve.
It is hypothesized that temperature of cell cartridges, along with stirring of cell
suspensions within cartridges affect the general distribution and viability of
cells. Our goal was to determine which specific settings would optimize the
printing process.
Materials & Methods
• All experiments were conducted on a multi-channel bioprinter (custom-made by
Microfab Technologies Inc., Plano, TX).
• Mouse macrophages and 3T3 Fibroblasts were printed using piezoelectric inkjet
dispensing (Figure 1) onto microscope slides in 7 x 10 dot patterns.
• To test for average cell distribution (number of cells printed per drop), the slides
were analyzed using Leica microscopes, and cells in samples of 30 drops per slide
were counted.
• Effective working time for each cell type was determined by obtaining cell viability
within the cartridges at various time points (0 min, 30 min, 60 min, 90 min, 2 hours,
4 hours, and 6 hours) . These procedures were conducted for all parameters
tested, which are listed in Figure 2.
Conclusions
From the optimization of bioprinting parameters using macrophages and
fibroblasts, we can conclude that medium stir speeds resulted in the longest
effective working time with least loss of cell viability, and also increases the
number of drops which printed cells. This same effect is seen with cells containing
cartridges maintained at 30° C temperatures.
References
1. Jan Sumerel, John Lewis, Andy Doraiswamy, Leila F. Deravi, Sarah L. Sewell, Aren E. Gerdon, David W. Wright,
and Roger J. Narayan. “Piezoelectric ink jet processing of materials for medical and biological applications.”
Biotechnology Journal, 2006, 976-987.
2. Kalyani Nair, Milind Gandhi, Saif Khalil, Karen Chang Yan, Michele Marcolongo, Kenneth Barbee, and Wei Sun.
“Characterization of cell viability during bioprinting processes.” Biotechnology Journal, 2009, 1168-1177.
Acknowledgements
We would like to thank Eben Adarkwa and Dr. Salil Desai for their training and
assistance with the printing process. This work was supported in part by
USAMRMC through contract #W81XWH-11-1-0658.
Optimization of Cell Bioprinting Parameters for Tissue Engineering
Figure 1: Diagram illustrating piezoelectric drop-on-demand bioprinting. This process
utilizes a piezoelectric crystal as a transducer, which changes the size of the nozzle opening to
affect droplet shape and diameter. This crystal uses any waveform to expand and constrict the
nozzle opening at constant time intervals. The rate at which it does this is affected by voltage and
wave attributes. The formed droplets are then printed onto the substrate in the specified pattern.
Optimization Experiment
Parameter Type Parameter Settings Tested
Stir Speed No Stirring
Medium Stirring
(500 rpm)
Maximum Stirring
(1000 rpm)
Temperature 23 ° C 30° C 37 ° C
Figure 2: Table listing the two parameters tested: stir speed and cartridge temperature.
Experiments were done with three different settings for each parameter. Note: All slides printed for the
stirring experiment were done so at 24.4° C, the temperature within the bioprinting apparatus..
www.sciencedaily.com
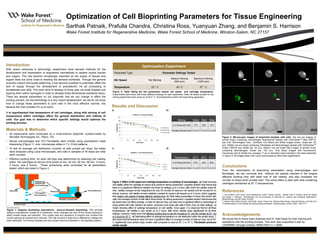
Figure 3: Effect of Stir speed and cartridge temperature on printing of macrophages.. a) Graph showing
cell viability within the cartridge at various time points for stirring experiment. Unpaired student t test shows that
there is no significant difference between the three stir settings up to 2 hours, after which the viability drops off.
Also, viability changes remain insignificant for only 30 minutes at maximum stir speeds and 60 minutes for no
stirring; however, cell viability remains relatively constant at medium stir speeds up to 2 hours, which suggests
that medium stir speeds increase effective working time. b) Table listing percentage of drops that printed with
cells, and average number of cells within those drops, for stirring experiment. Unpaired student t test shows that
stir speed does not affect average number of cells per drop, but does have a significant effect on percentage of
drops printed with cells. Medium stir speed produces more drops with cells in them, than do other settings. c)
Graph showing effect of cartridge temperature on cell viability. Once again, it is observed that for all three
temperatures, cell viability is very similar up to 2 hours, after which viability drops significantly for all three
settings. However, t tests show that effective working time is only 60 minutes at 37° and 90 minutes at 23°, but
is 2 hours for 30° C. d) Table listing effect of cartridge temperature on cell distribution within the printed drops. T
test shows that temperature does not have a significant effect on average number of cells per drop, but at 30°
C, significantly more printed drops contain cells compared to ones at 23° C or 37° C. Fibroblasts produced
similar results.
Figure 4: Microscopic images of bioprinted droplets with cells. Top row are images of
printed drops containing macrophages fluorescently labeled with CellTrackerTM Red CMPTX
dye (Life Technologies Corp., Carlsbad, CA) (Black and White Images shown: Scale bar: 50
μm) Middle row are drops containing Fibroblasts and Macrophages labeled with CellTrackerTM
Green CMFDA dye (Scale bar: 50 μm). Bottom row are bright field images of printed drops
containing Macrophages. (Scale bar: 100 μm). Only drops imaged with fluorescence
microscopy (top & middle row; average 17 μm in diameter) were included in the data presented
in Figure 3. All images taken with Leica microscopes at 200x total magnification.
Results and Discussion
a) b)
c) d)
0
20
40
60
80
100
120
0 60 120 180 240 300 360
Viability(%)
Time (min)
Viability vs. Time (Stir Speed)
No Stirring
Med Stirring
Max Stirring
0
20
40
60
80
100
120
0 60 120 180 240 300 360
Viability(%)
Time (min)
Viability vs. Time (Temperature)
23° C
30° C
37° C
Stirring None Med Max
% of Drops with Cells 27% 58% 37%
Average Cells per Drop 1.2 ± 0.7 1.3 ± 0.7 1.4 ± 0.6
Temperature 23°C 30°C 37°C
% of Drops with Cells 27% 38% 26%
Average Cells per Drop 1.3 ± 0.6 1.5 ± 0.7 1.2 ± 0.4