1. Ground Operations – Performance Analytics Intern, Southwest Airlines
Sai Charan Thotapalli
Graduate Student, MS in Information Technology and Management
ABSTRACT
INTERNSHIP OBJECTIVES
TOOLS USED
In the Spring’15 semester, I worked as an intern for Southwest Airlines Co.
Our company is a major U.S. airline and the world's largest low-cost carrier,
headquartered in Dallas, Texas.
As a part of the Product & Innovation team in the Ground Operations
department, we are always looking for creative solutions to reduce the turn-
times of flights. Turn-time (the time required to unload an airplane after its
arrival at the gate and to prepare it for departure again) have various
attributes/fields that affect it. My duty is to collect/validate the data, analyze
various metrics, identify the key points that affect the performance, and to
report/present the entire analysis.
Travel to various states like Missouri, California to collect the data from the
ramp, and also to train the ramp agents to collect the data for a short period
of time. Objectives after data collection:
• Filter, segregate, validate and load the data into our database
• Identify, explore metrics that affect the turn-time performance
• Analyze data using various analysis/mining methods
• Report the analysis
• Suggest a possible solution to improve the performance
• Host and coordinate cross-functional meetings and/or conference calls
with other operational departments to support opportunity development
and proposal creation
METHODS
For conclusion, I could make the most out of the opportunity to work in
Southwest Airlines. This is a great experience in which I could
contribute as well as learn a lot. Through this internship, I gained
practical IT skills such as data collection/ validation/ analysis/
reporting, as well as job-related skills, such as communication skills
and the way to work in a business/diverse environment.
Additionally, this internship also gave me a great exposure to the
airline industry, which also includes learning of all the new terms used
at work. I could get a clear picture of how analytics is used in order to
achieve excellent operational performance.
CONCLUSION
Databases: SQL Server, MS-SharePoint
Data Collection: UMT handhelds
Data Validation: Stat UMT, MS-Excel, MS-SQL
Analysis: MS-SQL, MS Excel
Reporting: Tableau, MS Excel
Presentation: Tableau (Dashboards), MS-PowerPoint (Slides)
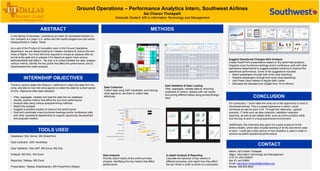
Data Analysis
Plot the Gannt charts of the entire turn-time
process, identifying the key metrics that affect
performance
Data Collection
Collect data using UMT handhelds, and training
ramp agents to use them to collect data
effectively
Data Validation & Data Loading
Filter, segregate, validate data by removing
duplicates & outliers, dealing with null values,
and joining different tables using primary/foreign
keys
In-depth Analysis & Reporting
Calculate the behavior of key metrics in
different scenarios, and report how they affect
the turn times in order to arrive to a conclusion
Suggest Operational Changes After Analysis
Create PowerPoint presentations based on the performed analytics.
Organize cross-functional meetings and/or conference calls with other
operational departments to suggest possible solutions to improve the
operational performance. Some of the suggestions included:
• Board passengers through both ends (dual boarding)
• Deplane passengers through both ends (dual deplaning)
• Use Power Stow instead of regular Belt Loader
• Decrease the allocated turn budget from 1hr to 45mins
Name: Sai Charan Thotapalli
Major: Information Technology and Management
UTD ID: 2021204937
Net ID: sxt135830
Email: saicharan.thotapalli@utdallas.edu
Mobile: 469.605.8630
CONTACT