ECG Guide - Waves, Intervals & Abnormalities
•
12 likes•322 views

The electrocardiogram (ECG) is a graphical presentation of the electrical activity of the heart during each heartbeat. The ECG indicates the rate and rhythm of heartbeats as well as blood flow in heart muscles. The ECG produces distinct waves - P, QRS, and T - which represent atrial and ventricular depolarization and repolarization during each heartbeat. The ECG is recorded using either a pen recorder system or oscilloscope recorder system, which detect the tiny electrical changes on the skin that are produced with each heartbeat. Abnormalities in the size of the ECG waves can help detect various heart conditions.

Recommended
More Related Content
What's hot
What's hot (20)
Similar to ECG Guide - Waves, Intervals & Abnormalities
Similar to ECG Guide - Waves, Intervals & Abnormalities (20)
Recently uploaded
Recently uploaded (20)
ECG Guide - Waves, Intervals & Abnormalities
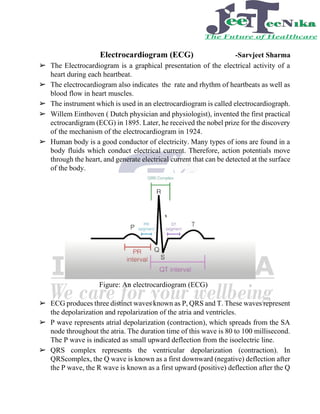
- 1. Electrocardiogram (ECG) -Sarvjeet Sharma ➢ The Electrocardiogram is a graphical presentation of the electrical activity of a heart during each heartbeat. ➢ The electrocardiogram also indicates the rate and rhythm of heartbeats as well as blood flow in heart muscles. ➢ The instrument which is used in an electrocardiogram is called electrocardiograph. ➢ Willem Einthoven ( Dutch physician and physiologist), invented the first practical ectrocardigram (ECG) in 1895. Later, he received the nobel prize for the discovery of the mechanism of the electrocardiogram in 1924. ➢ Human body is a good conductor of electricity. Many types of ions are found in a body fluids which conduct electrical current. Therefore, action potentials move through the heart, and generate electrical current that can be detected at the surface of the body. Figure: An electrocardiogram (ECG) ➢ ECG produces three distinct waves known as P, QRS and T. These waves represent the depolarization and repolarization of the atria and ventricles. ➢ P wave represents atrial depolarization (contraction), which spreads from the SA node throughout the atria. The duration time of this wave is 80 to 100 millisecond. The P wave is indicated as small upward deflection from the isoelectric line. ➢ QRS complex represents the ventricular depolarization (contraction). In QRScomplex, the Q wave is known as a first downward (negative) deflection after the P wave, the R wave is known as a first upward (positive) deflection after the Q
- 2. wave and the S wave is known as a first downward (negative) deflection after the R wave. ➢ T wave represents the ventricular repolarization (relaxation). This wave is wider in shape than QRS complex because the rate of repolarization is more slowly than rate of depolarization. Repolalrization happens in the ventricles at the duration of 0.25 to 0.30 second after ventricles depolarization. ➢ The PR interval consists of P wave and PR segment. The PR segment represents the time taken by AV node to conduct the impulse. The PR interval becomes short at high heart rates (e.g. due to exercise) but becomes large at lower heart rate (e.g. during sleep). ➢ The ST segment is found between QRS & T. This segment represents the time duration between depolarization and repolarization of the ventricles. ➢ QT interval is measured from the beginning of QRS complex to end of T wave. It represents the time gap between activation of electrical activity in the ventricles and their return to resting phase. ➢ Recording of ECG: ➢ There are two main techniques are used to in ECG recording. One is called pen recorder system and another is called oscilloscope recorder system. ➢ (1) Pen Recording System: Specially designed pen is used in this recording system. The pen is made by a thin tube, which is connected to a powerful electromagnetic system. It makes the pen capable to move back and forth at very high speed. The pen records the electrical activity of a heart as ECG paper moves forward. Amplifiers are used to control the movement of the pen during ECG test. ➢ (2) Oscilloscope recorder system: Cathode ray based oscilloscope is used in this recording system. It is made up of cathode ray tube, which consists of an electron gun and a fluorescent surface. ECG analysis: ➢ Abnormalities can be detected by analyzing the size of the ECG waves. ➢ If P wave is found larger than normal, then it indicates enlargement of an atrium. ➢ If Q wave is found larger than normal, then it indicates the myocardial infarction (heart attack). ➢ If R wave is found larger than normal, then it indicates enlargement of ventricles. ➢ If T wave is found flatter than normal, then it indicates that heart muscle is not getting sufficient oxygen.
- 3. ➢ During hyperkalemia (high K+ concentration in blood), the T wave may be found elevated. ➢ Key Points: ➢ Depolarization: When membrane potential of a cell starts to become positive inside and negative outside. During ECG, depolarization indicates that cell is contracting which is known as systolic. ➢ Repolarization: When membrane potential of a cell starts to become negative inside and positive outside. During ECG, repolarization indicates cell is relaxing which is known as Diastolic. ➢ Wave: Upward or downward deflection from the isoelectric line. It represents a specific electrical event. ➢ Interval: It indicates the time between two ECG events. ➢ Segment: The length between two specific point on an ECG. ➢ Complex: The combination of many waves is called complex.