Download as PDF, PPTX


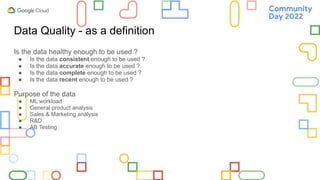


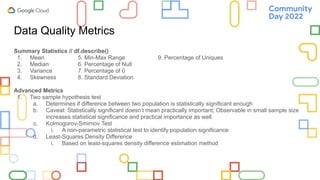
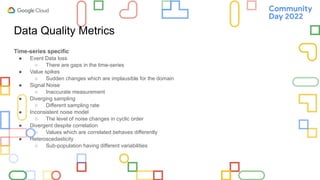

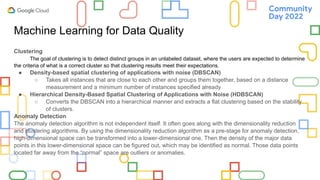


The document details a presentation by Saradindu Sengupta on data quality in machine learning, focusing on various types of data shifts such as covariate shift, label shift, and concept drift. It highlights the importance of assessing data quality through metrics and methodologies, including dimensionality reduction and clustering techniques for anomaly detection. Several statistical methods for evaluating data quality are referenced, along with valuable resources for further reading.


![[系列活動] 資料探勘速遊](https://cdn.slidesharecdn.com/ss_thumbnails/0114ycchendmquicktour-170110050658-thumbnail.jpg?width=640&height=640&fit=bounds)