2. INVESTIGATION OF INTERFACE DIFFUSION ON THE RELIABILITY OF ALGAN/GAN HIGH
ELECTRON MOBILITY TRANSISTOR BY THERMODYNAMIC MODELING
A Thesis
Submitted to the
Faculty of Miami University
in partial fulfillment of
The requirements for the degree of
Master of Science
Department of Chemical and Paper Engineering
by
Russell Ucci
Miami University
Oxford, Ohio
2012
Advisor_____________________
Lei L. Kerr
Advisor_____________________
Shashi B. Lalvani
Advisor_____________________
Doug W. Coffin
3. ii
Table of Contents
1. Introduction ..............................................................................................................................................1
1.1 Semiconductors ..................................................................................................................................1
1.2. AlGaN/GaN Device.............................................................................................................................2
1.2.1 Al-Ga-N material properties.........................................................................................................2
1.2.2 Applications..................................................................................................................................3
1.2.3 Structure of HEMT Device............................................................................................................3
1.2.4 Fabrication ...................................................................................................................................6
2 Background and Significance .....................................................................................................................9
2.1 Issues/Challenges of AlGaN Device.....................................................................................................9
2.2 Background and Literature Review.....................................................................................................9
(1) Evidence for Ni diffusion ..................................................................................................................9
(2) Evidence for device degradation related to Ni diffusion ................................................................11
(3) Evidence for temperature Effect on Ni diffusion and device degradation......................................12
3 Project Approach .....................................................................................................................................16
3.1 Problem Statement...........................................................................................................................16
3.2 Objective...........................................................................................................................................16
3.3 Method .............................................................................................................................................17
4 Results and Discussion.............................................................................................................................24
4.1 GaN Simulation .................................................................................................................................24
4.2 Ni/AlGaN simulation .........................................................................................................................26
5 Conclusions ..............................................................................................................................................30
6. Future Work............................................................................................................................................31
7. References ..............................................................................................................................................33
Appendix: Raw TDB files for Ni/AlGaN database........................................................................................38
4. iii
List of Tables
Table 1-1: Advantages and disadvantages of different deposition methods...............................................8
Table 2-1: Base plate temperature vs. diffusion constants for off-state stress..........................................13
Table 2-2: Temperature vs. point defect density data ...............................................................................13
Table 3-1: Advantages and disadvantages of thermodynamic calculation methods.................................18
Table 4-1: Thermodynamic Parameters of GaN wurtzite phase for calculating GaN phase diagrams and
defect concentrations.................................................................................................................................24
Table 4-2: Thermodynamic parameters used for our simulation of nickel diffusion .................................27
Table 4-3: Summary of the kinetic parameter for modeling wurtzite phase and FCC phase.....................28
6. v
ACKNOWLEDGEMENTS
I would like to express my gratitude to all those who helped me during the writing of this thesis.
My deepest gratitude goes first and foremost to my advisor, Dr. Lei L. Kerr. I appreciate her
invaluable contributions of encouragement, time, and thoughtful discussion to my studies and
research over the past two years. This study could not have been completed without her.
I would like to acknowledge my gratitude to my committee members for my thesis, Dr. Lalvani
and Dr. Coffin, for their valuable insight, advice, and interest.
I am also grateful for and would like to acknowledge the financial support from the Dayton Area
Graduate Studies Institute program and the AFRL facilities, along with AFRL personnel Donald
Dorsey, Chris Bozada, David Look, Eric Heller, Steve Tetlak, and Bruce Claflin for their
incalculable help in performing experiments and stimulating discussion.
I would like to also thank the entire faculty, staff, and all the other graduate students in the
Paper and Chemical Engineering department for their help and support for the last two years.
Lastly, I would like to thank my family for their encouragement and support through my entire
life. I would not have been able to achieve so much without them.
7. 1
1. Introduction
1.1 Semiconductors
AlGaN/GaN heterostructures have been used for some time as good optoelectronic devices,
such as light emitting diodes. The AlGaN/GaN heterostructures have recently become of great
interest as semiconductor materials in high power/temperature transistors because of the need
for high-temperature electronic devices in areas such as high power amplifiers. A general
understanding of semiconductors is essential to the improvement of the reliability and stability
of high power/temperature AlGaN/GaN transistors.
This section will provide a fundamental knowledge base that will allow for a more
comprehensive grasp of the basics of semiconductor operation which will be used to
investigate crack formation in Ni/AlGaN/GaN transistors. All solids have a characteristic energy
band structure. These dissimilarities between band structures allow for the wide range of
electrical characteristics that can be observed in many materials. Semiconductors in particular
have an energy gap which allows for excitation of electrons into the conduction band with
sufficient optical or thermal energy. AlGaN/GaN semiconductors utilize a heterojunction,
where materials of two different band gaps come together and can create a two-dimensional
electron gas, which results in very high mobilities [1]. The bonding model allows for a physical
understanding of how electrons move in the semiconductor.
Donors and acceptors are the impurities introduced to the lattice structure that create electron
and hole mobilities, respectively. The advantage of High Electron Mobility Transistors (HEMTs)
like AlGaN/GaN is that the electrons donated from the AlGaN are moving in the GaN layer and
not in the AlGaN layer, so there is much less distortion of the carriers because the ionized donor
impurities are in the AlGaN and not the GaN and, consequently, higher mobilities can be
achieved. Band bending describes the situation when an electric field is present in a
semiconductor. When an electric field is applied to the device, the energy bands become a
function of position [1]. This concept is very important to transistors, as it can be determined
what kind of junction, rectifying or ohmic, one will achieve. The P-N junction is the staple of
almost all semiconductor devices. The junction occurs between a p-type and an n-type
semiconductor, which can be of the same material or two different materials, such as p-GaN
and n-GaN, or n-AlGaN and p-GaN, respectively. The joining of these two materials creates a
depletion region, so named because of the carrier concentrations are severely depleted [2].
The electrical phenomena of the depletion region are of paramount importance to understand
for all modern semiconductor electronics such as diodes, bi-polar junction transistors, field
effect transistors, and modulation doped field effect transistors. The electrons and holes form
on each side of the junction and migrate to the side with a smaller concentration. When they
8. 2
come into contact, they recombine and are eliminated; ionized donors and acceptors at the
interface are left on their respective sides, creating the depletion region and, hence an electric
field that opposes further charge exchange. This region is controlled by the voltage applied to
the gate of the transistor. Under forward bias (P positive with respect to N), the region is
narrowed and injection of carriers into the conducting channel grows, which increases the
diffusion constituent of the current in the channel. Under reverse bias, the depletion region is
enlarged and the diffusion element in the channel decreases [3]. The Schottky contact is a type
of metal-semiconductor contact that is essentially a P-N junction between a metal and a
semiconductor. These particular contacts are rectifying, meaning they allow for current flow in
only one direction [1].
In HEMTs, the flow is from the source to the drain and is controlled by the gate voltage [1]. This
study focuses on the diffusion of the gate into the underlying area. The ohmic contact is a
metal semiconductor contact that has linear I-V characteristics in both directions of biasing,
allowing for tunneling (the ability to move through the potential barrier). The Fermi levels [1]
become aligned at equilibrium by transporting electrons from the semiconductor to the metal,
which raises the electron energies in the metal and lowers the potential across the junction,
reducing the depletion region, which allows for the aforementioned tunneling with the
application of a small voltage.
1.2. AlGaN/GaN Device
1.2.1 Al-Ga-N material properties
The wide band gap for AlGaN allows for tuning over a relatively large energy range (3.4-6.1eV),
which makes AlGaN a very enticing material to investigate for applications like UV, deep UV
emitters, detectors, and other optoelectronic devices [4]. The large bandgap discontinuity
between AlGaN and GaN allows for more charge to accumulate in the channel and is also aided
by the spontaneous polarization of AlGaN [5]. AlGaN also has a good mobility of 1330 cm2
/Vs
at room temperature [6] for decent aluminum concentrations (xal=.15), compared to AlGaAs
mobilities of 3000-5000 cm2
/Vs (xal=0 - xal=.3) [7]. The sharper discontinuity of AlGaN can make
up for the lower mobility at lower temperatures by being able to utilize much better mobilities
at higher temperatures. Even though AlGaAs has higher maximum mobilities at low fields,
AlGaN can handle much higher electric fields without sacrificing mobility nearly as much as
AlGaAs [8]. One of the advantages of AlGaN versus GaN is its superior mobility at room
temperature as opposed to 300-560 cm2
/Vs [9] for GaN, which allows for more current to flow
in the channel and therefore produces higher power. AlGaN also produces a higher and more
stable Schottky barrier height vs. temperature (~2eV) than GaN (~1.05eV), which is needed for
good rectifying contacts [10].
9. 3
1.2.2 Applications
GaN and AlGaN HEMTs have progressed exponentially from the first preliminary demonstration
in 1993 [11] into an exciting new technological avenue for today’s need for high power, high
temperature devices. Many areas, such as cellular phones, LED’s, and microwave electronics
[12], are looking towards AlGaN as a material for creating high power, high temperature
devices. Some have also looked into using AlGaN optoelectronic devices for space exploration
using them for AC charge management and high energy density physics diagnostics by creating
robust and radiation hard AlGaN devices that would be able to stand the mechanical shocks and
temperature variations during spaceflight [13]. The most pertinent area for AlGaN applications
so far is in systems that require power switching. The larger band gap of AlGaN allows for
thinner layers than AlGaAs and silicon, reducing the chip size by a factor of 10 because the
much higher power density allows for less chips to be fabricated to produce the same power
[12, 14-16]. These, and numerous other possible applications for AlGaN devices, demonstrate
the need to rectify the stability and reliability issues associated with AlGaN to envision its
commercialization.
1.2.3 Structure of HEMT Device
A transistor is a semiconductor device commonly used to intensify or switch electronic signals.
The transistor’s amplifying action is principally due to its capability of transferring its signal
current from a low resistance circuit to a high resistance circuit. All field effect transistors are
majority carrier devices, meaning that current is conducted by the majority carrier species
present in the channel of the FET. HEMTs are field effect transistors which incorporate a
junction between two materials with different band gap energies as the channel for current
flow [17]. Gallium nitride is chosen for this particular device because of its: wide band gap; high
saturation velocity; high breakdown electron field; and high sheet carrier density [18]. The
basic structure of an AlGaN/GaN HEMT is shown below in Fig. 1-1.
10. 4
Fig. 1-1: Schematic of a basic HEMT [19]
The gate is usually a combination of metals such as Ni/Au. The passivation layer is very
important, as it helps keep surface donor sites from reducing the 2DEG although, as Mishra, et
al., mentions, the mechanism for this occurrence is still under debate [12].
The basic Modulation Doped Field Effect Transistor (MODFET) or HEMT structure and the
corresponding band diagram for AlGaN/GaN transistors are shown in Fig. 1-2. Normally, there
will be a substrate, which is typically SiC or sapphire. For the devices in this study, SiC was the
substrate. Additionally, some devices have used a GaN cap layer over the n-AlGaN to prevent
gate leakage. The layers are grown epitaxially on top of the substrate by several methods that
will be addressed in the next section. The device consists of a GaN insulating layer to reduce
lattice mismatching, a nominally undoped GaN layer beneath a n-type AlGaN layer upon which
source and drain ohmic contacts as well as a Schottky gate contact are grown. Illustrating the
band structure is useful to understand the creation of the quantum well for the two-
dimensional electron gas.
11. 5
Fig. 1-2: Depiction of the energy bands in an AlGaN/GaN transistor [2]
The two-dimensional electron gas is an essential part of the MODFFET structure and is formed
in a triangular region underneath the AlGaN layer in the GaN layer. The advantage of creating a
2DEG is the high mobility and density of the charge carriers that can be generated by confining
the electrons to essentially a two-dimensional space shown in Fig. 1-3. The 2DEG is the
essential part of the HEMT structure which allows for the high electron density and mobility,
and therefore, examination of the effect of the diffusion of gate metals, such as Ni for this
study, on the 2DEG properties, is crucial.
12. 6
Fig. 1-3 Energy band diagram of 2DEG at AlGaN/GaN interface [1].
1.2.4 Fabrication
The MODFET, also referred to as the High Electron Mobility Transistor (HEMT) is fabricated in
many different ways, such Molecular Beam Epitaxy (MBE) [20], Pulsed Laser Deposition (PLD)
[18], and Metal Organic Chemical Vapor Deposition (MOCVD) [21,22]. Each process has its
advantages and disadvantages, depending on manufacturing demand, purity, and other factors
for each situation. For research interests, high purity is usually essential and, so, MBE or PLD
would be employed for their ability to create high purity semiconductors. For manufacturing,
the more essential factor is cost and reproducibility on a large scale, which tends to lean
towards MOCVD and similar methods that produce reasonably high quality semiconductors
with a reduction in production costs.
The technique known as MBE utilizes epitaxial growth by means of one or several molecular
beams interacting with a heated substrate surface. In-situ characterization of the growth can
be obtained by devices like the RHEED (Reflection High Energy Electron Diffraction) gun. The
vacuum pump creates the vacuum pressure of approximately 10-8
to 10-11
Torr usually needed
for sufficiently uniform growth. In MBE, extremely pure Al and Ga are heated to their gaseous
forms. The nitrogen is heated to a plasma state and deposited with the Al and Ga on the wafer
epitaxially; they all react with each other, creating a thin film [20].
The technique of pulsed laser deposition (PLD) is very similar to sputtering although, in this
case, there is a laser ablating the target rather than ions. The basic process is to strike a target
material with a laser that is to be deposited on the substrate as a film. Hitting the target causes
13. 7
a plume of the target substance to form perpendicular to the target itself and then is deposited
on the substrate as a thin film. The process is run in an ultra-high vacuum of 10-6
mbar 10-10
mbar [21].
Metal Organic Chemical Vapor Deposition (MOCVD) is a method for growing epitaxial layers for
materials. This is done by reactions on the surface of the material from an organic or
metallorganic compound containing the desired elements, such as aluminum, gallium, or nickel.
The epitaxial development of the layer is achieved by a pyrolysis of the chemicals on the surface
of the material. When the complex organic gas is passed over a hot semiconductor, the
molecules break up from the heat and the desired atoms are deposited on the surface, as seen
in Fig. 1-4. In this current study, GaN is deposited on the wafer, and then a layer of AlGaN is
deposited on top of the GaN layer, and then a nickel contact is deposited onto the AlGaN layer.
The major difference with the MOCVD technique as opposed to MBE is that crystal growth is via
a chemical reaction, not physical deposition, and it does not take place in a vacuum, but at
moderate gas phase pressures [21]. MOCVD is the preferred method for manufacturing
processes as it is more cost effective and faster, despite having less uniformity and less
composition control than MBE.
Fig. 1-4: diagram of an MOCVD process [22]
Figure 1-5 from Anand [21] shows a block diagram for a typical MOCVD reactor. The gas
handling system pertains to the ambient gas inlet system. The MO source deals with the target
14. 8
and lines used to introduce the metallorganic source. The temperature controller maintains
and controls the temperature. The reactor is the chamber where the sample is placed and the
reaction occurs. The exhaust and vacuum is the system to remove the by-products of the
reaction.
Fig. 1-5: Block diagram of MOCVD System [21]
Table 1-1 below compares the advantages and disadvantages of different deposition methods
described earlier.
Method Advantage Disadvantage
MBE [23] Very pure epitaxial growth; clean growth
environment; precise control of beam fluxes
and growth condition; easy use of in situ
diagnostic instruments
Relatively slow growth
rates; very expensive;
suited more to research
MOCVD [24] Composition controllability; high uniformity
over large areas; high throughput
Organic gas byproducts;
carbon contamination; and
hydrogen incorporation
[25]
PLD [26] Multi-component targets, operates under any
ambient gas; normally lower substrate
temperature, reasonable deposition rate; cost
Small area; particulates
Table 1-1: Advantages and disadvantages of different deposition methods
15. 9
2 Background and Significance
2.1 Issues/Challenges of AlGaN Device
A real issue for AlGaN HEMTs is their lack of long term stability under continuous high
temperature operations and, while some researchers have achieved operational stability for a
life of more than 105
h [27], they were restricted to relatively low drain biases, which are not
optimal for high power devices [28]. A concern that must also be addressed is the need to
improve the Schottky contacts to realize a more robust and reliable device. Some current
researchers have used high work function metals inserted into the Ni/Au Schottky contacts to
improve stability but, while they achieved better stability, the gate metals still diffused and
caused reductions in the properties of the device [29]. These challenges concerning device
stability need to be addressed before a commercially viable product can be realized.
2.2 Background and Literature Review
Despite impressive developments in terms of RF performance, there is an increasing challenge
on AlGaN/GaN long term reliability [16]. These obstacles stem from gate metal diffusion.
Kuball found that trap evolution during off-state stress was consistent with impurity diffusion
into the AlGaN layer along dislocations to be a contributing factor to device degradation [30]. It
was also found that, as anticipated, diffusion is a function of temperature and, consequently,
trap evolution, which leads to device degradation, is a function of diffusion [30]. SIMS
experiments performed by Tellez [31] correlated with other reports that metal diffusion is
related to temperature, further solidifying the assumption that was made by Kuball [30] and
Huet [32] that diffusion is temperature driven. The experiments by Huet bolster the
importance of temperature in annealing, and its effect on diffusion, showing that, with a
sufficient increase in temperature, there will be a subsequent increase in diffusion, to the point
of device failure by junction cutoff [32]. These temperature dependent issues with diffusion
must be addressed before reliable manufacturing of AlGaN/GaN HEMTs can be possible.
(1) Evidence for Ni diffusion
Electron-Energy Loss Spectroscopy (EELS) experiments performed by Pearton, et al., [33] on
step-stressed HEMTs clearly show that nickel is diffusing vertically in Fig. 2-1 b and laterally in
Fig. 2-1 c. The diffusion in Fig. (2-1 b) can be compared to the pristine section (2-1 a), where it
can be seen that the nickel gate diffused about 3-4 nm into the AlGaN layer. They concluded
from the EELS in Fig. 2-1 and the TEM image from Fig. 2-2 that nickel and oxygen diffusion were
associated with the threading dislocation and the diffusion would allow for additional gate
leakage current pathways, contributing to device failure during operation.
16. 10
Fig. 2-1: EELS taken vertically at the edge 2-1 (a),
center (b), and laterally across the pit (c) [33]
Fig. 2-2: TEM image of metal diffusion along
a threading dislocation [33]
Tellez, et al., [31] has reported metallic interdiffusion of Au and Ni and subsequent SIMS
analysis revealed diffusion into AlGaN. They conclude that defects arising from the annealing
procedure affect the interface chemistry and diffusion occurs as a result. They also conclude
that metals with high melting points, such as Ni and Ti, are used as diffusion barriers due to
their high melting points and low bulk diffusivities. However, the Ni/Au system has good solid
solution solubility and, therefore, can migrate into the AlGaN, although they did not mention a
possible mechanism for this occurrence. They also mentioned that gallium out-diffused into
the metal ohmic contact, causing point defects to be left in the AlGaN layer. It is stated that the
RTA (rapid thermal annealing) of ohmic contacts at 850°C performed by Tellez, et al., show out-
diffusion of gallium and diffusion of the metals, Au/Ni, into the substrate, although the
relationship of diffusion to device performance was not enumerated. These results coincide
with experiments concerning temperature dependence of diffusion performed by Huet, et al.,
[32].
17. 11
(2) Evidence for device degradation related to Ni diffusion
The significance of the diffusion process in device reliability and degradation is an issue that
cannot be overlooked. As stated by Kuball [30] early stage degradation from diffusion can seed
subsequent degradation mechanisms, such as pits, grooves and crack formation that were
discussed earlier [34, 35]. Material transport, related to the diffusion process, could seed
successive pit formation, as seen in Fig. 2-3 a-c. The diffusion will eventually deteriorate the
device, which would make the device susceptible to cracking. When the device is in the on-
state, Kuball [30] states a further temperature increase will affect the degradation. Strain
driven degradation mechanisms, thermal strain related to the temperature distribution, and
the inverse piezoelectric strain can partially compensate for each other, which would reduce
their effect on the device degradation, and subsequently their contribution to cracking [36].
18. 12
Fig. 2-3: Schematic of possible diffusion related mechanisms of AlGaN HEMTs: a) diffusion along
dislocations, b) diffusion enhanced by inverse piezoelectric strain, c) pit or crack formation
following a prior diffusion process [30].
Experiments performed and theoretical models created by Kuball et. al. [37], indicate early
stage degradation of electrical properties to be consistent with the diffusion of impurities into
the AlGaN layer resulting in electronic trap evolution.
(3) Evidence for temperature Effect on Ni diffusion and device degradation
Diffusion constants were determined as a function of the base plate temperature in Table 2-1
by Kuball to further test their hypothesis of the role of diffusion in early device stage
degradation. The results show that not only are the traps related to diffusion but that diffusion
is related to temperature. Therefore, temperature will affect diffusion which, in turn, will affect
the trap amplitude, and will lead to device degradation. The results in Table 2-1 clearly show
that, as expected, diffusion is a temperature related process, and increases with increasing base
plate temperature. The diffusion constants they obtained from modeling their data were
consistent with constants reported by Pearton, et al., for GaN [38], assuming AlGaN and GaN
coefficients are similar, as there is no consequent data for AlGaN currently.
19. 13
Base Plate Temperature °C Diffusion Constant (cm2
/s)
22 4 x 10-18
50 1 x 10-17
100 3 x 10-17
150 1 x 10-16
Table 2-1: Base plate temperature vs. diffusion constants for off-state stress [30]
There is also an increase in point defect density as a result of a temperature increase, as can be
seen in Table 2-2, which supports Kuball’s conclusion that there is diffusion occurring and it is
affected by temperature [30].
Table 2-2: Temperature vs. point defect density data [37]
Hall measurements and Auger voltage contrast experiments performed by Huet [32] provide
insight into the relationship of temperature to the diffusion of the ohmic metal contact into the
substrate. The surface morphologies of ohmic contacts on GaN at different temperatures from
600°C-900°C can be seen in Fig. 2-5 a-d. It can be seen that at 600°C there is no visible
degradation on the surface and the degradation visibly increases as the temperature increases.
The graph in Fig. 2-6 correlates with the pictures in Fig. 2-5 and shows that the diffusion depth
is relatively unaffected by temperature changes until the temperature passes 700°C. After
700°C there is a very sharp increase in diffusion depth to about 800°C then the depth tapers off
around 850°C-900°C. It can be seen in Fig. 2-6 that even at only 600°C the nickel diffuses about
20. 14
80nm in GaN, which is well beyond the average depth of the AlGaN layer reported for AlGaN
HEMTs, around 25nm [40]. Also, to make interfaces between the metal and the semiconductor
that create good contacts, temperatures of around 800°C are common [41]. So, while good
ohmic contact is achieved, diffusion is most likely also occurring at the same time.
Fig. 2-5: Surface morphologies of Ni/Au
contacts after RTA for 1 min at a) 600°C, b)
700°C, c) 800°C, and d) 900°C (the scale is
identical for all samples). [32]
Fig. 2-6: Diffusion depth of Ni and Au vs.
annealing temperature for Au/Ni/GaN
contacts. [32]
The degradation of the properties of the 2DEG can be examined to provide insight into to the
diffusion of nickel to the AlGaN layer. Huang, et al., [42] ran temperature dependent Hall
measurements, deep-level transient spectroscopic measurements, and C-V measurements to
determine the effect of annealing on the 2DEG properties. They ran these experiments on two
different samples, one with a nickel cap layer between the AlGaN and the Schottky contact and
one without. Figure 2-7 a shows 2DEG mobility and density (inset) vs. temperature plots where
the nickel treated samples showed a slight increase in mobility with decreasing temperature
while the untreated sample showed a dramatic increase in mobility with decreasing
temperature. The plot of the 2DEG density in Fig. 2-7 b (inset) shows that the density does not
fluctuate much with temperature, but the nickel treated sample showed a decreasing trend
with increasing temperature and was, on average, much lower than the untreated one. They
concluded that there was diffusion of nickel along dislocations, which could result in
degradation of the 2DEG mobility. Figure 2-8 b (inset) shows the C-V measurements taken to
obtain the pinch off voltage, which showed a shift from -3.6V for the untreated to -3.8V for the
treated sample, indicating possible acceptor-like deep levels that are created during the
annealing. These traps are undesirable because the energy needed to release the electrons or
21. 15
holes from the trap to the conduction or valence band is more than the characteristic thermal
energy, kT, where k is the Boltzmann constant. These traps compensate the majority carrier,
eradicating free electrons. Figure 2-8 a shows the DLTS signal vs. temperature, where several
traps were identified. The trap that is most informative is the D2 trap that is an acceptor-like
deep level that Huang concluded is induced by the diffusion of nickel during annealing and
results in the degradation of the 2DEG properties.
Fig .2-7: a) Mobility vs. inverse temperature b)
Plot of 2DEG density (inset) [42].
Fig. 2-8: a) Plot of DLTS signal vs.
temperature b) C-V measurements (inset)
[42].
Reliability mathematics, electrochemical models, and device thermography/thermometry have
been conducted by AFRL personnel to characterize device reliability and crack formation. Plots
of median lifetime vs. temperature (°C) were generated by Theimer [43], and revealed a
significant drop in median device lifetime, from 106
hrs. to 10 hrs as temperature increased
from 120°C to 270°C. This indicates significant degradation of the device at higher
temperatures and an unacceptable lifetime of days to hours, which is not feasible past research
use.
23. 17
3.3 Method
In creating simulations to study the device degradation in AlGaN, the first step is to have
reliable thermodynamic data. There are a few different approaches that have been used so far
to accurately predict thermodynamic qualities, including the CALPHAD method and the density
functional theory (DFT) approach, which is a fully theoretical method [44]. The DFT method
does not require any experimental data, as it is based on fundamental physical concepts. While
this method has been known to give accurate comparisons with the CALPHAD method, the
computations with the DFT are sometimes as cumbersome as the CALPHAD method, especially
for high temperatures. Hickel, et al., [44] performed theoretical calculations and compared
them with experimental values and showed that local density approximations (LDA) and
generalized gradient approximations [GGA], (underestimate) [overestimate] the experimental
value of the lattice constant a and (overestimate) [underestimate] the value of the bulk
modulus B. They reported an average error in calculating the lattice constant to be 11.7% and
the bulk modulus to be 13.7%. These quantities are very important in calculating
thermodynamic quantities using the DFT method, and the error shows that a more accurate
method is required to obtain reliable thermodynamic data. A technique called cluster
expansion has also been used to determine thermodynamic properties [45]. The disadvantage
of this method is that construction of the cluster expansion is tedious and relies on the
researcher’s physical intuition to guide the construction of the cluster expansion, whereas the
CALPHAD method is far more intuitive in its model construction. Other theoretical methods,
such as the PHACOMP method have been used to predict detrimental TCP (topological close
packed) phases in Ni-based super alloys, but they require special corrections for other super
alloys [46]. Therefore, because of the complexity and inaccuracy of other methods, as well as
the time consumption for running experiments, the CALPAHD method has been selected for
computing the accurate thermodynamic data necessary to perform degradation analysis of the
Ni-AlGaN/GaN HEMT [47]. Table 3-1 lists the advantages and disadvantages of each method
discussed.
25. 19
The well-known equilibrium condition that the chemical potential, , of each component is
the same in all phases
. (2)
These chemical potentials can be related to the Gibbs energy by the equation
(3)
where xi is the mole fraction of species i and is the chemical potential of species i.
Assignment of thermodynamic functions for each phase allows for the description of the Gibbs
energy of the system. These equations, in conjunction with (2) in numerical calculations can
minimize the Gibbs energy for given conditions. Methods like the two-step method of Hillert
[49], or the one-step method of Lukas, et al., [50] are used to minimize the Gibbs energy. The
equations taken from these methods are normally non-linear and can be solved numerically
using a Newton-Raphson or similar procedure. The CALPHAD method utilizes a multitude of
modeling functions to describe the concentration, temperature, and pressure dependencies of
the Gibbs energy functions of various phases. The Gibbs energy phase contributions from
Kattner and Cambell [47], can be written as:
, (4)
where corresponds to the Gibbs energy from temperature and composition alone;
corresponds to the Gibbs energy from pressure, and is the energy due to magnetic
contribution. The temperature dependence of the Gibbs energy is expressed as a power series
of T, namely,
, (5)
where a-h are coefficients. Very often, only the first two terms of (5) are used for the
representation of the excess Gibbs energy. Though there are terms for pressure and magnetic
energy, they are usually ignored at normal pressures, as was the case in this investigation.
The compound energy model is used to describe the Gibbs energy of the GaN phase, Gm, in the
calculation of the phase diagram [51]; it is given by
, (6)
where are the site fractions of i on the , β, γ and δ sublattices, respectively;
ijkhG0
represents the Gibbs energy of the component compounds; as
denotes the stoichiometric
coefficient of the S sublattice (i.e. , , or ),. Note that s
iy is the same as
iy , the fraction of
31. 25
The Ga-N phase diagram results calculated in this thesis are shown in Fig. 4-1. They have
excellent agreement with results in the literature, as shown in Fig. 4-2 [57].
Fig. 4-1: Calculated Ga-N phase diagram using
the database built.
Fig. 4-2: published Ga-N phase diagram in
literature [57].
The results from our simulation of the nitrogen vacancy concentration are depicted in Fig. 4-3.
They were compared with experimental values in Fig. 4-4 [58]. They are in exceptional
agreement. The carrier concentration was calculated in Fig. 4-5 and compared with previous
experimental data in Fig. 4-6 [59]. The results of the nitrogen vacancy simulation correlated
well with the experimental values in Fig. 4-4 [58]. The simulation for the carrier concentration,
although showing the same trend, yielded the values one order lower than that of the
experimental values in Fig. 4-6 [59]. This is because, in our model, we only included the
nitrogen vacancy defect. In real experiments shown in the literature [59], the carrier
concentration is generated by in conjunction with other defects such as nitrogen on Ga
substitutes, Ga on N substitutes, etc. Our calculation indicates that nitrogen vacancy is the
major defect. This is consistent with the literature finding that nitrogen vacancies is the major
source of defects when n<1x10¹⁷
cm3
and other defects will come to play when n>1x10¹⁷
cm3
[58].
32. 26
Fig. 4-3: Nitrogen vacancy calculated from the
thermodynamic database built in this work.
Fig. 4-4: Nitrogen vacancy measured in literature
[58].
4.2 Ni/AlGaN Simulation
For the Ni-AlGaN system, when assuming Al and N do not have any effect on Ni diffusion, the
*
iG is given as follows:
NiGa
iNiGaNiGa
NiGa
iNiGa
Ni
iNi
Ga
iGai LxxxxLxxGxGxG ,1,0*
)( (16)
where i=Ga or Ni.
The FCC Ni phase for the Ni-AlGaN system is described by the following sublattice model:
FCC: (Ni,Ga)
(Va)
Fig. 4-5: Calculated carrier concentration versus
inverse temperature using the database built.
Fig. 4-6: Published carrier concentration versus
inverse temperature from literature [59].
1.0E+00
1.0E+02
1.0E+04
1.0E+06
1.0E+08
1.0E+10
1.0E+12
1.0E+14
1.0E+16
1.0E+18
0 2.5 5 7.5 10 12.5
n(cm-3)
103/T(K-1)
Carrier Concentration
33. 27
The AlGaN phase for the Ni-AlGaN system is described by the following solution:
Wurtzite: (Ga,Ni)
Table 4-2 summarizes the thermodynamic parameters used in our simulation for Ni FCC and Ga
Wurtzite Phases from phase from Jing-Bo Li [55] and Davydov [56].
Gibbs energy parameters Parameter
FCC
Phase
Ni
FCCG0 -5179.159+117.854*T-22.096*T*LN(T)-.0048407*T**2;
1.72800E+03-27840.655+279.135*T-
43.1*T*LN(T)+1.12754E+31*T**(-9)
Ga
FCCG0 -21312.331+585.263691*T-108.228783*T*LN(T)
+.227155636*T**2-1.18575257E-04*T**3+439954*T**(-1);
3.02920E+02+7055.643+132.73019*T-
26.0692906*T*LN(T)+1.506E-04*T**2-4.0173E-08*T**3-
118332*T**(1)+1.645E+23*T**(-9)-60000
NiGa
FCCG ,0 1000
Wurtzite
Phase
Ga
WurtziteG0 -137111.76+272.38786*T-44.3769*T*LN(T)-
.0063011*T**2+586388*T**(-1)
Ni
WurtziteG0 -5179.159+117.854*T-22.096*T*LN(T)-.0048407*T**2;
1.72800E+03-27840.655+279.135*T-
43.1*T*LN(T)+1.12754E+31*T**(-9)
GaNi
WurtziteG ,0 +134040-100*T
Table 4-2: Thermodynamic parameters used for our simulation of nickel diffusion
34. 28
Table 4-3 summarizes the mobility parameters used in investigating Ni diffusion in AlGaN.
Please note that these parameters need assessment. This initial work is to demonstrate the
feasibility of using thermodynamic modeling as a tool to investigate the device reliability of an
AlGaN device.
Activation enthalpy for mobility equation Parameter
FCC
phase
Ni
NiFCCG ,
0
-287000+ R*T*LN(2.259E-4)
Ga
NiFCCG ,
0
-59345 +R*T*LN(3.477E-5)
NiGa
NiFCCG ,
,
0
650787-247.3*T
Ga
GaFCCG ,
0
-59345+ R*T*LN(3.477E-5)
Ni
GaFCCG ,
0
-287000 +R*T*LN(2.259E-4)
NiGa
GaFCCG ,
,
0
650787-247.3*T
Wurtzite
Phase
Ni
NiWurtziteG ,
0
-287000-69.8*T
Ga
NiWurtziteG ,
0
-59345+R*T*LN(3.477E-5)
NiGa
NiWurtziteG ,
,
0
-428873+217.7*T
Ni
GaWurtziteG ,
0
-247479+R*T*LN(3.477E-5)
Ga
GaWurtziteG ,
0
-59345+R*T*LN(3.477E-5)
GaNi
GaWurtziteG ,
,
0
-428873+217.7*T
Table 4-3: Summary of the kinetic parameter for modeling wurtzite phase and FCC phase from
Jing-Bo Li et al. [55] and Davydov et al. [56].
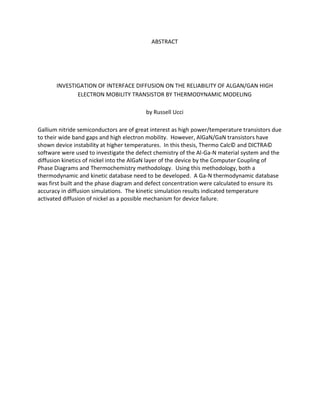
Using the databases in Table 4-3, the Ni concentration profiles in the wurtzite phase at various
temperatures and times are presented in Figure 4-7. The assumption made in this calculation is
that Al and N are immobile atoms and they do not have any interaction or effect on Ni diffusion
in AlGaN phase. The calculation results show that at lower temperatures, less than 500K, Ni
does not diffuse into AlGaN wurtzite phase. Increasing temperature to 600K, Ni starts to show
slight diffusion at the longer diffusion time of 20000s (≈5.5 hrs.). At 800K, Ni exhibits significant
diffusion into AlGaN wurtzite phase. The calculated results can give us an estimate of the
length of diffusion at different diffusion time. For example, if we assume that the diffusion will
occur when Ni concentration is 5 mol %, the diffusion will be 50nm, 70nm, and 110nm after
500s, 1000s and 3000s at 800K, respectively. Of course, for the real situation, Ni will penetrate
much less in AlGaN phase due to the barrier of Al and N atoms.
35. 29
Fig. 4-7: Ni diffusion at various temperatures and time. The assumption made in this calculation
is that Al and N are immobile atoms and they do not have any interaction or effect on Ni
diffusion in AlGaN phase.
0
0.01
0.02
0.03
0.04
0.05
0.06
0.07
0.08
0.09
0.10
MOLE-FRACTIONNI
0 1 2 3 4 5 6 7 8 9 10
10
-7
DISTANCE
DICTRA (2010-11-05:21.40.56) :
TIME = 500,2000,20000
CELL #1
0
0.01
0.02
0.03
0.04
0.05
0.06
0.07
0.08
0.09
0.10
MOLE-FRACTIONNI
0 1 2 3 4 5 6 7 8 9 10
10
-7
DISTANCE
DICTRA (2010-11-05:21.45.30) :
TIME = 500,1000,20000
CELL #1
0
0.02
0.04
0.06
0.08
0.10
0.12
0.14
0.16
0.18
0.20
MOLE-FRACTIONNI
0 1 2 3 4 5 6 7 8 9 10
10
-7
DISTANCE
DICTRA (2010-11-05:21.33.50) :
TIME = 500,1000,3000
CELL #1
T<500K – No diffusion
T=600K – Start to have very
limited diffusion at
time=20000s
T=800K –Significant Ni
Diffusion happens
3000s
1000s
500s
36. 30
Diffusion depth simulations performed using the Ni/Ga database and assuming immobile
nitrogen and aluminum atoms showed a relationship between temperature and diffusion,
which is to expected, as diffusivity depends on temperature. A relationship between run time
and diffusion depth was also found, which is also to be expected, as the longer a device is
operating, the larger pits, etc., will become, enhancing the diffusion depth. There is also an
inverse relationship between the mole fraction of nickel present and the diffusion depth, which
is to be expected.
5 Conclusions
In this study, first a GaN database created by Jing-Bo Li [55] and Davydov [56] was used to
construct a phase diagram and to plot nitrogen and carrier concentrations versus inverse
temperature to confirm the gallium and nitrogen data that would be subsequently used for
diffusion simulations. The produced phase diagram and nitrogen concentration versus inverse
temperature plot showed excellent agreement with literature, while the carrier concentration
plot showed a similar trend, but two to three orders of magnitude lower than literature. Since
this model was a simplified one, the database was assumed to be a reasonable representation
of the thermodynamic values to be used in the diffusion simulations.
Second, a kinetic database from Jing-Bo Li [55] and Davydov [56] was used in conjunction with
the thermodynamic database to perform diffusion simulations for nickel diffusing into gallium,
assuming aluminum and nitrogen were immobile, to demonstrate the viability of using
thermodynamic modeling as a tool to investigate the device reliability of an AlGaN device. For
the first time, a way to comprehensively and quickly calculate the diffusion depth of nickel into
aluminum gallium nitride, assuming aluminum and nitrogen are immobile, at any particular
temperature for various times has been presented. Diffusion depths of 50-100 nm for
temperatures from 500-800K were obtained from simulations for low nickel concentrations.
For higher concentrations, 20-25 nm depths were obtained, which correspond to the depth of
an AlGaN layer grown in literature [40], which would be more than enough to degrade device
operation. The data from the simulations followed the trend expected from literature that
diffusion is temperature sensitive and increases with increasing temperature, so care must be
taken when selecting annealing and operating temperatures to achieve the desired properties
for the device.
37. 31
6. Future Work
Kuball, et al., [37]stressed four devices for 40 hours under different conditions, using UV light-
assisted Idrain trapping analysis as well as trap activation energies to determine relative trap
densities before and after stress. In Fig. 6-1, Kuball demonstrates the trap amplitude follows a
square-root like dependence with time, which is indicative of certain diffusion processes [37].
The square-root dependence of single file diffusion has been modeled by Kärger, et al.,[60] with
mean square displacement, which explains the behavior by the fact that the molecules cannot
bypass each other and, therefore, move in one dimension, for example, along a dislocation.
The experimental and theoretical data for this phenomenon have shown to be in excellent
agreement [60, 61]. Kuball has also noted that the high diffusivities of oxygen in Fig. 6-1 have
been attributed to the migration of impurities along dislocations in the material, and that these
diffusivities are enhanced by about three orders of magnitude along the dislocations as
opposed to the bulk material. It should be mentioned as well that the converse piezoelectric
strain and local gate leakage current may also facilitate the diffusion of impurities into the
dislocations, or, even the bulk material. SIMS and electrical data from Bradley [40] and others
support the conclusion that increased impurity diffusion of oxygen enhanced by the converse
piezoelectric effect creates lattice strain, which subsequently weakens the material. This has
been known to degrade device performance, in some cases, to the point of complete junction
cutoff from an expanding crack. It has been found by Kuball, et al., that there is a linear
dependence on the filling pulse for the electronic trap, which would be consistent with point
defects in a line, indicating a dislocation because the electrons want to follow the least energy
pathway and, therefore, diffusion along the dislocations is a reasonable conclusion [37].
Fig. 6-1: a) Trap amplitude versus stress time; b) diffusivity vs. inverse temperature [37].
40. 34
[17] Sarua, A., Pomeroy, J., Kuball, M., Falk, A., Albright, G., Uren, M. J., Martin, T., Raman-IR
micro-Thermography Tool for Reliability and Failure Analysis of Electronic Devices,
Physical and Failure Analysis of Integrated Circuits, 2008.
[18] Zang, Kenyan, Gallium Nitride based HEMT Devices, Compound Semiconductor
Materials and Devices, May 14, 2003.
[19] http://www.cemca.org/andcollege/andcwebsite/subject05/PHYmag.htm.
[20] Rinaldi, Fernando, Basics of Molecular Beam Epitaxy, Optoelectronics Department,
University of Ulm, Annual Report 2002.
[21] Anand, Manoj, Study of Tin Oxide for hydrogen gas sensor applications, University of
South Florida, 2005
[22] http://www.helmholtz-berlin.de/forschung/enma/materialforschung-
pv/se4/arbeitsgebiete/solarzellenstrukturen/mocvd_en.html
[23] http://www.rci.rutgers.edu/~dbirnie/solarclass/MBEgrowth.pdf
[24] Schumacher, M., Lindner, J., Baumann, P. K., Schienle, F., Solayappan, N., Joshi, V.,
Araujo, C.A., McMillan, L.D., MOCVD for complex multicomponent thin films—a leading
edge technology for next generation devices, Materials Science in Semiconductor
Processing (2003) 85-91.
[25] http://users.ece.gatech.edu/~alan/ECE6450/Lectures/ECE6450L13and14-
CVD%20and%20Epitaxy.pdf
[26] http://ap.polyu.edu.hk/apakhwon/lecture_notes/Thin_Films3.pdf
[27] Singhal, S., Li, T., Chaudhari, A., Hanson, A. W., Therrien, R., Johnson, J. W., Nagy, W.,
Marqurt, J., Rajagopal, P., Roberts, J. C. Piner, E.L., Kizilyalli, I. C., Linthicum, K.J.,
Reliability of large periphery GaN-on-Si HFETs, Microelectronics Reliability, pp. 1247–
1253, 2006
[28] Park, S. Y., Lee, T., Kim, M. J., Transistor Correlation between Physical Defects and
Performance in AlGaN/GaN High Electron Mobility Devices, Transactions on Electrical
and Electronic Materials, Vol. 11, No. 2, pp. 49-53, April 25, 2010.
[29] Miura, N., Nanjo, T., Suita, M., Oishi, T., Abe, Y., Ozeki, T., Ishikawa H., Egawa T., Jimbo,
T., Thermal annealing effects on Ni/Au based Schottky contacts on n-GaN and
AlGaN/GaN with insertion of high work function metal, Solid State Electronics vol. 48,
Issue 5, pp. 689-695, May, 2004.
[30] Kuball, M., Mishra, U.K., Tapajna,M., Simms, R. J. T., Faqir, M., AlGaN/GaN HEMT device
reliability and degradation evolution: Importance of diffusion processes,
Microelectronics Reliability 51 (2001) 195-200.
[31] Tellez, H., Vadillo, J.M., Laserna, J.J., Investigation of Metallic Interdiffusion in AlxGa1-
xN/GaN/Sapphire Heterostructures Used for Microelectronic devices by SEM/EDX and
SIMS depth Profiling, Anal Bioanal Chem 2010, pp. 2865-2871.
42. 36
[44] Neugebauer,J., Hickel,T., Grabowski, B., Ab initio study of the thermodynamic properties
of nonmagnetic elementary fcc metals: Exchange-correlation-related error bars and
chemical trends, PHYSICAL REVIEW B 76, 024309, 2007.
[45] Van de Walle, A., Ceder, G., Automating First-Principles Phase Diagram Calculations,
Journal of Phase Equilibria Vol. 23 No. 4, 2002.
[46] Kattner, U. R., Thermodynamic Modelling of Multicomponent Phase Equilibria, JOM 49,
1997 14-19.
[47] Kattner, U. R., Campbell, C. E., Modelling of Thermodynamics and Diffusion in
Multicomponent systems, Materials Science and Technology 2009 VOL 25 NO 4 459.
[48] Smith, J. M., Van Ness, H. C., Abbot, M. M., Introduction to Chemical Engineering
Thermodynamics, Seventh Edition, McGraw Hill, 2005.
[49] Hillert, M, Physica B, 1981, 103B, 31–40.
[50] Lukas, H. L., Weiss, J., and Henig, E. T., CALPHAD, 1982, 6, 229–251.
[51] Li, Jingbo, Kerr, Lei L. Thermodynamic Modeling of Native Defects in ZnO.
[52] Sabarathinam, Pl., A Simple and Accurate Procedure for Evaluating the Three Constants
of the Redlich-Kister Equation, Ind. Eng. Chem. Res. 1994,33, 752.
[53] Jönsson, B, Andersson, J.-O., Höglund, L., Ägren, J., in: G.R. Prudy (Ed.), Fundamentals
and Applications of Ternary Diffusion, Pergamon Press,New York, 1990, pp. 153.
[54] Andersson, J.-O., Höglund, L., Ägren, J., Computer Simulations of Diffusion in Multiphase
Systems, METALLURGICAL AND MATERIALS TRANSACTIONS A, Volume 25A, June 1994,
1127-1134.
[55] Li, J.B., Tedenac, J.C., Li, C., Zhang, W., Development of Thermodynamic Modeling of
Oxygen-doped GaN Semiconductor, CALPHAD, VOl. 27, No. 1, pp. 1-8, Elsevier Science
Ltd., 2003
[56] Unland, J., Onderka, B., Davydov, A., Schmid-Fetzer, R., Thermodynamics and Phase
Stability in the Ga-N System, Journal of Crystal Growth 256, pp. 33-51, 2003.
[57] Davydov, A. V., Boettinger, W. J., Kattner, U. R., Anderson T. J., Thermodynamic
Assement of the Gallium-Nitrogen System, phys. stat. sol. (a) 188, No. 1, pp.n407–410
(2001).
[58] G. Y. Zhang, Y. Z. Tong, Z. J. Yang, S. X. Jin, J. Li, Z. Z. Gan Relationship of Background
Carrier Concentration and Defects in GaN Grown By Metalorganic Vapor Phase Epitaxy
Appl. Phys. Lett., Vol. 71, No. 23, pp. 3376-3378, December 1997.
[59] Look, D.C., Sizelove, J.R, Keller, S., Wu, Y.F., Mishra, U.K., DenBaars, S.P., Accurate
Mobility and Carrier Concentration Analysis for GaN, Solid State Communications, Vol. 2,
No. $, pp. 297-300, 1997.
[60] Hahn, K., Kärger J., Kukla, V., Single-File Diffusion Observation, Physical Review Letters,
Vol. 76, No. 15, 8 April, 1996.
43. 37
[61] Cory, D. G., Garroway, A. N., Miller, J.B., Line-Narrowing Approaches to Solid State NMR
Imaging, Magn. Reson. Med . 14, 435 (1990). Huff, HR., An electronics division
retrospective 1952–2002 and future opportunities in the twenty-first century, J
Electrochem Soc (2002), vol. 149 pgs. 35–58.
[62] Huff, HR., An electronics division retrospective 1952–2002 and future opportunities in
the twenty-first century, J Electrochem Soc (2002), vol. 149 pgs. 35–58.
[63] Wang A. C. M, Kakihana S. Leakage and hFE Degradation in Microwave Bipolar
Transistors. IEEE Trans Electron Dev Nov. (1974), vol. 21, pp. 667–74.
[64] Christensen, J. S., Radamson. H. H., Kuznetsov, A. Y., Svensson, B.G., Diffusion of
phosphorus in relaxed Si1_xGex films and strained Si/Si1_xGex heterostructures, J Appl
Phys, (2003), vol. 94, pp. 6533–40.
44. 38
Appendix: Raw TDB files for GaN, Ni/Ga, and Ni/AlGaN databases
Table 1: Gibbs energy parameters for GaN database in section 4.1
$ Database file written 31-Aug-2001, modified Feb-2002
$
ELEMENT /- ELECTRON_GAS 0.0000E+00 0.0000E+00 0.0000E+00!
ELEMENT VA VACUUM 0.0000E+00 0.0000E+00 0.0000E+00!
$ ELEMENT EL ELECTRON_GAS 0.0000E+00 0.0000E+00 0.0000E+00!
$ ELEMENT HO HOLE_GAS 0.0000E+00 0.0000E+00 0.0000E+00!
ELEMENT GA ORTHORHOMBIC 6.9723E+01 5.5731E+03 4.0828E+01!
ELEMENT H 1/2_MOLE_H2(G) 1.0079E+00 0.0000E+00 1.5603E+01!
ELEMENT MG HCP_A3 2.4305E+01 4.9980E+03 3.2671E+01!
ELEMENT N 1/2_MOLE_N2(G) 1.4007E+01 4.3350E+03 9.5751E+01!
ELEMENT O 1/2_MOLE_O2(G) 1.5999E+01 0.0000E+00 2.4502E+01!
SPECIES GA1 GA!
SPECIES VA-3 VA1/-3!
$ SPECIES EL1 EL!
$ SPECIES HO1 HO!
SPECIES VA1O1 VA1O1!
SPECIES VA1N1 VA1N1!
SPECIES VA-1 VA1/-1!
SPECIES VA+1 VA1/+1!
SPECIES MG1 MG!
SPECIES MG+1 MG1/+1!
SPECIES MG-1 MG1/-1!
SPECIES MG2 MG2!
SPECIES MG1N1 MG1N1!
SPECIES MG1O1 MG1O1!
SPECIES H1MG1 H1MG1!
SPECIES MG3N2 MG3N2!
SPECIES H+1 H1/+1!
SPECIES O+1 O1/+1!
SPECIES O2 O2!
SPECIES N1 N!
SPECIES N2 N2!
SPECIES N3 N3!
SPECIES N1O1 N1O1!
SPECIES N1O2 N1O2!
SPECIES N1O3 N1O3!
SPECIES N2O1 N2O1!
SPECIES N2O3 N2O3!
SPECIES N2O4 N2O4!
45. 39
SPECIES N2O5 N2O5!
SPECIES GA2O3 GA2O3!
SPECIES GA1O1 GA1O1!
SPECIES GA2 GA2!
SPECIES GA2O1 GA2O1!
SPECIES O3 O3!
SPECIES H1N1 H1N1!
SPECIES H1N3 H1N3!
SPECIES H2 H2!
SPECIES H2N1 H2N1!
SPECIES H2N2_1_1N2H2 H2N2!
SPECIES H2N2_CIS H2N2!
SPECIES H2N2_TRANS H2N2!
SPECIES H3N1 H3N1!
SPECIES H4N2 H4N2!
$$ O-Species from SSUB
FUNCTION F9673T 2.98140E+02 +136904.191-22.9861005*T-30.49045*T*LN(T)
-.0048738965*T**2-2.51268E-07*T**3+57767.3*T**(-1); 8.00000E+02 Y
+137661.642-54.439509*T-25.24208*T*LN(T)-.01210693*T**2
+1.273842E-06*T**3+207293.6*T**(-1); 1.50000E+03 Y
+109485.47+175.498025*T-57.18317*T*LN(T)+.0036644975*T**2
-1.63582983E-07*T**3+4743017*T**(-1); 4.00000E+03 Y
+223765.995-210.956849*T-10.02642*T*LN(T)-.005033325*T**2
+1.38227733E-07*T**3-47630810*T**(-1); 6.00000E+03 N !
FUNCTION F9709T 2.98140E+02 -116546.827+58.7325575*T-50.24181*T*LN(T)
-.006764885*T**2+1.088093E-06*T**3+233385.05*T**(-1); 9.00000E+02 Y
-120662.748+111.155971*T-58.11384*T*LN(T)-1.699258E-05*T**2
+5.77646167E-10*T**3+643465*T**(-1); 6.00000E+03 N !
FUNCTION F12657T 2.98140E+02 +243206.494-20.8612582*T-21.01555*T*LN(T)
+1.2687055E-04*T**2-1.23131283E-08*T**3-42897.09*T**(-1); 2.95000E+03
Y
+252301.423-52.0847281*T-17.21188*T*LN(T)-5.413565E-04*T**2
+7.64520667E-09*T**3-3973170.5*T**(-1); 6.00000E+03 N !
FUNCTION F13287T 2.98140E+02 +130696.944-37.9096643*T-27.58118*T*LN(T)
-.02763076*T**2+4.60539333E-06*T**3+99530.45*T**(-1); 7.00000E+02 Y
+114760.623+176.626737*T-60.10286*T*LN(T)+.00206456*T**2
-5.17486667E-07*T**3+1572175*T**(-1); 1.30000E+03 Y
+49468.3956+710.09482*T-134.3696*T*LN(T)+.039707355*T**2
-4.10457667E-06*T**3+12362250*T**(-1); 2.10000E+03 Y
+866367.075-3566.80563*T+421.2001*T*LN(T)-.1284109*T**2
+5.44768833E-06*T**3-2.1304835E+08*T**(-1); 2.80000E+03 Y
+409416.383-1950.70834*T+223.4437*T*LN(T)-.0922361*T**2
+4.306855E-06*T**3-21589870*T**(-1); 3.50000E+03 Y
46. 40
-1866338.6+6101.13383*T-764.8435*T*LN(T)+.09852775*T**2
-2.59784667E-06*T**3+9.610855E+08*T**(-1); 4.90000E+03 Y
+97590.043+890.798361*T-149.9608*T*LN(T)+.01283575*T**2
-3.555105E-07*T**3-2.1699975E+08*T**(-1); 6.00000E+03 N !
FUNCTION F9878T 2.98150E+02 +211801.621+24.4989821*T-20.78611*T*LN(T);
6.00000E+03 N !
FUNCTION F10011T 2.98140E+02 +349844.617+14.1020535*T-29.25363*T*LN(T)
+.0011332935*T**2-7.194045E-07*T**3-10581.05*T**(-1); 9.00000E+02 Y
+349690.802-2.66410256*T-26.34868*T*LN(T)-.0031129585*T**2
+1.26865583E-07*T**3+242619.5*T**(-1); 2.60000E+03 Y
+377351.663-86.5823361*T-16.43317*T*LN(T)-.00415333*T**2
+1.06912267E-07*T**3-12256680*T**(-1); 6.00000E+03 Y
+112360.659+457.05724*T-78.44235*T*LN(T)+.0022764175*T**2
-1.76759833E-08*T**3+1.9949745E+08*T**(-1); 1.65000E+04 Y
+468990.776+107.412651*T-41.98719*T*LN(T)+6.128755E-04*T**2
-3.41992333E-09*T**3-4.600016E+08*T**(-1); 2.00000E+04 N !
FUNCTION F10048T 2.98140E+02 +281443.327-10.1381821*T-31.62033*T*LN(T)
-.028592885*T**2+3.50043833E-06*T**3+115220.1*T**(-1); 8.00000E+02 Y
+266295.059+164.476889*T-57.40154*T*LN(T)-.00872063*T**2
+5.58152333E-07*T**3+1806677*T**(-1); 2.10000E+03 Y
+235799.422+343.090841*T-81.03807*T*LN(T)-4.0989945E-04*T**2
+2.43429667E-09*T**3+9383725*T**(-1); 6.00000E+03 N !
FUNCTION F10262T 2.98140E+02 -9522.9741+78.5273879*T-31.35707*T*LN(T)
+.0027589925*T**2-7.46390667E-07*T**3+56582.3*T**(-1); 1.00000E+03 Y
+180.108664-15.6128256*T-17.84857*T*LN(T)-.00584168*T**2
+3.14618667E-07*T**3-1280036*T**(-1); 2.10000E+03 Y
-18840.1663+92.3120255*T-32.05082*T*LN(T)-.0010728235*T**2
+1.14281783E-08*T**3+3561002.5*T**(-1); 6.00000E+03 N !
FUNCTION F10331T 2.98140E+02 +181695.921-8.95646803*T-27.17438*T*LN(T)
-.008276815*T**2+5.01971833E-08*T**3-79167.1*T**(-1); 9.00000E+02 Y
+176890.989+19.7206615*T-30.77769*T*LN(T)-.00851653*T**2
+4.38273833E-07*T**3+790952.5*T**(-1); 2.20000E+03 Y
+158568.702+130.442515*T-45.49406*T*LN(T)-.003192605*T**2
+7.58613833E-08*T**3+5186700*T**(-1); 6.00000E+03 N !
FUNCTION F10342T 2.98140E+02 +278543.593-132.335236*T-11.29365*T*LN(T)
-.039609675*T**2+5.06716167E-06*T**3-179074.6*T**(-1); 7.00000E+02 Y
+265272.041+40.9184161*T-37.41842*T*LN(T)-.01654095*T**2
+1.20156783E-06*T**3+1093557*T**(-1); 1.70000E+03 Y
+220908.567+328.357674*T-76.05898*T*LN(T)-.001203253*T**2
+3.22393E-08*T**3+10877605*T**(-1); 6.00000E+03 N !
FUNCTION F10336T 2.98140E+02 +243108.448-131.699572*T-10.04616*T*LN(T)
-.03855888*T**2+4.44032833E-06*T**3-210340.75*T**(-1); 8.00000E+02 Y
47. 41
+226001.683+65.9056148*T-39.21192*T*LN(T)-.016235705*T**2
+1.19297867E-06*T**3+1683940.5*T**(-1); 1.70000E+03 Y
+182200.978+358.524588*T-78.69521*T*LN(T)-2.383138E-04*T**2
-3.47482167E-08*T**3+10904680*T**(-1); 5.30000E+03 Y
+254116.982+143.611045*T-52.95996*T*LN(T)-.004252278*T**2
+8.06085667E-08*T**3-25992570*T**(-1); 6.00000E+03 N !
FUNCTION F10347T 2.98140E+02 +207653.255-142.056555*T-8.430374*T*LN(T)
-.03979746*T**2+4.65783333E-06*T**3-238312.05*T**(-1); 8.00000E+02 Y
+189877.188+65.145369*T-39.06339*T*LN(T)-.016076395*T**2
+1.16499367E-06*T**3+1711475*T**(-1); 1.70000E+03 Y
+157001.347+305.000994*T-71.81432*T*LN(T)-.001752856*T**2
+2.04542E-09*T**3+7803560*T**(-1); 4.50000E+03 Y
+182365.175+192.871055*T-57.77639*T*LN(T)-.004769903*T**2
+1.14961967E-07*T**3+1707626.5*T**(-1); 6.00000E+03 N !
FUNCTION F10518T 2.98140E+02 -53688.8736-38.3667407*T-21.21774*T*LN(T)
-.022871695*T**2+1.80809167E-06*T**3-76698.65*T**(-1); 1.10000E+03 Y
-74633.9375+137.490888*T-45.82843*T*LN(T)-.00981344*T**2
+4.74353E-07*T**3+3291161*T**(-1); 2.60000E+03 Y
-123038.477+373.346441*T-76.17662*T*LN(T)-.001227198*T**2
+1.40479833E-08*T**3+18061240*T**(-1); 6.00000E+03 N !
FUNCTION F10566T 2.98140E+02 +86927.7701-135.248392*T-9.500891*T*LN(T)
-.07254055*T**2+1.0957435E-05*T**3-66788*T**(-1); 6.00000E+02 Y
+69326.6131+135.209764*T-51.478*T*LN(T)-.027945695*T**2
+2.05087E-06*T**3+1319633*T**(-1); 1.60000E+03 Y
+769.960314+590.51067*T-112.8954*T*LN(T)-.0029814015*T**2
+1.05599267E-07*T**3+15929030*T**(-1); 4.20000E+03 Y
-32055.3399+708.209185*T-127.3663*T*LN(T)-1.5857495E-04*T**2
+3.25521E-09*T**3+29951250*T**(-1); 6.00000E+03 N !
FUN F6342T 298.15 +141418.321-9.44101793*T-20.78611*T*LN(T); 2100.00 Y
+141368.693-8.58565847*T-20.91598*T*LN(T)+1.0199925E-04*T**2-1.206805E-
08*T**3
+3353.518*T**(-1); 2800.00 Y +112295.515+124.541738*T-37.88143*T*LN(T)
+0.004540665*T**2-2.31092E-07*T**3+9457595*T**(-1); 4400.00 Y
+156940.205-11.6482861*T-21.50898*T*LN(T)+.0018818065*T**2-1.50393883E-
07*T**3
-13275080*T**(-1); 6000.00 N 3425!
FUN F6348T 298.15 +885358.534-15.1906264*T-20.78671*T*LN(T)+1.1131345E-
06*T**2
-1.37586517E-10*T**3; 4000.00 Y +870400.006+29.8529225*T-26.20004*T*LN(T)
+8.876465E-04*T**2-2.78826E-08*T**3+7876760*T**(-1); 6000.00 N 3426!
FUN F6353T 298.15 +277687.617+2.04844075*T-33.3823*T*LN(T)-0.0036632385*T**2
+5.40153E-07*T**3+113065.05*T**(-1); 1000.00 Y
+275597.918+28.7172488*T-37.38668*T*LN(T)-2.5023665E-04*T**2+1.55977433E
48. 42
-10*T**3+322228.65*T**(-1); 6000.00 N 3429!
FUN F6359T 298.15 -617678.793+271.461242*T-43.19771*T*LN(T)
-0.007312525*T**2+9.77222E-07*T**3+441315.75*T**(-1); 900.00 Y
-620730.383+311.970077*T-49.33815*T*LN(T)-0.001677129*T**2
+1.06486983E-09*T**3+741298*T**(-1); 4000.00 N 3432 !
FUN F6363T 298.15 +49572.4574-20.724101*T-28.6763*T*LN(T)+0.0021530865*T**2
-7.79200333E-06*T**3-27777.575*T**(-1); 600.00 Y
+74318.1378-480.555337*T+45.08678*T*LN(T)-0.0933095*T**2+1.496826E-05*T**3
-1534356.5*T**(-1); 1000.00 Y
-42754.8286+808.010526*T-143.3648*T*LN(T)+0.04137976*T**2-3.06178167E-
06*T**3
+12090925*T**(-1); 1800.00 Y
+81049.1755+10.0118468*T-36.3054*T*LN(T)-1.421451E-04*T**2
-1.85874167E-08*T**3-15028090*T**(-1); 6000.00 N 3434!
FUN F6416T 298.15 +280300.842-47.1984447*T-29.60134*T*LN(T)+3.322849E-04*T**2
-3.828185E-08*T**3-116214.8*T**(-1); 1600.00 Y
+279069.167-42.8588553*T-30.10208*T*LN(T)+2.7570675E-04*T**2-1.371048E-
08*T**3
+273336.55*T**(-1); 6000.00 N 3463!
FUN F6438T 298.15 -489487.744+508.139954*T-86.90168*T*LN(T)-.0234304*T**2;
823.00 Y -486312.177+483.690795*T-83.97288*T*LN(T)-.02230072*T**2; 1061.00 Y
-498630.446+717.372521*T-119.244*T*LN(T); 1300.00 N 3475!
FUN F5431T 298.15 +161862.82-37.3478525*T-22.46323*T*LN(T)-.0108807*T**2
+1.4425735E-06*T**3-62222.15*T**(-1); 1000.00 Y
+152193.841+65.066205*T-37.3935*T*LN(T)-2.509103E-04*T**2-1.96594333E-
08*T**3
+1159794.5*T**(-1); 3400.00 Y
+170184.128+16.6274371*T-31.72221*T*LN(T)-8.9638E-04*T**2-1.39016883E-
08*T**3
-8558980*T**(-1); 6000.00 N 2946!
FUNCTION GMGA2O3 2.98140E+02
-1133741.29+699.071125*T-114.3972*T*LN(T)
-.00748154*T**2+5.78706E-11*T**3+1187935*T**(-1); 2.08000E+03 Y
-1195085.77+1061.6879*T-160*T*LN(T)+1.3473055E-16*T**2
-6.11252667E-21*T**3+1.8468165E-07*T**(-1); 4.00000E+03 N !
FUNCTION GHSERMG 2.98140E+02 -8367.34+143.675547*T-26.1849782*T*LN(T)
+4.858E-04*T**2-1.393669E-06*T**3+78950*T**(-1); 9.23000E+02 Y
-14130.185+204.716215*T-34.3088*T*LN(T)+1.038192E+28*T**(-9);
3.00000E+03 N !
FUNCTION GMGLIQ 2.98140E+02 +8202.243-8.83693*T+GHSERMG#
-8.0176E-20*T**7; 9.23000E+02 Y
-5439.869+195.324057*T-34.3088*T*LN(T); 3.00000E+03 N !
49. 43
FUNCTION GHSERGA 2.98140E+02 -21312.331+585.263691*T-108.228783*T*LN(T)
+.227155636*T**2-1.18575257E-04*T**3+439954*T**(-1); 3.02890E+02 Y
-7055.643+132.73019*T-26.0692906*T*LN(T)+1.506E-04*T**2
-4.0173E-08*T**3-118332*T**(-1)+1.64547E+23*T**(-9); 4000 N !
FUNCTION GLIQGA 298.15 +5491.298-18.073995*T-7.0171E-17*T**7+GHSERGA#;
3.02890E+02 Y
+5666.455-18.681147*T-1.64547E+23*T**(-9)+GHSERGA#; 4000 N !
FUNCTION GHSERNN 2.98120E+02 -3750.675-9.45425*T-12.7819*T*LN(T)
-.00176686*T**2+2.681E-09*T**3-32374*T**(-1); 9.50000E+02 Y
-7358.85+17.2003*T-16.3699*T*LN(T)-6.5107E-04*T**2+3.0097E-08*T**3
+563070*T**(-1); 3.35000E+03 Y
-16392.8+50.26*T-20.4695*T*LN(T)+2.39754E-04*T**2-8.333E-09*T**3
+4596375*T**(-1); 6.00000E+03 N !
FUNCTION F12224T 2.98120E+02 -8000.12556-8.81620364*T-27.22332*T*LN(T)
-.0012599175*T**2-5.39381E-07*T**3-38326.695*T**(-1); 8.00000E+02 Y
-10569.6463+2.77534156*T-28.42384*T*LN(T)-.003189275*T**2
+2.06638E-07*T**3+416969.05*T**(-1); 2.20000E+03 Y
-22468.6305+71.8176271*T-37.55014*T*LN(T)-6.158995E-06*T**2
-4.22547E-09*T**3+3427512*T**(-1); 6.00000E+03 N !
FUNCTION GHSEROO 2.98140E+02 -3480.87-25.503038*T-11.136*T*LN(T)
-.005098888*T**2+6.61846E-07*T**3-38365*T**(-1); 1.00000E+03 Y
-6568.763+12.65988*T-16.8138*T*LN(T)-5.95798E-04*T**2+6.781E-09*T**3
+262905*T**(-1); 3.30000E+03 Y
-13986.728+31.259625*T-18.9536*T*LN(T)-4.25243E-04*T**2
+1.0721E-08*T**3+4383200*T**(-1); 6.00000E+03 N !
FUNCTION F12999T 2.98140E+02 -6960.6927-51.1831467*T-22.25862*T*LN(T)
-.01023867*T**2+1.339947E-06*T**3-76749.55*T**(-1); 9.00000E+02 Y
-13136.0174+24.7432966*T-33.55726*T*LN(T)-.0012348985*T**2
+1.66943333E-08*T**3+539886*T**(-1); 3.70000E+03 Y
+14154.6459-51.485458*T-24.47978*T*LN(T)-.002634759*T**2
+6.01544333E-08*T**3-15120935*T**(-1); 9.60000E+03 Y
-314316.629+515.068037*T-87.56143*T*LN(T)+.0025787245*T**2
-1.878765E-08*T**3+2.9052515E+08*T**(-1); 1.85000E+04 Y
-108797.175+288.483019*T-63.737*T*LN(T)+.0014375*T**2-9E-09*T**3
+.25153895*T**(-1); 2.00000E+04 N !
FUNCTION F12105T 2.98140E+02 +25529.8548-74.1230264*T-22.64997*T*LN(T)
-.02642243*T**2+3.80986E-06*T**3-35297.05*T**(-1); 8.00000E+02 Y
+7513.54424+138.924199*T-54.23972*T*LN(T)-.0014094615*T**2
+2.665295E-08*T**3+1916225.5*T**(-1); 2.40000E+03 Y
+26818.2117+73.9806273*T-46.44399*T*LN(T)-.002389866*T**2
+1.60144167E-08*T**3-5927190*T**(-1); 6.00000E+03 N !
FUNCTION F9633T 2.98140E+02 +259072.278+88.0130706*T-38.71057*T*LN(T)
+.01053784*T**2-9.86907833E-07*T**3+338489.2*T**(-1); 6.00000E+02 Y
+263812.519+33.4871435*T-30.75007*T*LN(T)+.00537745*T**2
50. 44
-5.46534E-07*T**3-150942.65*T**(-1); 1.40000E+03 Y
+270292.501-28.1810494*T-21.9834*T*LN(T)+3.192416E-04*T**2
-1.46299133E-08*T**3-992093*T**(-1); 6.00000E+03 Y
+340110.007-140.262257*T-9.704267*T*LN(T)-4.5138725E-04*T**2
-1.13427367E-08*T**3-68387950*T**(-1); 1.00000E+04 N !
FUNCTION F9695T 2.98140E+02 +422882.385-36.0787973*T-33.72863*T*LN(T)
-.009368525*T**2+7.62775167E-07*T**3-19520.385*T**(-1); 1.10000E+03 Y
+419324.178+8.33965897*T-40.33555*T*LN(T)-.0041854135*T**2
+2.679565E-08*T**3+312119.6*T**(-1); 2.50000E+03 N !
FUNCTION F12044T 2.98120E+02 +466446.153-13.3752574*T-20.89393*T*LN(T)
+8.45521E-05*T**2-1.0018685E-08*T**3+2788.7865*T**(-1); 2.95000E+03 Y
+481259.035-52.5441353*T-16.37613*T*LN(T)-2.283738E-04*T**2
-2.78997167E-08*T**3-7559105*T**(-1); 6.00000E+03 N !
FUNCTION F12196T 2.98120E+02 +462541.812-39.7408578*T-26.55434*T*LN(T)
-.00920795*T**2+1.474184E-06*T**3+32740.96*T**(-1); 8.00000E+02 Y
+454624.274+54.7666048*T-40.59669*T*LN(T)+.0020964085*T**2
-2.72221333E-07*T**3+884792.5*T**(-1); 3.30000E+03 Y
+581650.406-431.216401*T+19.76267*T*LN(T)-.010792005*T**2
+2.48554833E-07*T**3-49877130*T**(-1); 6.00000E+03 N !
FUNCTION F12280T 2.98120E+02 +426260.222-44.8788468*T-24.40177*T*LN(T)
-.02510581*T**2+3.41313667E-06*T**3+61652.95*T**(-1); 8.00000E+02 Y
+409926.892+144.323862*T-52.34995*T*LN(T)-.0035522355*T**2
+2.39819667E-07*T**3+1869491.5*T**(-1); 2.20000E+03 Y
+398090.062+216.588607*T-61.96494*T*LN(T)-5.55378E-05*T**2
+1.47712917E-09*T**3+4654831*T**(-1); 6.00000E+03 N !
FUNCTION F12086T 2.98140E+02 +84541.234-53.2685707*T-23.05118*T*LN(T)
-.00773676*T**2+7.958725E-07*T**3-116651.7*T**(-1); 1.30000E+03 Y
+72016.3331+50.3919012*T-37.55634*T*LN(T)+2.5959415E-05*T**2
-1.0102065E-08*T**3+1993077*T**(-1); 5.50000E+03 Y
+193062.975-167.844989*T-13.21204*T*LN(T)-.001897405*T**2
+1.07721683E-08*T**3-1.035763E+08*T**(-1); 9.80000E+03 Y
+141666.793-231.549084*T-4.460748*T*LN(T)-.0036373205*T**2
+4.77457333E-08*T**3+90737150*T**(-1); 1.45000E+04 Y
-1408316.2+1357.22153*T-170.9364*T*LN(T)+.004321709*T**2
-2.36937E-08*T**3+2.8014245E+09*T**(-1); 2.00000E+04 N !
FUNCTION F12131T 2.98140E+02 +60936.7603-119.706045*T-13.98226*T*LN(T)
-.0710008*T**2+1.45375167E-05*T**3+71782.15*T**(-1); 6.00000E+02 Y
+38781.1547+236.715319*T-69.83849*T*LN(T)-.00748635*T**2
+8.08523167E-07*T**3+1744625.5*T**(-1); 1.30000E+03 Y
+28463.3103+328.753317*T-82.85617*T*LN(T)-4.7531705E-05*T**2
+1.38402533E-09*T**3+3317556.5*T**(-1); 6.00000E+03 N !
FUNCTION F12244T 2.98140E+02 +69889.683+1.24061836*T-31.21485*T*LN(T)
-.019157825*T**2+2.34882167E-06*T**3+123003.15*T**(-1); 9.00000E+02 Y
51. 45
+53539.3114+171.80454*T-55.97507*T*LN(T)-.002136031*T**2
+9.51779E-08*T**3+2178609.5*T**(-1); 2.90000E+03 Y
+44330.7692+219.351601*T-62.13725*T*LN(T)-3.142339E-04*T**2
-4.42602667E-09*T**3+4790137*T**(-1); 6.00000E+03 N !
FUNCTION F12259T 2.98140E+02 +67000.0103+82.8661553*T-56.69035*T*LN(T)
-.031484725*T**2+4.19524167E-06*T**3+22712.27*T**(-1); 9.00000E+02 Y
+38811.1883+382.785851*T-100.3852*T*LN(T)-6.705045E-04*T**2
+9.19639E-09*T**3+3496587*T**(-1); 3.60000E+03 Y
+56990.4343+325.883438*T-93.54539*T*LN(T)-.001742185*T**2
+3.75764167E-08*T**3-5137495*T**(-1); 6.00000E+03 N !
FUNCTION F12266T 2.98140E+02 -12245.9134+98.615067*T-54.5103*T*LN(T)
-.0623602*T**2+1.02925967E-05*T**3+313927.65*T**(-1); 7.00000E+02 Y
-45747.139+539.481565*T-121.0939*T*LN(T)-.002891013*T**2
+1.97306333E-07*T**3+3501461*T**(-1); 2.40000E+03 Y
-54714.2645+596.999728*T-128.7898*T*LN(T)-1.1451065E-05*T**2
+2.94897333E-10*T**3+5464985*T**(-1); 6.00000E+03 N !
FUNCTION F12271T 2.98140E+02 -16690.7045+192.936545*T-76.76772*T*LN(T)
-.0536395*T**2+7.90501333E-06*T**3+410438.1*T**(-1); 8.00000E+02 Y
-53638.5271+628.485872*T-141.3325*T*LN(T)-.002508831*T**2
+1.38712517E-07*T**3+4437212*T**(-1); 3.00000E+03 Y
-65218.908+691.054988*T-149.4851*T*LN(T)-2.029353E-05*T**2
+4.64811333E-10*T**3+7518275*T**(-1); 6.00000E+03 N !
FUNCTION GHSRGAN 2.98150E+02 -137111.76+272.38786*T
-44.3769*T*LN(T)-0.0063011*T**2+586388*T**(-1); 6000 N !
FUNCTION FFTEMP 2.98150E+02 +77.4976*T-15.75296*T*LN(T)
+2.430546E-03*T**2; 6000 N !
FUNCTION GHGANE 2.98150E+02 +33735.24+490.17846*T
-72.60086*T*LN(T)-.0038706*T**2+586388*T**(-1); 6000 N !
FUNCTION GHGANHL 2.98150E+02 +33735.24+490.16246*T
-72.60086*T*LN(T)-.0038706*T**2+586388*T**(-1); 6000 N !
TYPE_DEFINITION % SEQ *!
DEFINE_SYSTEM_DEFAULT SPECIE 2 !
DEFAULT_COMMAND DEF_SYS_ELEMENT VA /- !
PHASE GAS:G % 1 1.0 !
CONSTITUENT GAS:G :GA1,GA1O1,GA2,GA2O1,O,O2,H,H2,H3N1,N1,N2,MG1,MG2,
MG+1,MG1N1,MG1O1,H1MG1 : !
$ CONSTITUENT GAS:G :GA,GA1O1,GA2,GA2O1,O,O3,O2,H,H1N1,H1N3,H2,
$ H2N1,H2N2_1_1N2H2,H2N2_CIS,H2N2_TRANS,H3N1,H4N2,N,N2,N3 : !
PARAMETER G(GAS,H;0) 2.98150E+02 +F9878T#+R#*T*LN(1E-05*P);
6.00000E+03 N REF:4629 !
PARAMETER G(GAS,H1N1;0) 2.98150E+02 +F10011T#+R#*T*LN(1E-05*P);
52. 46
6.00000E+03 N REF:4667 !
PARAMETER G(GAS,H1N3;0) 2.98150E+02 +F10048T#+R#*T*LN(1E-05*P);
6.00000E+03 N REF:4673 !
PARAMETER G(GAS,H2;0) 2.98150E+02 +F10262T#+R#*T*LN(1E-05*P);
6.00000E+03 N REF:4716 !
PARAMETER G(GAS,H2N1;0) 2.98150E+02 +F10331T#+R#*T*LN(1E-05*P);
6.00000E+03 N REF:4739 !
PARAMETER G(GAS,H2N2_1_1N2H2;0) 2.98150E+02 +F10342T#+R#*T*LN(1E-05*P);
6.00000E+03 N REF:4741 !
PARAMETER G(GAS,H2N2_CIS;0) 2.98150E+02 +F10336T#+R#*T*LN(1E-05*P);
6.00000E+03 N REF:4740 !
PARAMETER G(GAS,H2N2_TRANS;0) 2.98150E+02 +F10347T#+R#*T*LN(1E-05*P);
6.00000E+03 N REF:4742 !
PARAMETER G(GAS,H3N1;0) 2.98150E+02 +F10518T#+R#*T*LN(1E-05*P);
6.00000E+03 N REF:4804 !
PARAMETER G(GAS,H4N2;0) 2.98150E+02 +F10566T#+R#*T*LN(1E-05*P);
6.00000E+03 N REF:4824 !
PARAMETER G(GAS,GA1;0) 2.98150E+02 +F9633T#+R#*T*LN(1E-05*P);
6.00000E+03 N !
PARAMETER G(GAS,GA2;0) 2.98150E+02 +F9695T#+R#*T*LN(1E-05*P);
6.00000E+03 N !
PARAMETER G(GAS,N1;0) 2.98150E+02 +F12044T#+R#*T*LN(1E-05*P);
6.00000E+03 N !
PARAMETER G(GAS,N2;0) 2.98150E+02 +F12224T#+R#*T*LN(1E-05*P);
6.00000E+03 N !
PARAMETER G(GAS,N3;0) 2.98150E+02 +F12280T#+R#*T*LN(1E-05*P);
6.00000E+03 N !
PARAMETER G(GAS,MG1;0) 298.15 F6342T# +R*T*LN(1E-5*P);,,N 3425!
PARAMETER G(GAS,MG+1;0) 298.15 F6348T#+R*T*LN(1E-5*P);,,N 3426!
PARAMETER G(GAS,MG1N1;0) 298.15 F6353T#+R*T*LN(1E-5*P);,,N 3429!
PARAMETER G(GAS,MG1O1;0) 298.15 F6363T#+R*T*LN(1E-5*P);,,N 3434!
PARAMETER G(GAS,MG2;0) 298.15 F6416T#+R*T*LN(1E-5*P);,,N 3463!
PARAMETER G(GAS,H1MG1;0) 298.15 F5431T#+R*T*LN(1E-5*P);,,N 2946!
PARAMETER G(GAS,N1O1;0) 2.98150E+02 +F12086T#+R#*T*LN(1E-05*P);
6.00000E+03 N REF:5556 !
PARAMETER G(GAS,N1O2;0) 2.98150E+02 +F12105T#+R#*T*LN(1E-05*P);
6.00000E+03 N REF:5558 !
PARAMETER G(GAS,N1O3;0) 2.98150E+02 +F12131T#+R#*T*LN(1E-05*P);
6.00000E+03 N REF:5563 !
PARAMETER G(GAS,N2O1;0) 2.98150E+02 +F12244T#+R#*T*LN(1E-05*P);
6.00000E+03 N REF:5602 !
PARAMETER G(GAS,N2O3;0) 2.98150E+02 +F12259T#+R#*T*LN(1E-05*P);
6.00000E+03 N REF:5606 !
53. 47
PARAMETER G(GAS,N2O4;0) 2.98150E+02 +F12266T#+R#*T*LN(1E-05*P);
6.00000E+03 N REF:5608 !
PARAMETER G(GAS,N2O5;0) 2.98150E+02 +F12271T#+R#*T*LN(1E-05*P);
6.00000E+03 N REF:5609 !
PARAMETER G(GAS,GA1O1;0) 2.98150E+02 +F9673T#+R#*T*LN(1E-05*P);
6.00000E+03 N !
PARAMETER G(GAS,GA2O1;0) 2.98150E+02 +F9709T#+R#*T*LN(1E-05*P);
6.00000E+03 N !
PARAMETER G(GAS,O;0) 2.98150E+02 +F12657T#+R#*T*LN(1E-05*P);
6.00000E+03 N !
PARAMETER G(GAS,O2;0) 2.98150E+02 +F12999T#+R#*T*LN(1E-05*P);
6.00000E+03 N !
PARAMETER G(GAS,O3;0) 2.98150E+02 +F13287T#+R#*T*LN(1E-05*P);
6.00000E+03 N !
PHASE LIQUID:L % 1 1.0 !
$ CONSTITUENT LIQUID:L :GA, N : !
CONSTITUENT LIQUID:L :GA, MG : !
PARAMETER G(LIQUID,GA;0) 2.98150E+02 +GLIQGA#; 6000 N !
PARAMETER G(LIQUID,N;0) 2.98150E+02 +29950+59.02*T+GHSERNN#;
6.00000E+03 N !
PARAMETER G(LIQUID,GA,N;0) 2.98150E+02 -21626.17+18.28509*T;
6.00000E+03 N !
PARAMETER G(LIQUID,GA,N;1) 2.98150E+02 +41667.21-4.29523*T;
6.00000E+03 N !
PARAMETER G(LIQUID,MG;0) 2.98140E+02 +GMGLIQ#; 3.00000E+03 N REF: 0 !
$ Below two parameters are estimated according to rare work on this system
$ It will be good to treat the O- liquid with association model.
$ Here it is only a dilute solution so ...
$ PARAMETER G(LIQUID,O;0) 2.98150E+02 +GHSEROO#; 6000 N !
$ PARAMETER G(LIQUID,GA,O;0) 2.98150E+02 -9258; 6000 N !
PHASE GAN % 4 1 1 1 1 !
$$ CONSTITUENT GAN :GA,VA-3,MG,MG-1 : N,VA+1,O+1 : H+1,VA : VA,VA-1,VA+1 :!
$$ CONSTITUENT GAN :GA,MG-1,MG : N,VA+1 : H+1,VA : VA,VA-1,VA+1 :!
$$ PHASE GAN % 2 1 1 !
$$ CONSTITUENT GAN :GA, VA, VA-3 : N, O+1:!
CONSTITUENT GAN :GA:N,VA+1:VA:VA,VA-1,VA+1:!
PARAMETER G(GAN,GA:N:VA:VA;0) 2.98150E+02 -137111.76+272.38786*T
54. 48
-44.3769*T*LN(T)-.0063011*T**2+586388*T**(-1); 6.00000E+03 N REF: 0 !
PARAMETER G(GAN,GA:N:VA:VA+1;0) 2.98150E+02 +33735.24+490.16246*T
-72.60086*T*LN(T)-.0038706*T**2+586388*T**(-1); 6.00000E+03 N REF: 0 !
PARAMETER G(GAN,GA:N:VA:VA-1;0) 2.98150E+02 +33735.24+490.17846*T
-72.60086*T*LN(T)-.0038706*T**2+586388*T**(-1); 6.00000E+03 N REF: 0 !
$ PARAMETER G(GAN,GA:O;0) 2.98150E+02
$ -200000+GHSEROO+GHSERGA;,,,,!
PARAMETER G(GAN,GA:O+1:VA:VA-1;0) 2.98150E+02 186710
+0.4*GMGA2O3;,,,,!
PARAMETER G(GAN,GA:O+1:VA:VA;0) 2.98150E+02 28000
+0.4*GMGA2O3; ,, N !
PARAMETER G(GAN,GA:O+1:VA:VA+1;0) 2.98150E+02 -130710
+0.4*GMGA2O3; 6000 N !
PARAMETER G(GAN,VA-3:N:VA:VA-1;0) 2.98150E+02 21880
+77.4976*T-15.75296*T*LN(T)+2.430546E-03*T**2; 6000 N !
PARAMETER G(GAN,VA-3:N:VA:VA;0) 2.98150E+02 498000 +
77.4976*T-15.75296*T*LN(T)+2.430546E-03*T**2; ,, N !
PARAMETER G(GAN,VA-3:N:VA:VA+1;0) 2.98150E+02 +974120
+77.4976*T-15.75296*T*LN(T)+2.430546E-03*T**2; 6000 N !
PARAMETER G(GAN,GA:N:H+1:VA;0) 2.98150E+02 +142231.16
-188.664*T+FFTEMP#; 6.00000E+03 N REF: 0 !
PARAMETER G(GAN,GA:N:H+1:VA+1;0) 2.98150E+02 -27768.84
-188.664*T+FFTEMP#; 6.00000E+03 N REF: 0 !
PARAMETER G(GAN,GA:N:H+1:VA-1;0) 2.98150E+02 +312231.16
-188.664*T+FFTEMP#; 6.00000E+03 N REF: 0 !
PARAMETER G(GAN,MG-1:N:VA:VA;0) 2.98150E+02 -234913.1+FFTEMP#;
6.00000E+03 N REF: 0 !
PARAMETER G(GAN,MG-1:N:VA:VA+1;0) 2.98150E+02 -60467.1+FFTEMP#;
6.00000E+03 N REF: 0 !
PARAMETER G(GAN,MG-1:N:VA:VA-1;0) 2.98150E+02 -404913+FFTEMP#;
6.00000E+03 N REF: 0 !
$ PARAMETER G(GAN,GA:VA+1:VA:VA;0) 2.98150E+02 +200780.4+FFTEMP#;
$ 6.00000E+03 N REF: 0 !