SlideShare a Scribd company logo
1 of 1
Download to read offline
MONTH 2012-13 2013-14 2014-15
APRIL (5.3482) (0.1173) 0.8979
MAY 7.9636 13.5572 1.4627
JUNE (0.1078) 51.9499 (0.5797)
JULY (3.7490) 9.7246 13.6675
AUGUST (0.1490) (2.8998) 1.5882
SEPTEMBER 10.8481 0.0000 (8.2291)
OCTOBER 3.1670 12.7571 (13.8046)
NOVEMBER 4.7269 0.6383 0.0000
DECEMBER (0.3508) (0.3242) (0.0916)
JANUARY 1.9300 21.8572 26.7496
FEBRUARY 9.1848 0.0000 1.8568
MARCH 2.8800 0.0000 12.7779
TOTAL 30.9956 107.1430 36.2956
PERFORMANCE METRICS 2012-13 2013-14 2014-15
STANDARD DEVIATION 4.98 15.58 10.55
AVERAGE MONTHLY RETURN 2.58 8.93 3.02
MONTHLY RISK FREE RATE 0.68 0.62 0.74
MONTHLY RISK ADJUSTED RETURN 1.90 8.31 2.29
RESULTS OF REAL MONEY PROPRIETORY DOMESTIC ACCOUNT
MONTHLY RETURN (%)
MONTHLY RISK ADJUSTED RETURN 1.90 8.31 2.29
ANNUAL RATE OF RETURN 31.00 107.14 36.30
SHARPE RATIO 1.32 1.85 0.75
WORST PEAK TO VALLEY DRAWDOWN 3.90 1.66 18.90
LARGEST MONTHLY DRAWDOWN 5.35 2.90 13.80
OUTPERFORMED THE BENCHMARK INDEX
(RRM PORTFOLIO - NIFTY CASH) 24.14 89.62 9.97
OUTPERFORMED THE RISK FREE RETURN (RRM
PORTFOLIO - 364 DS RBI T/BILL) 22.81 99.68 27.48
RISK FREE RETURN - BASED ON RBI 364 DS
T/BILL ~ 1ST QTR AVG 8.19 7.46 8.82
BENCHMARK NIFTY CASH (APR to MAR)
5317.90 - 5682.55 = +364.65 pts (2012-13)
5704.40 - 6704.20 = +999.80 pts (2013-14)
6721.05 - 8491.00 = + 1769.95 pts (2014-15) 6.86 17.53 26.33

More Related Content

Similar to RRM Real Money Performance Metrics

Ene 2012
Ene 2012Ene 2012
Ene 2012jerry53
 
Indices financieros
Indices financierosIndices financieros
Indices financierosgerals13
 
Indices financieros
Indices financierosIndices financieros
Indices financierosgerals13
 
Ene 2012
Ene 2012Ene 2012
Ene 2012jerry53
 
Laporan 1 Sistem dan Signal (DFT Ms. Excel)
Laporan 1 Sistem dan Signal (DFT Ms. Excel)Laporan 1 Sistem dan Signal (DFT Ms. Excel)
Laporan 1 Sistem dan Signal (DFT Ms. Excel)Bayu Nurcahyo
 
P34 ex2 a01362061
P34 ex2 a01362061P34 ex2 a01362061
P34 ex2 a01362061Tzamn
 
Stock Indicies
Stock IndiciesStock Indicies
Stock Indiciesukabuka
 
Bouncing ball lab
Bouncing ball labBouncing ball lab
Bouncing ball lab16098
 
Refrigerant properties charts 4-5
Refrigerant properties charts 4-5Refrigerant properties charts 4-5
Refrigerant properties charts 4-5Muhammad Asim
 
January - December 2015 - Export Statistics of Turkish Citrus
January - December 2015 - Export Statistics of Turkish CitrusJanuary - December 2015 - Export Statistics of Turkish Citrus
January - December 2015 - Export Statistics of Turkish CitrusTurkish Citrus Promotion Group
 
función paramétrica x=sent,y=cost
función paramétrica x=sent,y=costfunción paramétrica x=sent,y=cost
función paramétrica x=sent,y=costabelbaca
 
Problema 6.2 método newton raphson
Problema 6.2 método newton raphson Problema 6.2 método newton raphson
Problema 6.2 método newton raphson Yoel Diomedez
 
Table 17 rate of growth (% yoy) gdp and its component at current prices
Table 17 rate of growth (% yoy) gdp and its component at current pricesTable 17 rate of growth (% yoy) gdp and its component at current prices
Table 17 rate of growth (% yoy) gdp and its component at current pricesPadma Natarajan
 
Kedia daily evening report as on 08052020
Kedia daily evening report as on 08052020Kedia daily evening report as on 08052020
Kedia daily evening report as on 08052020Ajay Kedia
 
Financial analysis of tata motors
Financial analysis of tata motorsFinancial analysis of tata motors
Financial analysis of tata motorsCA Ajay Biwal
 

Similar to RRM Real Money Performance Metrics (20)

Ene 2012
Ene 2012Ene 2012
Ene 2012
 
Indices financieros
Indices financierosIndices financieros
Indices financieros
 
Indices financieros
Indices financierosIndices financieros
Indices financieros
 
Ene 2012
Ene 2012Ene 2012
Ene 2012
 
Laporan 1 Sistem dan Signal (DFT Ms. Excel)
Laporan 1 Sistem dan Signal (DFT Ms. Excel)Laporan 1 Sistem dan Signal (DFT Ms. Excel)
Laporan 1 Sistem dan Signal (DFT Ms. Excel)
 
Bse 30 pe histry
Bse 30  pe histryBse 30  pe histry
Bse 30 pe histry
 
P34 ex2 a01362061
P34 ex2 a01362061P34 ex2 a01362061
P34 ex2 a01362061
 
Electricity Production Data (YAP)
Electricity Production Data (YAP)Electricity Production Data (YAP)
Electricity Production Data (YAP)
 
Stock Indicies
Stock IndiciesStock Indicies
Stock Indicies
 
Bouncing ball lab
Bouncing ball labBouncing ball lab
Bouncing ball lab
 
Planilha
PlanilhaPlanilha
Planilha
 
Refrigerant properties charts 4-5
Refrigerant properties charts 4-5Refrigerant properties charts 4-5
Refrigerant properties charts 4-5
 
January - December 2015 - Export Statistics of Turkish Citrus
January - December 2015 - Export Statistics of Turkish CitrusJanuary - December 2015 - Export Statistics of Turkish Citrus
January - December 2015 - Export Statistics of Turkish Citrus
 
función paramétrica x=sent,y=cost
función paramétrica x=sent,y=costfunción paramétrica x=sent,y=cost
función paramétrica x=sent,y=cost
 
F&O Report 27 August 2013 Mansukh Investment and Trading Solution
F&O Report 27 August 2013 Mansukh Investment and Trading SolutionF&O Report 27 August 2013 Mansukh Investment and Trading Solution
F&O Report 27 August 2013 Mansukh Investment and Trading Solution
 
Problema 6.2 método newton raphson
Problema 6.2 método newton raphson Problema 6.2 método newton raphson
Problema 6.2 método newton raphson
 
EmployeeGoalSetting
EmployeeGoalSettingEmployeeGoalSetting
EmployeeGoalSetting
 
Table 17 rate of growth (% yoy) gdp and its component at current prices
Table 17 rate of growth (% yoy) gdp and its component at current pricesTable 17 rate of growth (% yoy) gdp and its component at current prices
Table 17 rate of growth (% yoy) gdp and its component at current prices
 
Kedia daily evening report as on 08052020
Kedia daily evening report as on 08052020Kedia daily evening report as on 08052020
Kedia daily evening report as on 08052020
 
Financial analysis of tata motors
Financial analysis of tata motorsFinancial analysis of tata motors
Financial analysis of tata motors
 

RRM Real Money Performance Metrics

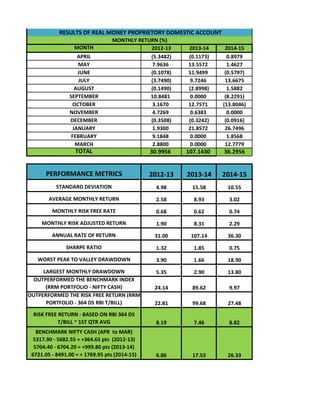
  • 1. MONTH 2012-13 2013-14 2014-15 APRIL (5.3482) (0.1173) 0.8979 MAY 7.9636 13.5572 1.4627 JUNE (0.1078) 51.9499 (0.5797) JULY (3.7490) 9.7246 13.6675 AUGUST (0.1490) (2.8998) 1.5882 SEPTEMBER 10.8481 0.0000 (8.2291) OCTOBER 3.1670 12.7571 (13.8046) NOVEMBER 4.7269 0.6383 0.0000 DECEMBER (0.3508) (0.3242) (0.0916) JANUARY 1.9300 21.8572 26.7496 FEBRUARY 9.1848 0.0000 1.8568 MARCH 2.8800 0.0000 12.7779 TOTAL 30.9956 107.1430 36.2956 PERFORMANCE METRICS 2012-13 2013-14 2014-15 STANDARD DEVIATION 4.98 15.58 10.55 AVERAGE MONTHLY RETURN 2.58 8.93 3.02 MONTHLY RISK FREE RATE 0.68 0.62 0.74 MONTHLY RISK ADJUSTED RETURN 1.90 8.31 2.29 RESULTS OF REAL MONEY PROPRIETORY DOMESTIC ACCOUNT MONTHLY RETURN (%) MONTHLY RISK ADJUSTED RETURN 1.90 8.31 2.29 ANNUAL RATE OF RETURN 31.00 107.14 36.30 SHARPE RATIO 1.32 1.85 0.75 WORST PEAK TO VALLEY DRAWDOWN 3.90 1.66 18.90 LARGEST MONTHLY DRAWDOWN 5.35 2.90 13.80 OUTPERFORMED THE BENCHMARK INDEX (RRM PORTFOLIO - NIFTY CASH) 24.14 89.62 9.97 OUTPERFORMED THE RISK FREE RETURN (RRM PORTFOLIO - 364 DS RBI T/BILL) 22.81 99.68 27.48 RISK FREE RETURN - BASED ON RBI 364 DS T/BILL ~ 1ST QTR AVG 8.19 7.46 8.82 BENCHMARK NIFTY CASH (APR to MAR) 5317.90 - 5682.55 = +364.65 pts (2012-13) 5704.40 - 6704.20 = +999.80 pts (2013-14) 6721.05 - 8491.00 = + 1769.95 pts (2014-15) 6.86 17.53 26.33