This document discusses two productivity models: Logistical Entropy and Average Time for Job Completion. Logistical Entropy is a function that models productivity based on capital, labor, energy, materials, services, and technology inputs over time. It describes how these factors are defined and measured for government spending. Average Time for Job Completion lists the average times spent on various supply chain tasks in a hospital including scanning, computer usage, cleaning, checking expiration dates, picking supplies, transporting products, phone calls, and research.
Theory of Production and Cost, Break-even Analysis
Logistical entropy a productivity model1
1. Logistical Entropy a Productivity Model
Productivity
Increased amount of product delivered to the wards.
Removal of nonessential/nonmedical products from primary and
secondaries.
Increase primary size.
Increase secondary closet size.
Increased amount of delivery carts and the cart size.
Increased training for personnel.
Increased amount of personnel.
Increase advancement opportunities for support personnel.
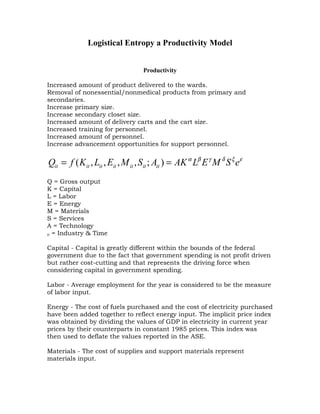
Qit = f ( K it , Lit , Eit , M it , Sit ; Ait ) = AK α Lβ E γ M δ S ξ eε
Q = Gross output
K = Capital
L = Labor
E = Energy
M = Materials
S = Services
A = Technology
it = Industry & Time
Capital - Capital is greatly different within the bounds of the federal
government due to the fact that government spending is not profit driven
but rather cost-cutting and that represents the driving force when
considering capital in government spending.
Labor - Average employment for the year is considered to be the measure
of labor input.
Energy - The cost of fuels purchased and the cost of electricity purchased
have been added together to reflect energy input. The implicit price index
was obtained by dividing the values of GDP in electricity in current year
prices by their counterparts in constant 1985 prices. This index was
then used to deflate the values reported in the ASE.
Materials - The cost of supplies and support materials represent
materials input.
2. Services - To obtain services input, we add the cost of industrial services
with the cost of non-industrial services done by others. To correct for
price changes, another deflator series was constructed. Taking the value
of GDP in services in current prices and dividing it by the GDP in
services in constant 1985 prices, the necessary index was built.
Technology - Ait represents technology, whereby inter-industrial and
inter-temporal variations in total factor productivity are incorporated into
the production function.
ln(Qit ) = ci + λ t + α ln(K it ) + β ln(L it ) + γ ln(E it ) + δ ln(M) + ξ ln(Sit ) + ε it .
Average Time for Job Completion
Scanning product 15 minutes per ward.
Computer usage GIP 15 minutes.
Computer usage Outlook 15 minutes.
Cleaning secondary closet 10 minutes per ward.
Checking for expired product 15 minutes per ward.
Picking supplies for wards 25 minutes.
Transporting products 10 minutes per ward.
Elevators 50 minutes.
Answering phone calls in Central Supply, 10 minutes per call 5 calls
average.
Drop ins for supplies, 10 minutes per drop in, an average of 3 per day.
Research products, 20 minutes.
Duty cell phones, 5 minutes per call, an average 2 calls per day.