SlideShare a Scribd company logo
1 of 23
Download to read offline
ThermoFisher Scientific Inc. (NYSE: TMO) Proposal to
acquire Life Technologies (NYSE: LIFE)
Rohit Behera
1MGT 6066 Fall 2016 – Corporate Restructuring
Acquisition of BRAHMS
• Leading provider of specialty in-
vitro diagnostic tests
• Integrated in the specialty
diagnostics division
Acquisition of PHADIA
• Global leader in blood tests
• Integrated in the specialty
diagnostics division
• EPS rose by 35.8%
Acquisition of DIONEX
• Leading manufacturer and marketer
of chromatography systems
• Integrated in the analytical
technologies segment
• Revenues rose by 4%
ThermoFisher Scientific (Acquirer) (NYSE: TMO)
2MGT 6066 Fall 2016 – Corporate Restructuring
Overview
• World leader in serving science
• 39,000 Employees
• 2012 Revenue: $12.0B
• Supplies to pharmaceutical and biotech companies, hospitals and clinical
diagnostic labs, universities, research institutions, and government agencies
Acquisition of ONE LAMBDA Inc.
• Global leader in transplant
diagnostics
• Integrated in the specialty
diagnostics division
2013
2012
2011
2010
2009
Proven Track Record of
Acquisitions
37%
24%
18%
18%
-3%
Business Segments
Laboratory Products and Services
Life Sciences Solutions
Speciality Diagnostics
Analytical Technologies
Eliminations
51%
31%
8%
5%
5%
Geographic Segments
United States
Other
China
Germany
United Kingdom
Acquisition of Life
Technologies
LIFE TECHNOLOGIES INC. (Target) (NYSE: 1255459D)
3MGT 6066 Fall 2016 – Corporate Restructuring
0
0.05
0.1
0.15
0.2
0.25
0.3
0.35
0.4
Jan-08
Apr-08
Jul-08
Oct-08
Jan-09
Apr-09
Jul-09
Oct-09
Jan-10
Apr-10
Jul-10
Oct-10
Jan-11
Apr-11
Jul-11
Oct-11
Jan-12
Apr-12
Jul-12
Oct-12
Jan-13
Apr-13
Cash Flow to Total Debt
LABEQ DRUGS LIFE TMO
0
0.02
0.04
0.06
0.08
0.1
0.12
0.14
0.16
0.18
0.2
Jan-08
Apr-08
Jul-08
Oct-08
Jan-09
Apr-09
Jul-09
Oct-09
Jan-10
Apr-10
Jul-10
Oct-10
Jan-11
Apr-11
Jul-11
Oct-11
Jan-12
Apr-12
Jul-12
Oct-12
Jan-13
Apr-13
After - tax Return on Invested Capital
LABEQ DRUGS LIFE TMO
Attractive Revenue Profile
Premium life Sciences brands
Overview
• A global leader in life sciences
• 2012 Revenue: $3.8B (CAGR 23%)
• 10,000 Employees
• 50,000+ Products
43%
38%
19%
0%
Business Segments
Research Consumables
Genetic Systems
Applied Sciences
42%
29%
24%
3%2%
Geographic Segments
Americas
Europe
Asia Pacific
Other Revenue
Other Foreign
60
70
80
90
100
110
120
130
140
150
160
Apr-12May-12 Jun-12 Jul-12 Aug-12Sep-12Oct-12 Nov-12Dec-12 Jan-13 Feb-13Mar-13
1255459D Price versus Peers & Benchmark
(Normalized)
LIFE TECHNOLOGIES CORP Peer Index SPX
Attractive Fundamentals
• Life Technologies Corporation develops
biotechnology tools used by
researchers.
• Life's portfolio of products includes
technologies for capillary
electrophoresis based sequencing,
sequencing, mass spectrometry
sample preparation, and cell culture.
Industry Outlook* (Laboratory Supply Wholesaling in the US)
4MGT 6066 Fall 2016 – Corporate Restructuring
Strong economic recovery has spurred rebounds in the private sector, boosting demand for industry Products. Economic recovery is
forecast to increase revenue at an annualized rate of 0.7% to $21.3 billion during the five years to 2021.
• Greater competition will also spur
companies to hire more employees
during the five years to
2021. Over the five-year period,
industry employment is forecast to
increase at an annualized rate of
0.7% to 32,408 employees.
• An estimated 17.5% of biotech
revenueis devoted to R&D, and
growing demand in this field is
anticipatedto leadto revenue growth
forthe Laboratory
• During the five years to 2021,
IBISWorld forecasts that the industry
will continue to undergo restructuring
and acquisitions, with the number of
industry enterprises falling at an
annualized rate of 0.2% to 2,507
companies during the five-year
period.
*IBISWorld Industry report
Proposed Transaction Summary*
5MGT 6066 Fall 2016 – Corporate Restructuring
STRUCTURE
CONSIDERATION*
IMPLIED LIFE PRICE
PER SHARE
PREMIUM
ANTICIPATED
CLOSING
• All cash deal
• ThermoFisher will also take Life Technologies’ debt of $2.2B
• Total consideration of $16.3B
• Implied price per fully diluted share = $76
• Announced April 2013
• Anticipated closing early 2014 contingent upon regulatory approval
• At announcement, Life’s shares trading at $68
• Premium at announcement : 12%
*From investors relation presentation
Transaction Rationale
6MGT 6066 Fall 2016 – Corporate Restructuring
• Strengthens technology and innovation leadership through complementary offerings that broaden ThermoFisher’s
industry-leading portfolio
 Life’s extensive offering of consumables for genomics, and molecular and cell biology and is well-known for its next-
generation sequencing capability,
 Life’s technologies for bio-production and forensics applications.
 New opportunities to support the convergence of life sciences tools and diagnostics.
• Creates the ultimate customer partner, enhancing ThermoFisher commercial strength and global reach
 Life transacts more than half of its orders online through a highly regarded e-commerce platform.
 This leading capability, combined with ThermoFisher extensive research and healthcare customer channels, creates a
world-class commercial infrastructure.
 The combined company will also build on its strong foothold in Asia-Pacific, particularly in China, to meet increasing
customer demand in life sciences and healthcare.
• Creates compelling value for shareholders, with attractive financial returns and new growth opportunities
 Opportunity for $275 million of adjusted operating income synergies in year three following the close, consisting of $250
million of cost synergies and $25 million of revenue synergies.
 Transaction expected to be significantly and immediately accretive to adjusted EPS.
Target & Acquirer - standalone valuation
7MGT 6066 Fall 2016 – Corporate Restructuring
• Price Range/share: $60 to $90
• LIFE is fair valued in the market
• Premium paid for the acquisition is
reasonable
• Price Range/share: $100 to $127
• ThermoFisher is priced at the lower end,
leaving opportunities for significant
upside.
• Equity deal likely to be attractive.
Comparable Transactions Multiples
8MGT 6066 Fall 2016 – Corporate Restructuring
• LIFE is receptive to acquisition, as evident
in it hiring IB firm in Jan 2013
• Lower than median comparable deal
multiples is possibly due to the FRIENDLY
nature of the transaction.
• Deal Comp Multiples indicate that the
transaction value of this deal is FAIR.
Target Company Announcement Date
Total Value
($. Million) EBITDA EBIT Revenue Total Assets Book Value
Enterprise
Value
Cytyc Corp May 20, 2007 5657.65 22.17x 26.35x 8.89x 3.91x 7.87x 1.35x
Gen-Probe Inc April 30, 2012 3757.47 19.40x 25.56x 6.41x 3.43x 5.04x 1.31x
Immucor Inc July 5, 2011 1645.65 11.41x 13.06x 4.94x 2.60x 2.89x --
BioVeris Corp April 4, 2007 538.01 -- 22.36x 6.69x 8.99x 1.65x
Cytyc Prenatal Products Corp February 12, 2007 343.03 220.46x 256.76x 6.60x 2.96x 3.20x 1.59x
IRIS International Inc September 17, 2012 332.72 27.69x 50.25x 2.73x 2.88x 3.53x 1.93x
Cholestech Corp June 4, 2007 246.11 17.34x 21.03x 3.54x 2.44x 2.61x 1.13x
Trividia Health Inc February 3, 2010 188.41 15.72x 34.65x 1.55x 1.31x 1.67x 2.04x
Life Technologies April 15, 2013 15402.34 13.20x 20.93x 4.03x 1.80x 3.29x 1.17x
Median 440.52 19.40x 26.35x 5.67x 2.92x 3.37x 1.59x
Average 1588.63 47.74x 61.09x 7.13x 3.28x 4.48x 1.57x
Min 188.41 11.41x 13.06x 1.55x 1.31x 1.67x 1.13x
Max 5657.65 220.46x 256.76x 22.36x 6.69x 8.99x 2.04x
Transaction Value /
TRAILING 12 MONTHS
Target Company Announcement Date
Total Value
($. Million) EBITDA EBIT Revenue
FTM Net
Income
FTM Free
Cash
Cytyc Corp May 20, 2007 5657.65 -- -- -- -- --
Kyphon Americas Inc July 27, 2007 3812.84 26.22x 34.35x 6.55x 62.37x --
Gen-Probe Inc April 30, 2012 3757.47 17.24x 23.78x 5.86x 31.65x 26.39x
Immucor Inc July 5, 2011 1645.65 -- -- -- -- --
BioVeris Corp April 4, 2007 538.01 -- -- -- -- --
Cytyc Prenatal Products Corp February 12, 2007 343.03 -- -- -- -- --
IRIS International Inc September 17, 2012 332.72 23.77x -- 2.58x 59.10x 94.53x
Cholestech Corp June 4, 2007 246.11 -- -- 3.16x 27.62x --
Trividia Health Inc February 3, 2010 188.41 12.31x 22.38x 1.49x 37.24x --
Life Technologies April 15, 2013 15402.3 11.02x 13.76x 3.92x 17.36x 16.19x
Median 440.52 20.51x 23.78x 3.16x 37.24x 60.46x
Average 1588.63 19.89x 26.84x 3.93x 43.59x 60.46x
Min 188.41 12.31x 22.38x 1.49x 27.62x 26.39x
Max 5657.65 26.22x 34.35x 6.55x 62.37x 94.53x
FOWARD 12 MONTHS
Transaction Value /
Transaction Scenarios – Accretion/Dilution Analysis* (Base Case – 100% cash deal) – As Announced
9MGT 6066 Fall 2016 – Corporate Restructuring
Purchase of Equity 13,283.20$
- Cash & Equivalents 277.90$
+ Preferred Equity -$
+ Minority Interest 0.70$
+ Total Debt 2,397.00$
= Total 15,403.10$
Uses (in Millions)
Common Stock -$
+ Transaction Financing 13,283.20$
- Cash & Equivalents 277.90$
+ Preferred Equity -$
+ Minority Interest 0.70$
+ Total Debt 2,397.00$
= Total 15,403.10$
Sources (in Millions)
Deal Size/Multiples Target @ Deal Price Target Acquirer
Price +12.0% 76.13 68 79.59
Equity Value (million) 13,283.20$ 11,864.70$ 28,787.70$
Enterprise Value (million) 15,403.10$ 13,984.60$ 34,897.80$
P/E FTM 2013 (estimated) 18.1x 16.2x 14.7x
P/E FTM 2014 (estimated) 16.9x 15.1x 11.4x
EV/EBITDA CY2013 12.6x 11.4x 12.5x
EV/EBITDA CY2014 11.8x 10.8x 8.6x
Pro Forma Acquirer Proforma Target Acquirer
CY2013 EPS Acc +30.6% 7.08 4.21 5.42
P/E required to maintain share price 11.2x 16.2x 14.7x
Additional Synergies to break even (million) (666.90)$
CY2014 EPS Acc +25.9% 8.76 4.50 6.96
P/E required to maintain share price 9.1x 15.1x 11.4x
Additional Synergies to break even (million) (723.10)$
Net Leverage (Net Debt/TTM EBITDA) +3.6x 6.0x 2.0x 2.4x
Equity Ownership by Target Holders 0.0%
• Highly Accretive
• Credit Rating might be a concern
• Expect credit rating agencies place TMO’s bonds under credit watch or
even downgrade due to increased leverage ratio
Assumptions
• Cash / Share: $76.13
• Exchange Ratio: 0.0
• Cost of Debt: 3.0%
• Margin Tax: 10%
• Synergies: $250 million
*As per Bloomberg M&A estimates
Transaction Scenarios – Accretion/Dilution Analysis* (Scenario - 100% stock deal) –
Unlikely
10MGT 6066 Fall 2016 – Corporate Restructuring
Assumptions
• Cash / Share: $0.00
• Exchange Ratio: 0.96
• Cost of Debt: 3.0%
• Margin Tax: 10%
• Synergies: $250 million
Deal Size/Multiples Target @ Deal Price Target Acquirer
Price +12.4% 76.41 68 79.59
Equity Value (million) 13,331.50$ 11,864.70$ 28,787.70$
Enterprise Value (million) 15,451.30$ 13,984.60$ 34,897.80$
P/E FTM 2013 (estimated) 18.2x 16.2x 14.7x
P/E FTM 2014 (estimated) 17.0x 15.1x 11.4x
EV/EBITDA CY2013 12.6x 11.4x 12.5x
EV/EBITDA CY2014 11.9x 10.8x 8.6x
Pro Forma Acquirer Proforma Target Acquirer
CY2013 EPS Acc +1.8% 5.52 4.21 5.42
P/E required to maintain share price 11.2x 16.2x 14.7x
Additional Synergies to break even (million) (666.90)$
CY2014 EPS Dil -4.2% 6.66 4.50 6.96
P/E required to maintain share price 11.9x 15.1x 11.4x
Additional Synergies to break even (million) 173.10$
Net Leverage (Net Debt/TTM EBITDA) -0.1x 2.3x 2.0x 2.4x
Equity Ownership by Target Holders 31.7%
• Highly Dilutive
• Will be difficult to obtain acquirer shareholder approval
• Attractive for target shareholder due to estimated TMO’s upside potential
Purchase of Equity 13,331.50$
- Cash & Equivalents 277.90$
+ Preferred Equity -$
+ Minority Interest 0.70$
+ Total Debt 2,397.00$
= Total 15,451.30$
Uses (in Millions)
Common Stock 13,331.50$
+ Transaction Financing -$
- Cash & Equivalents 277.90$
+ Preferred Equity -$
+ Minority Interest 0.70$
+ Total Debt 2,397.00$
= Total 15,451.30$
Sources (in Millions)
*As per Bloomberg M&A estimates
Transaction Scenarios – Accretion/Dilution Analysis* (Scenario– 50% cash & 50% stock deal)
11MGT 6066 Fall 2016 – Corporate Restructuring
Assumptions
• Cash / Share: $38.00
• Exchange Ratio: 0.48
• Cost of Debt: 3.0%
• Margin Tax: 10%
• Synergies: $250 million
Deal Size/Multiples Target @ Deal Price Target Acquirer
Price +12.1% 76.20 68 79.59
Equity Value (million) 13,296.00$ 11,864.70$ 28,787.70$
Enterprise Value (million) 15,415.90$ 13,984.60$ 34,897.80$
P/E FTM 2013 (estimated) 18.1x 16.2x 14.7x
P/E FTM 2014 (estimated) 16.9x 15.1x 11.4x
EV/EBITDA CY2013 12.6x 11.4x 12.5x
EV/EBITDA CY2014 11.9x 10.8x 8.6x
Pro Forma Acquirer Proforma Target Acquirer
CY2013 EPS Acc +13.5% 6.15 4.21 5.42
P/E required to maintain share price 12.9x 16.2x 14.7x
Additional Synergies to break even (million) (362.10)$
CY2014 EPS Acc +8.0% 7.52 4.50 6.96
P/E required to maintain share price 10.6x 15.1x 11.4x
Additional Synergies to break even (million) (275.00)$
Net Leverage (Net Debt/TTM EBITDA) +1.7x 4.1x 2.0x 2.4x
Equity Ownership by Target Holders 18.8%
• Moderately Accretive
• Moderate impact on credit rating
• Will be difficult to obtain acquirer shareholder approval
• Attractive for target shareholder due to estimated TMO’s upside potential
Purchase of Equity 13,296.00$
- Cash & Equivalents 277.90$
+ Preferred Equity -$
+ Minority Interest 0.70$
+ Total Debt 2,397.00$
= Total 15,451.90$
Uses (in Millions)
Common Stock 6,665.70$
+ Transaction Financing 6,630.30$
- Cash & Equivalents 277.90$
+ Preferred Equity -$
+ Minority Interest 0.70$
+ Total Debt 2,397.00$
= Total 15,451.90$
Sources (in Millions)
*As per Bloomberg M&A estimates
Transaction Scenarios – Accretion/Dilution Analysis* (Reverse Scenario) – IMAGINARY
12MGT 6066 Fall 2016 – Corporate Restructuring
Assumptions
• Cash / Share: $60.00
• Exchange Ratio: 0.43
• Cost of Debt: 2.3%
• Margin Tax: 18.3%
• Synergies: $250 million
• Price Premium: +12.1%
What if Life Tech tries to acquire ThermoFisher?
Purchase of Equity 32,278.10$
- Cash & Equivalents 1,008.30$
+ Preferred Equity -$
+ Minority Interest -$
+ Total Debt 7,118.40$
= Total 38,388.20$
Uses (in Millions)
Common Stock 10,576.10$
+ Transaction Financing 21,702.00$
- Cash & Equivalents 1,008.00$
+ Preferred Equity -$
+ Minority Interest -$
+ Total Debt 7,118.40$
= Total 38,388.20$
Sources (in Millions)
Deal Size/Multiples Target @ Deal Price Target Acquirer
Price +12.1% 89.24 79.59 68
Equity Value (million) 32,278.10$ 28,787.70$ 11,864.70$
Enterprise Value (million) 38,388.20$ 34,897.80$ 13,984.60$
P/E FTM 2013 (estimated) 16.5x 14.7x 16.2x
P/E FTM 2014 (estimated) 12.8x 11.4x 15.1x
EV/EBITDA CY2013 13.8x 12.5x 11.4x
EV/EBITDA CY2014 9.5x 8.6x 10.8x
Pro Forma Acquirer Proforma Target Acquirer
CY2013 EPS Acc +79.4% 7.55 5.42 4.21
P/E required to maintain share price 9.0x 14.7x 16.2x
Additional Synergies to break even (million) (1,349.70)$
CY2014 EPS Acc +108.8% 9.39 6.96 4.50
P/E required to maintain share price 7.2x 11.4x 15.1x
Additional Synergies to break even (million) (1,976.30)$
Net Leverage (Net Debt/TTM EBITDA) +6.4x 8.4x 2.4x 2.0x
Equity Ownership by Target Holders 47.1%
*As per Bloomberg M&A estimates
Enhanced Financial Scale and Market Position
13MGT 6066 Fall 2016 – Corporate Restructuring
Combination increases ThermoFisher’s scale and efficiency, driving meaningful value to stockholders.
2014 Revenues
2014 EBITDA
12/31/2014 Debt
THERMO FISHER LIFE TECH Combined with Synergies
Debt / EBITDA (x)
$12,644.6 million
29.0 YoY Growth (%)
$3,892.0 million
24.0 YoY Growth (%)
$7,118.4 million
3.2x
$3,821.9 million
2.9 YoY Growth (%)
$1,494.4 million
32.9 YoY Growth (%)
$2,400 million
2.2x
$16,466.5 million
29.0 YoY Growth (%)
$5386.4 million
24.0 YoY Growth (%)
$12,500 million
4.5x
Enhanced Market Position
14MGT 6066 Fall 2016 – Corporate Restructuring
Combined companies create greater financial value, drive greater market efficiencies and remain nimble to better capitalize on international
market opportunities
NET REVENUE – 2014 ($ in millions)
EBITDA – 2014 ($ in millions)
$-
$5,000.00
$10,000.00
$15,000.00
$20,000.00
Thermo Fisher Life
Technologies
Illumina Inc Agilent
Technologies
Waters Corp Mettler-Toledo Bruker Corp VWR Corp ABAXIS Inc Haemonetics
Corp
Perkin Elmer
Inc
$-
$1,000.00
$2,000.00
$3,000.00
$4,000.00
$5,000.00
Thermo Fisher Life
Technologies
Illumina Inc Agilent
Technologies
Waters Corp Mettler-Toledo Bruker Corp VWR Corp ABAXIS Inc Haemonetics
Corp
Perkin Elmer
Inc
Regulatory and Competitive Consideration
Competition enforcement agencies around the world reviewed this transaction and brought
up the following risks of a less competitive market. (US, Australia, Canada, China,
European Union, Japan, and Korea)
ThermoFisher post merger market share:
• Greater than 50% of the worldwide market for individual siRNA reagents
• Greater 90% of the market for siRNA reagent libraries.
• Greater 50% share of the worldwide market for cell culture media
• Approximately 60% of the market for cell culture sera.
15MGT 6066 Fall 2016 – Corporate Restructuring
BUSINESS DESCRIPTION
Cell Culture Serums and cell growth media for live cell cultures
Gene Modulation siRNAs, shRNAs, and purification kits to isolate DNA and RNA
Magnetic beads Beads for isolating nucleic acids
SATISFYING REGULATORS
ThermoFisher sells 3 business to GE for $1.1 billion
TOTAL 2013 SALES = $250 MILLION
Competing Bids
Life Tech chose Thermo over Sigma-Aldrich Corp, a maker of chemicals for research laboratories, and a
private equity consortium consisting of Blackstone Group, Carlyle Group, KKR & Co and Temasek
Holdings.
16MGT 6066 Fall 2016 – Corporate Restructuring
Offer from consortium of PE firms
Offer from competitors
The private equity consortium raised its offer on the
Friday before the deal was announced from $65 to
about $67 per share (roughly $11 billion), short
of ThermoFisher's bid.
Life Technologies had sought a higher price
from bidders after receiving committed offers.
"Life is a company with nearly 85% recurring
revenues, has the highest operating margins among
its peers, and is a free-cash-flow machine,"
Jonathan Groberg,
Analyst, Macquarie Capital Inc.
TMO - Proven Ability to Deliver Growth
• Sales in 2012 were $12.51 billion, increase of $951
million from 2011. The increase was due to
acquisitions, including Phadia® and Dionex®, and
higher sales at existing businesses.
• Demand from customers in academic and
government markets slowed. Expected weakness in
academic and government markets in near term due
to uncertainty in the government funding
expectations in the US and Europe
• TMO’s strategy to augment internal growth at
existing businesses with complementary
acquisitions seems to have paid off well.
Example
One Lambda, a provider of transplant
diagnostics, was acquired in Sep 2012
to enhance the company’s presence in
specialty in vitro diagnostics and add
new capabilities to the company’s
transplant – testing workflow.
17
Full Year 2008– 2012 EPS Growth
-
0.50
1.00
1.50
2.00
2.50
3.00
3.50
4.00
FY 2008 FY 2009 FY 2010 FY 2011 FY 2012
Diluted EPS
MGT 6066 Fall 2016 – Corporate Restructuring
0.0%
2.0%
4.0%
6.0%
8.0%
10.0%
12.0%
14.0%
16.0%
FY 2008 FY 2009 FY 2010 FY 2011 FY 2012
Free Cash Flow Margin
Full Year FCF Margin 2008– 2012
Proven Ability to Deliver Productivity Efficiency
• In 2012, total company operating income and
operating income margin were $1.48 billion and
11.8%, respectively, compared with $1.25 billion and
10.8%, respectively, in 2011. The increase in
operating income was primarily due to profit on
incremental sales from acquisitions and existing
businesses
• $67 million of cash restructuring costs primarily for
continued headcount reductions and facility
consolidations in an effort to streamline operations,
including severance to reduce headcount at several
businesses and abandoned facility expenses at
businesses that have been or are being
consolidated, such as the consolidation of several
facilities in the U.S. and Europe.
• Return on Capital and Return on Assets is expected
to improve once post merger integration (Phadia,
One Lambda and Dionex) activities are completed.
18
Efficiency Metrics
MGT 6066 Fall 2016 – Corporate Restructuring
17.0%
17.5%
18.0%
18.5%
19.0%
19.5%
20.0%
FY 2008 FY 2009 FY 2010 FY 2011 FY 2012
EBITDA Margin
0.0%
1.0%
2.0%
3.0%
4.0%
5.0%
6.0%
7.0%
8.0%
FY 2008 FY 2009 FY 2010 FY 2011 FY 2012
Return on Capital
5.1x
5.1x
5.2x
5.2x
5.3x
5.3x
5.4x
5.4x
5.5x
5.5x
FY 2008 FY 2009 FY 2010 FY 2011 FY 2012
Inventory Turnover
0.0%
1.0%
2.0%
3.0%
4.0%
5.0%
6.0%
FY 2008 FY 2009 FY 2010 FY 2011 FY 2012
Return on Assets
THERMO FISHER’s Successful Acquisition Track Record
19MGT 6066 Fall 2016 – Corporate Restructuring
PHADIA
DIONEX
ONE LAMBDA
• Enhances ThermoFisher's leadership position in high growth, high margin specialty diagnostics
• Accelerates growth opportunities for Phadia
• Expected to be immediately accretive to adjusted EPS; generates revenue, cost & tax synergies
• PHADIA expected to increase 2011 revenue by $190 M and improve EPS by $0.07
• Sales in 2012 improved by $951M in 2012 and by $262M in 2011
• Increase ThermoFisher's footprint in growing Asia-Pacific market
• Improve performance & productivity for customers
• Expected to be accretive to adjusted EPS by $0.13 to $0.15 in first 12 months post close and expected to
generate $60 million in total operating synergies in year three
• Sales in 2012 improved by $951M in 2012 and by $262M in 2011
• Enhances ThermoFisher’s Presence in Specialty in vitro Diagnostics
• Creates Opportunities to Leverage ThermoFisher’s Commercial Infrastructure in Emerging Markets
• Upon close the transaction is expected to improve adjusted EPS by $0.09 to $0.11 per share
• Transaction was expected to generate revenue and cost synergies to improve operating income by $15M
• Transaction resulted in annual cost saving of $85M in 2013
20MGT 6066 Fall 2016 – Corporate Restructuring
Analyst Reaction
“We believe TMO remains well-positioned as a stand-alone entity, and LIFE is a “nice to have”
rather than a “must have,” we remain constructive on the potential for a deal for TMO.
Tycho W. Peterson, J P Morgan
 TMO remains the most likely acquirer, in our view... according to press reports, TMO was the only strategic bidder for LIFE, and
bid higher than private equity. While we expect TMO’s bid to include equity (so that the company can stay in its leverage comfort
range), a higher bid that includes equity that is likely to appreciate should be easily superior to a lower cash offer.
 …as a potential deal could be highly accretive… we could easily see >$500M of operating income synergies over time, with
overlapping sales channels, G&A functions, and LIFE’s overspending on R&D being low-hanging fruit. It should also be noted that
LIFE’s >1,000bp higher tax rate represents a significant source of potential net income synergies over time, in our view. With this in
mind, we believe it is not difficult to see >10% ROIC on a LIFE acquisition around $70, which should bolster the case for TMO as a
strong cash generator with improving returns.
 …but we would expect TMO to under-promise and over-deliver. If/when a deal is announced, we believe that TMO is likely to
under-promise on synergies and accretion, consistent with the company's track record of being conservative with guidance over the
last year, and setting up a multi-year beat-and-raise story. While it is possible to see FY14 accretion as much as $1 in EPS (~17%), it
is far more likely that initial expectations could be for half this amount, in our view.
 Thoughts on antitrust. While it is not uncommon for deals in this highly technical industry to receive second requests in the U.S.
(and it seems the revenue threshold would almost certainly require a China review), we believe that antitrust approval would
eventually be granted without any material effect on the business. If divestitures are required in the small parts of the business that
do overlap (PCR, parts of bio production), we find it difficult to see much north of 1% of the combined total revenue.
Event Studies
21MGT 6066 Fall 2016 – Corporate Restructuring
-4.00%
-2.00%
0.00%
2.00%
4.00%
6.00%
8.00%
CAR before
investment firm
was hired
CAR after
investment firm
was hired
CAR before deal
announcement
CAR after deal
announcement
Cumulative Abnormal Return (TMO)
1 Day 10 Days 40 Days
0.00%
2.00%
4.00%
6.00%
8.00%
10.00%
12.00%
14.00%
16.00%
CAR before
investment firm was
hired
CAR after
investment firm was
hired
CAR before deal
announcement
CAR after deal
announcement
Cumulative Abnormal Return (LIFE)
1 Day 10 Days 40 Days
DATE EVENT
LIFE previous day closing price
(Trading Volume)
LIFE same day closing price
(Trading Volume)
THERMO previous day closing price
(Trading Volume)
THERMO same day closing price
(Trading Volume)
$54.97 $60.79 $68.93 $69.40
(2,866,092) (16,500,554) (1,836,400) (1,738,400)
$68.23 $73.50 $79.59 $78.58
(3,253,850) (46,272,855) (2,325,200) (14,442,500)
18-Jan-13
LIFE hires two investment
firms
15-Apr-13
THERMO deal
announced
Post Deal Announcement
22MGT 6066 Fall 2016 – Corporate Restructuring
Approval by
Target &
Acquirer
board of
directors
Approval by
LIFE
shareholders
Approval by
European
Commission
Approval by
Australian
Competition
& Consumer
Commission
Approval by
Chinese
Ministry of
Commerce
Approval
by Federal
Trade
Commission
04/15/13 08/21/13 11/26/13 12/19/13 01/15/14 01/15/14
02/03/14
Deal
Completion
Closing Thoughts*
23MGT 6066 Fall 2016 – Corporate Restructuring
From ThermoFisher’s 2015 10K ….
• Sales in the Life Sciences Solutions segment increased $244 million to $4.44 billion in 2015 primarily due to the acquisition of Life Technologies, net of
divestitures. The increase in pro forma revenue at existing businesses was primarily due to increased demand for bioprocess production products as well as
biosciences products.
• During 2015 , the company’s cash flow from operations totaled $2.82 billion compared with $2.62 billion for 2014 . The increase resulted from cash
disbursements in the 2014 period totaling $325 million related to the acquisition of Life Technologies, including severance obligations, third-party
transaction/integration costs and monetizing certain equity awards held by Life Technologies employees at the date of acquisition.
• In addition, the company recorded $82 million of cash restructuring costs primarily for actions to achieve synergies from the Life Technologies acquisition.
• The company’s effective tax rate was 9.2% in 2014. Aside from the discrete tax on the divestiture, the company had a benefit from income taxes primarily due to
restructuring and other costs associated with the acquisition of Life Technologies.
0.00%
20.00%
40.00%
60.00%
2012 2013 2014 2015
2 Year Performance Post Acquisition
% of Total Revenue Total Revenue Growth
Division Revenue Growth EPS Growth
0
5
10
15
20
2012 2013 2014 2015
Life Science Division Total revenue
Revenue ($, billion)
*From ThermoFisher’s 2015 10K statement

More Related Content

What's hot

iSPORTiSTiCS investment opportunity 2020
iSPORTiSTiCS investment opportunity 2020iSPORTiSTiCS investment opportunity 2020
iSPORTiSTiCS investment opportunity 2020Vinicius Gholmie
 
Active Share and Product Pairs Analysis
Active Share and Product Pairs AnalysisActive Share and Product Pairs Analysis
Active Share and Product Pairs AnalysisCallan
 
Diagnostics Market Disruption HIDA final
Diagnostics Market Disruption HIDA finalDiagnostics Market Disruption HIDA final
Diagnostics Market Disruption HIDA finalHidee Cyd
 
Dividend weekly 31 2013 By http://long-term-investments.blogspot.com
Dividend weekly 31 2013 By http://long-term-investments.blogspot.comDividend weekly 31 2013 By http://long-term-investments.blogspot.com
Dividend weekly 31 2013 By http://long-term-investments.blogspot.comDividend Yield
 

What's hot (6)

Presentation
PresentationPresentation
Presentation
 
mba 599- pfizer
mba 599- pfizermba 599- pfizer
mba 599- pfizer
 
iSPORTiSTiCS investment opportunity 2020
iSPORTiSTiCS investment opportunity 2020iSPORTiSTiCS investment opportunity 2020
iSPORTiSTiCS investment opportunity 2020
 
Active Share and Product Pairs Analysis
Active Share and Product Pairs AnalysisActive Share and Product Pairs Analysis
Active Share and Product Pairs Analysis
 
Diagnostics Market Disruption HIDA final
Diagnostics Market Disruption HIDA finalDiagnostics Market Disruption HIDA final
Diagnostics Market Disruption HIDA final
 
Dividend weekly 31 2013 By http://long-term-investments.blogspot.com
Dividend weekly 31 2013 By http://long-term-investments.blogspot.comDividend weekly 31 2013 By http://long-term-investments.blogspot.com
Dividend weekly 31 2013 By http://long-term-investments.blogspot.com
 

Similar to Rohit Behera - M&A Work Sample - ThermoFisher Scientific acquires Life Tech

Mercer Capital's Value Focus: Medtech & Device Industry | Q4 2018
Mercer Capital's Value Focus: Medtech & Device Industry | Q4 2018 Mercer Capital's Value Focus: Medtech & Device Industry | Q4 2018
Mercer Capital's Value Focus: Medtech & Device Industry | Q4 2018 Mercer Capital
 
Maetrics: The ROI of Good Quality & Compliance
Maetrics: The ROI of Good Quality & ComplianceMaetrics: The ROI of Good Quality & Compliance
Maetrics: The ROI of Good Quality & ComplianceGeneris
 
Financial Analysis: Whole Foods Market
Financial Analysis: Whole Foods MarketFinancial Analysis: Whole Foods Market
Financial Analysis: Whole Foods MarketBetsy Soler
 
Mercer Capital's Value Focus : Medtech and Device | Q4 2021
Mercer Capital's Value Focus : Medtech and Device | Q4 2021Mercer Capital's Value Focus : Medtech and Device | Q4 2021
Mercer Capital's Value Focus : Medtech and Device | Q4 2021Mercer Capital
 
Structural Reform for Improved Financial Performance and Innovation
Structural Reform for Improved Financial Performance and InnovationStructural Reform for Improved Financial Performance and Innovation
Structural Reform for Improved Financial Performance and Innovationaccenture
 
Why Healthcare Costing Matters to Enable Strategy and Financial Performance
Why Healthcare Costing Matters to Enable Strategy and Financial PerformanceWhy Healthcare Costing Matters to Enable Strategy and Financial Performance
Why Healthcare Costing Matters to Enable Strategy and Financial PerformanceHealth Catalyst
 
Biopharma's search for sustainable growth
Biopharma's search for sustainable growthBiopharma's search for sustainable growth
Biopharma's search for sustainable growthaccenture
 
Final_Medtronic+plc+ppt
Final_Medtronic+plc+pptFinal_Medtronic+plc+ppt
Final_Medtronic+plc+pptWill Pan
 
Madison Park Group Life Sciences Software Market Update H2 2018
Madison Park Group Life Sciences Software Market Update H2 2018Madison Park Group Life Sciences Software Market Update H2 2018
Madison Park Group Life Sciences Software Market Update H2 2018Madison Park Group
 
DuPont Presents at Jefferies 10th Annual Global Industrials Conference
DuPont Presents at Jefferies 10th Annual Global Industrials ConferenceDuPont Presents at Jefferies 10th Annual Global Industrials Conference
DuPont Presents at Jefferies 10th Annual Global Industrials ConferenceDupontInv
 
M&A Case Competition presentation
M&A Case Competition presentationM&A Case Competition presentation
M&A Case Competition presentationLu Minghui
 
Harnessing the Power of Healthcare Data: Are We There Yet
Harnessing the Power of Healthcare Data: Are We There YetHarnessing the Power of Healthcare Data: Are We There Yet
Harnessing the Power of Healthcare Data: Are We There YetHealth Catalyst
 
Ir standard-presentation-feb-2018
Ir standard-presentation-feb-2018Ir standard-presentation-feb-2018
Ir standard-presentation-feb-2018Barnes_Group
 
Ir standard presentation feb 2018
Ir standard presentation feb 2018Ir standard presentation feb 2018
Ir standard presentation feb 2018Barnes_Group
 
5 Tech Megatrends And Their Impact On Medical Technology Marketing FINAL
5 Tech Megatrends And Their Impact On Medical Technology Marketing FINAL5 Tech Megatrends And Their Impact On Medical Technology Marketing FINAL
5 Tech Megatrends And Their Impact On Medical Technology Marketing FINALJoe Morris
 

Similar to Rohit Behera - M&A Work Sample - ThermoFisher Scientific acquires Life Tech (20)

Mercer Capital's Value Focus: Medtech & Device Industry | Q4 2018
Mercer Capital's Value Focus: Medtech & Device Industry | Q4 2018 Mercer Capital's Value Focus: Medtech & Device Industry | Q4 2018
Mercer Capital's Value Focus: Medtech & Device Industry | Q4 2018
 
Maetrics: The ROI of Good Quality & Compliance
Maetrics: The ROI of Good Quality & ComplianceMaetrics: The ROI of Good Quality & Compliance
Maetrics: The ROI of Good Quality & Compliance
 
Spirax sarco engineering
Spirax sarco engineeringSpirax sarco engineering
Spirax sarco engineering
 
Financial Analysis: Whole Foods Market
Financial Analysis: Whole Foods MarketFinancial Analysis: Whole Foods Market
Financial Analysis: Whole Foods Market
 
Mercer Capital's Value Focus : Medtech and Device | Q4 2021
Mercer Capital's Value Focus : Medtech and Device | Q4 2021Mercer Capital's Value Focus : Medtech and Device | Q4 2021
Mercer Capital's Value Focus : Medtech and Device | Q4 2021
 
Structural Reform for Improved Financial Performance and Innovation
Structural Reform for Improved Financial Performance and InnovationStructural Reform for Improved Financial Performance and Innovation
Structural Reform for Improved Financial Performance and Innovation
 
2016 11 21 neo company overview presentation
2016 11 21   neo company overview presentation2016 11 21   neo company overview presentation
2016 11 21 neo company overview presentation
 
Why Healthcare Costing Matters to Enable Strategy and Financial Performance
Why Healthcare Costing Matters to Enable Strategy and Financial PerformanceWhy Healthcare Costing Matters to Enable Strategy and Financial Performance
Why Healthcare Costing Matters to Enable Strategy and Financial Performance
 
Biopharma's search for sustainable growth
Biopharma's search for sustainable growthBiopharma's search for sustainable growth
Biopharma's search for sustainable growth
 
Final_Medtronic+plc+ppt
Final_Medtronic+plc+pptFinal_Medtronic+plc+ppt
Final_Medtronic+plc+ppt
 
Madison Park Group Life Sciences Software Market Update H2 2018
Madison Park Group Life Sciences Software Market Update H2 2018Madison Park Group Life Sciences Software Market Update H2 2018
Madison Park Group Life Sciences Software Market Update H2 2018
 
Stryker Financial Analysis
Stryker Financial AnalysisStryker Financial Analysis
Stryker Financial Analysis
 
DuPont Presents at Jefferies 10th Annual Global Industrials Conference
DuPont Presents at Jefferies 10th Annual Global Industrials ConferenceDuPont Presents at Jefferies 10th Annual Global Industrials Conference
DuPont Presents at Jefferies 10th Annual Global Industrials Conference
 
M&A Case Competition presentation
M&A Case Competition presentationM&A Case Competition presentation
M&A Case Competition presentation
 
IntegrtdAppro-GlblSuppChnTrans-Final-v2a
IntegrtdAppro-GlblSuppChnTrans-Final-v2aIntegrtdAppro-GlblSuppChnTrans-Final-v2a
IntegrtdAppro-GlblSuppChnTrans-Final-v2a
 
Harnessing the Power of Healthcare Data: Are We There Yet
Harnessing the Power of Healthcare Data: Are We There YetHarnessing the Power of Healthcare Data: Are We There Yet
Harnessing the Power of Healthcare Data: Are We There Yet
 
Ir standard-presentation-feb-2018
Ir standard-presentation-feb-2018Ir standard-presentation-feb-2018
Ir standard-presentation-feb-2018
 
Ir standard presentation feb 2018
Ir standard presentation feb 2018Ir standard presentation feb 2018
Ir standard presentation feb 2018
 
5 Tech Megatrends And Their Impact On Medical Technology Marketing FINAL
5 Tech Megatrends And Their Impact On Medical Technology Marketing FINAL5 Tech Megatrends And Their Impact On Medical Technology Marketing FINAL
5 Tech Megatrends And Their Impact On Medical Technology Marketing FINAL
 
Blair 2018
Blair 2018Blair 2018
Blair 2018
 

Rohit Behera - M&A Work Sample - ThermoFisher Scientific acquires Life Tech

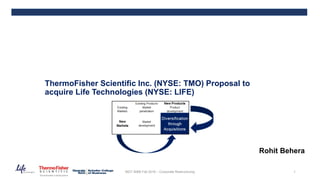
  • 1. ThermoFisher Scientific Inc. (NYSE: TMO) Proposal to acquire Life Technologies (NYSE: LIFE) Rohit Behera 1MGT 6066 Fall 2016 – Corporate Restructuring
  • 2. Acquisition of BRAHMS • Leading provider of specialty in- vitro diagnostic tests • Integrated in the specialty diagnostics division Acquisition of PHADIA • Global leader in blood tests • Integrated in the specialty diagnostics division • EPS rose by 35.8% Acquisition of DIONEX • Leading manufacturer and marketer of chromatography systems • Integrated in the analytical technologies segment • Revenues rose by 4% ThermoFisher Scientific (Acquirer) (NYSE: TMO) 2MGT 6066 Fall 2016 – Corporate Restructuring Overview • World leader in serving science • 39,000 Employees • 2012 Revenue: $12.0B • Supplies to pharmaceutical and biotech companies, hospitals and clinical diagnostic labs, universities, research institutions, and government agencies Acquisition of ONE LAMBDA Inc. • Global leader in transplant diagnostics • Integrated in the specialty diagnostics division 2013 2012 2011 2010 2009 Proven Track Record of Acquisitions 37% 24% 18% 18% -3% Business Segments Laboratory Products and Services Life Sciences Solutions Speciality Diagnostics Analytical Technologies Eliminations 51% 31% 8% 5% 5% Geographic Segments United States Other China Germany United Kingdom Acquisition of Life Technologies
  • 3. LIFE TECHNOLOGIES INC. (Target) (NYSE: 1255459D) 3MGT 6066 Fall 2016 – Corporate Restructuring 0 0.05 0.1 0.15 0.2 0.25 0.3 0.35 0.4 Jan-08 Apr-08 Jul-08 Oct-08 Jan-09 Apr-09 Jul-09 Oct-09 Jan-10 Apr-10 Jul-10 Oct-10 Jan-11 Apr-11 Jul-11 Oct-11 Jan-12 Apr-12 Jul-12 Oct-12 Jan-13 Apr-13 Cash Flow to Total Debt LABEQ DRUGS LIFE TMO 0 0.02 0.04 0.06 0.08 0.1 0.12 0.14 0.16 0.18 0.2 Jan-08 Apr-08 Jul-08 Oct-08 Jan-09 Apr-09 Jul-09 Oct-09 Jan-10 Apr-10 Jul-10 Oct-10 Jan-11 Apr-11 Jul-11 Oct-11 Jan-12 Apr-12 Jul-12 Oct-12 Jan-13 Apr-13 After - tax Return on Invested Capital LABEQ DRUGS LIFE TMO Attractive Revenue Profile Premium life Sciences brands Overview • A global leader in life sciences • 2012 Revenue: $3.8B (CAGR 23%) • 10,000 Employees • 50,000+ Products 43% 38% 19% 0% Business Segments Research Consumables Genetic Systems Applied Sciences 42% 29% 24% 3%2% Geographic Segments Americas Europe Asia Pacific Other Revenue Other Foreign 60 70 80 90 100 110 120 130 140 150 160 Apr-12May-12 Jun-12 Jul-12 Aug-12Sep-12Oct-12 Nov-12Dec-12 Jan-13 Feb-13Mar-13 1255459D Price versus Peers & Benchmark (Normalized) LIFE TECHNOLOGIES CORP Peer Index SPX Attractive Fundamentals • Life Technologies Corporation develops biotechnology tools used by researchers. • Life's portfolio of products includes technologies for capillary electrophoresis based sequencing, sequencing, mass spectrometry sample preparation, and cell culture.
  • 4. Industry Outlook* (Laboratory Supply Wholesaling in the US) 4MGT 6066 Fall 2016 – Corporate Restructuring Strong economic recovery has spurred rebounds in the private sector, boosting demand for industry Products. Economic recovery is forecast to increase revenue at an annualized rate of 0.7% to $21.3 billion during the five years to 2021. • Greater competition will also spur companies to hire more employees during the five years to 2021. Over the five-year period, industry employment is forecast to increase at an annualized rate of 0.7% to 32,408 employees. • An estimated 17.5% of biotech revenueis devoted to R&D, and growing demand in this field is anticipatedto leadto revenue growth forthe Laboratory • During the five years to 2021, IBISWorld forecasts that the industry will continue to undergo restructuring and acquisitions, with the number of industry enterprises falling at an annualized rate of 0.2% to 2,507 companies during the five-year period. *IBISWorld Industry report
  • 5. Proposed Transaction Summary* 5MGT 6066 Fall 2016 – Corporate Restructuring STRUCTURE CONSIDERATION* IMPLIED LIFE PRICE PER SHARE PREMIUM ANTICIPATED CLOSING • All cash deal • ThermoFisher will also take Life Technologies’ debt of $2.2B • Total consideration of $16.3B • Implied price per fully diluted share = $76 • Announced April 2013 • Anticipated closing early 2014 contingent upon regulatory approval • At announcement, Life’s shares trading at $68 • Premium at announcement : 12% *From investors relation presentation
  • 6. Transaction Rationale 6MGT 6066 Fall 2016 – Corporate Restructuring • Strengthens technology and innovation leadership through complementary offerings that broaden ThermoFisher’s industry-leading portfolio  Life’s extensive offering of consumables for genomics, and molecular and cell biology and is well-known for its next- generation sequencing capability,  Life’s technologies for bio-production and forensics applications.  New opportunities to support the convergence of life sciences tools and diagnostics. • Creates the ultimate customer partner, enhancing ThermoFisher commercial strength and global reach  Life transacts more than half of its orders online through a highly regarded e-commerce platform.  This leading capability, combined with ThermoFisher extensive research and healthcare customer channels, creates a world-class commercial infrastructure.  The combined company will also build on its strong foothold in Asia-Pacific, particularly in China, to meet increasing customer demand in life sciences and healthcare. • Creates compelling value for shareholders, with attractive financial returns and new growth opportunities  Opportunity for $275 million of adjusted operating income synergies in year three following the close, consisting of $250 million of cost synergies and $25 million of revenue synergies.  Transaction expected to be significantly and immediately accretive to adjusted EPS.
  • 7. Target & Acquirer - standalone valuation 7MGT 6066 Fall 2016 – Corporate Restructuring • Price Range/share: $60 to $90 • LIFE is fair valued in the market • Premium paid for the acquisition is reasonable • Price Range/share: $100 to $127 • ThermoFisher is priced at the lower end, leaving opportunities for significant upside. • Equity deal likely to be attractive.
  • 8. Comparable Transactions Multiples 8MGT 6066 Fall 2016 – Corporate Restructuring • LIFE is receptive to acquisition, as evident in it hiring IB firm in Jan 2013 • Lower than median comparable deal multiples is possibly due to the FRIENDLY nature of the transaction. • Deal Comp Multiples indicate that the transaction value of this deal is FAIR. Target Company Announcement Date Total Value ($. Million) EBITDA EBIT Revenue Total Assets Book Value Enterprise Value Cytyc Corp May 20, 2007 5657.65 22.17x 26.35x 8.89x 3.91x 7.87x 1.35x Gen-Probe Inc April 30, 2012 3757.47 19.40x 25.56x 6.41x 3.43x 5.04x 1.31x Immucor Inc July 5, 2011 1645.65 11.41x 13.06x 4.94x 2.60x 2.89x -- BioVeris Corp April 4, 2007 538.01 -- 22.36x 6.69x 8.99x 1.65x Cytyc Prenatal Products Corp February 12, 2007 343.03 220.46x 256.76x 6.60x 2.96x 3.20x 1.59x IRIS International Inc September 17, 2012 332.72 27.69x 50.25x 2.73x 2.88x 3.53x 1.93x Cholestech Corp June 4, 2007 246.11 17.34x 21.03x 3.54x 2.44x 2.61x 1.13x Trividia Health Inc February 3, 2010 188.41 15.72x 34.65x 1.55x 1.31x 1.67x 2.04x Life Technologies April 15, 2013 15402.34 13.20x 20.93x 4.03x 1.80x 3.29x 1.17x Median 440.52 19.40x 26.35x 5.67x 2.92x 3.37x 1.59x Average 1588.63 47.74x 61.09x 7.13x 3.28x 4.48x 1.57x Min 188.41 11.41x 13.06x 1.55x 1.31x 1.67x 1.13x Max 5657.65 220.46x 256.76x 22.36x 6.69x 8.99x 2.04x Transaction Value / TRAILING 12 MONTHS Target Company Announcement Date Total Value ($. Million) EBITDA EBIT Revenue FTM Net Income FTM Free Cash Cytyc Corp May 20, 2007 5657.65 -- -- -- -- -- Kyphon Americas Inc July 27, 2007 3812.84 26.22x 34.35x 6.55x 62.37x -- Gen-Probe Inc April 30, 2012 3757.47 17.24x 23.78x 5.86x 31.65x 26.39x Immucor Inc July 5, 2011 1645.65 -- -- -- -- -- BioVeris Corp April 4, 2007 538.01 -- -- -- -- -- Cytyc Prenatal Products Corp February 12, 2007 343.03 -- -- -- -- -- IRIS International Inc September 17, 2012 332.72 23.77x -- 2.58x 59.10x 94.53x Cholestech Corp June 4, 2007 246.11 -- -- 3.16x 27.62x -- Trividia Health Inc February 3, 2010 188.41 12.31x 22.38x 1.49x 37.24x -- Life Technologies April 15, 2013 15402.3 11.02x 13.76x 3.92x 17.36x 16.19x Median 440.52 20.51x 23.78x 3.16x 37.24x 60.46x Average 1588.63 19.89x 26.84x 3.93x 43.59x 60.46x Min 188.41 12.31x 22.38x 1.49x 27.62x 26.39x Max 5657.65 26.22x 34.35x 6.55x 62.37x 94.53x FOWARD 12 MONTHS Transaction Value /
  • 9. Transaction Scenarios – Accretion/Dilution Analysis* (Base Case – 100% cash deal) – As Announced 9MGT 6066 Fall 2016 – Corporate Restructuring Purchase of Equity 13,283.20$ - Cash & Equivalents 277.90$ + Preferred Equity -$ + Minority Interest 0.70$ + Total Debt 2,397.00$ = Total 15,403.10$ Uses (in Millions) Common Stock -$ + Transaction Financing 13,283.20$ - Cash & Equivalents 277.90$ + Preferred Equity -$ + Minority Interest 0.70$ + Total Debt 2,397.00$ = Total 15,403.10$ Sources (in Millions) Deal Size/Multiples Target @ Deal Price Target Acquirer Price +12.0% 76.13 68 79.59 Equity Value (million) 13,283.20$ 11,864.70$ 28,787.70$ Enterprise Value (million) 15,403.10$ 13,984.60$ 34,897.80$ P/E FTM 2013 (estimated) 18.1x 16.2x 14.7x P/E FTM 2014 (estimated) 16.9x 15.1x 11.4x EV/EBITDA CY2013 12.6x 11.4x 12.5x EV/EBITDA CY2014 11.8x 10.8x 8.6x Pro Forma Acquirer Proforma Target Acquirer CY2013 EPS Acc +30.6% 7.08 4.21 5.42 P/E required to maintain share price 11.2x 16.2x 14.7x Additional Synergies to break even (million) (666.90)$ CY2014 EPS Acc +25.9% 8.76 4.50 6.96 P/E required to maintain share price 9.1x 15.1x 11.4x Additional Synergies to break even (million) (723.10)$ Net Leverage (Net Debt/TTM EBITDA) +3.6x 6.0x 2.0x 2.4x Equity Ownership by Target Holders 0.0% • Highly Accretive • Credit Rating might be a concern • Expect credit rating agencies place TMO’s bonds under credit watch or even downgrade due to increased leverage ratio Assumptions • Cash / Share: $76.13 • Exchange Ratio: 0.0 • Cost of Debt: 3.0% • Margin Tax: 10% • Synergies: $250 million *As per Bloomberg M&A estimates
  • 10. Transaction Scenarios – Accretion/Dilution Analysis* (Scenario - 100% stock deal) – Unlikely 10MGT 6066 Fall 2016 – Corporate Restructuring Assumptions • Cash / Share: $0.00 • Exchange Ratio: 0.96 • Cost of Debt: 3.0% • Margin Tax: 10% • Synergies: $250 million Deal Size/Multiples Target @ Deal Price Target Acquirer Price +12.4% 76.41 68 79.59 Equity Value (million) 13,331.50$ 11,864.70$ 28,787.70$ Enterprise Value (million) 15,451.30$ 13,984.60$ 34,897.80$ P/E FTM 2013 (estimated) 18.2x 16.2x 14.7x P/E FTM 2014 (estimated) 17.0x 15.1x 11.4x EV/EBITDA CY2013 12.6x 11.4x 12.5x EV/EBITDA CY2014 11.9x 10.8x 8.6x Pro Forma Acquirer Proforma Target Acquirer CY2013 EPS Acc +1.8% 5.52 4.21 5.42 P/E required to maintain share price 11.2x 16.2x 14.7x Additional Synergies to break even (million) (666.90)$ CY2014 EPS Dil -4.2% 6.66 4.50 6.96 P/E required to maintain share price 11.9x 15.1x 11.4x Additional Synergies to break even (million) 173.10$ Net Leverage (Net Debt/TTM EBITDA) -0.1x 2.3x 2.0x 2.4x Equity Ownership by Target Holders 31.7% • Highly Dilutive • Will be difficult to obtain acquirer shareholder approval • Attractive for target shareholder due to estimated TMO’s upside potential Purchase of Equity 13,331.50$ - Cash & Equivalents 277.90$ + Preferred Equity -$ + Minority Interest 0.70$ + Total Debt 2,397.00$ = Total 15,451.30$ Uses (in Millions) Common Stock 13,331.50$ + Transaction Financing -$ - Cash & Equivalents 277.90$ + Preferred Equity -$ + Minority Interest 0.70$ + Total Debt 2,397.00$ = Total 15,451.30$ Sources (in Millions) *As per Bloomberg M&A estimates
  • 11. Transaction Scenarios – Accretion/Dilution Analysis* (Scenario– 50% cash & 50% stock deal) 11MGT 6066 Fall 2016 – Corporate Restructuring Assumptions • Cash / Share: $38.00 • Exchange Ratio: 0.48 • Cost of Debt: 3.0% • Margin Tax: 10% • Synergies: $250 million Deal Size/Multiples Target @ Deal Price Target Acquirer Price +12.1% 76.20 68 79.59 Equity Value (million) 13,296.00$ 11,864.70$ 28,787.70$ Enterprise Value (million) 15,415.90$ 13,984.60$ 34,897.80$ P/E FTM 2013 (estimated) 18.1x 16.2x 14.7x P/E FTM 2014 (estimated) 16.9x 15.1x 11.4x EV/EBITDA CY2013 12.6x 11.4x 12.5x EV/EBITDA CY2014 11.9x 10.8x 8.6x Pro Forma Acquirer Proforma Target Acquirer CY2013 EPS Acc +13.5% 6.15 4.21 5.42 P/E required to maintain share price 12.9x 16.2x 14.7x Additional Synergies to break even (million) (362.10)$ CY2014 EPS Acc +8.0% 7.52 4.50 6.96 P/E required to maintain share price 10.6x 15.1x 11.4x Additional Synergies to break even (million) (275.00)$ Net Leverage (Net Debt/TTM EBITDA) +1.7x 4.1x 2.0x 2.4x Equity Ownership by Target Holders 18.8% • Moderately Accretive • Moderate impact on credit rating • Will be difficult to obtain acquirer shareholder approval • Attractive for target shareholder due to estimated TMO’s upside potential Purchase of Equity 13,296.00$ - Cash & Equivalents 277.90$ + Preferred Equity -$ + Minority Interest 0.70$ + Total Debt 2,397.00$ = Total 15,451.90$ Uses (in Millions) Common Stock 6,665.70$ + Transaction Financing 6,630.30$ - Cash & Equivalents 277.90$ + Preferred Equity -$ + Minority Interest 0.70$ + Total Debt 2,397.00$ = Total 15,451.90$ Sources (in Millions) *As per Bloomberg M&A estimates
  • 12. Transaction Scenarios – Accretion/Dilution Analysis* (Reverse Scenario) – IMAGINARY 12MGT 6066 Fall 2016 – Corporate Restructuring Assumptions • Cash / Share: $60.00 • Exchange Ratio: 0.43 • Cost of Debt: 2.3% • Margin Tax: 18.3% • Synergies: $250 million • Price Premium: +12.1% What if Life Tech tries to acquire ThermoFisher? Purchase of Equity 32,278.10$ - Cash & Equivalents 1,008.30$ + Preferred Equity -$ + Minority Interest -$ + Total Debt 7,118.40$ = Total 38,388.20$ Uses (in Millions) Common Stock 10,576.10$ + Transaction Financing 21,702.00$ - Cash & Equivalents 1,008.00$ + Preferred Equity -$ + Minority Interest -$ + Total Debt 7,118.40$ = Total 38,388.20$ Sources (in Millions) Deal Size/Multiples Target @ Deal Price Target Acquirer Price +12.1% 89.24 79.59 68 Equity Value (million) 32,278.10$ 28,787.70$ 11,864.70$ Enterprise Value (million) 38,388.20$ 34,897.80$ 13,984.60$ P/E FTM 2013 (estimated) 16.5x 14.7x 16.2x P/E FTM 2014 (estimated) 12.8x 11.4x 15.1x EV/EBITDA CY2013 13.8x 12.5x 11.4x EV/EBITDA CY2014 9.5x 8.6x 10.8x Pro Forma Acquirer Proforma Target Acquirer CY2013 EPS Acc +79.4% 7.55 5.42 4.21 P/E required to maintain share price 9.0x 14.7x 16.2x Additional Synergies to break even (million) (1,349.70)$ CY2014 EPS Acc +108.8% 9.39 6.96 4.50 P/E required to maintain share price 7.2x 11.4x 15.1x Additional Synergies to break even (million) (1,976.30)$ Net Leverage (Net Debt/TTM EBITDA) +6.4x 8.4x 2.4x 2.0x Equity Ownership by Target Holders 47.1% *As per Bloomberg M&A estimates
  • 13. Enhanced Financial Scale and Market Position 13MGT 6066 Fall 2016 – Corporate Restructuring Combination increases ThermoFisher’s scale and efficiency, driving meaningful value to stockholders. 2014 Revenues 2014 EBITDA 12/31/2014 Debt THERMO FISHER LIFE TECH Combined with Synergies Debt / EBITDA (x) $12,644.6 million 29.0 YoY Growth (%) $3,892.0 million 24.0 YoY Growth (%) $7,118.4 million 3.2x $3,821.9 million 2.9 YoY Growth (%) $1,494.4 million 32.9 YoY Growth (%) $2,400 million 2.2x $16,466.5 million 29.0 YoY Growth (%) $5386.4 million 24.0 YoY Growth (%) $12,500 million 4.5x
  • 14. Enhanced Market Position 14MGT 6066 Fall 2016 – Corporate Restructuring Combined companies create greater financial value, drive greater market efficiencies and remain nimble to better capitalize on international market opportunities NET REVENUE – 2014 ($ in millions) EBITDA – 2014 ($ in millions) $- $5,000.00 $10,000.00 $15,000.00 $20,000.00 Thermo Fisher Life Technologies Illumina Inc Agilent Technologies Waters Corp Mettler-Toledo Bruker Corp VWR Corp ABAXIS Inc Haemonetics Corp Perkin Elmer Inc $- $1,000.00 $2,000.00 $3,000.00 $4,000.00 $5,000.00 Thermo Fisher Life Technologies Illumina Inc Agilent Technologies Waters Corp Mettler-Toledo Bruker Corp VWR Corp ABAXIS Inc Haemonetics Corp Perkin Elmer Inc
  • 15. Regulatory and Competitive Consideration Competition enforcement agencies around the world reviewed this transaction and brought up the following risks of a less competitive market. (US, Australia, Canada, China, European Union, Japan, and Korea) ThermoFisher post merger market share: • Greater than 50% of the worldwide market for individual siRNA reagents • Greater 90% of the market for siRNA reagent libraries. • Greater 50% share of the worldwide market for cell culture media • Approximately 60% of the market for cell culture sera. 15MGT 6066 Fall 2016 – Corporate Restructuring BUSINESS DESCRIPTION Cell Culture Serums and cell growth media for live cell cultures Gene Modulation siRNAs, shRNAs, and purification kits to isolate DNA and RNA Magnetic beads Beads for isolating nucleic acids SATISFYING REGULATORS ThermoFisher sells 3 business to GE for $1.1 billion TOTAL 2013 SALES = $250 MILLION
  • 16. Competing Bids Life Tech chose Thermo over Sigma-Aldrich Corp, a maker of chemicals for research laboratories, and a private equity consortium consisting of Blackstone Group, Carlyle Group, KKR & Co and Temasek Holdings. 16MGT 6066 Fall 2016 – Corporate Restructuring Offer from consortium of PE firms Offer from competitors The private equity consortium raised its offer on the Friday before the deal was announced from $65 to about $67 per share (roughly $11 billion), short of ThermoFisher's bid. Life Technologies had sought a higher price from bidders after receiving committed offers. "Life is a company with nearly 85% recurring revenues, has the highest operating margins among its peers, and is a free-cash-flow machine," Jonathan Groberg, Analyst, Macquarie Capital Inc.
  • 17. TMO - Proven Ability to Deliver Growth • Sales in 2012 were $12.51 billion, increase of $951 million from 2011. The increase was due to acquisitions, including Phadia® and Dionex®, and higher sales at existing businesses. • Demand from customers in academic and government markets slowed. Expected weakness in academic and government markets in near term due to uncertainty in the government funding expectations in the US and Europe • TMO’s strategy to augment internal growth at existing businesses with complementary acquisitions seems to have paid off well. Example One Lambda, a provider of transplant diagnostics, was acquired in Sep 2012 to enhance the company’s presence in specialty in vitro diagnostics and add new capabilities to the company’s transplant – testing workflow. 17 Full Year 2008– 2012 EPS Growth - 0.50 1.00 1.50 2.00 2.50 3.00 3.50 4.00 FY 2008 FY 2009 FY 2010 FY 2011 FY 2012 Diluted EPS MGT 6066 Fall 2016 – Corporate Restructuring 0.0% 2.0% 4.0% 6.0% 8.0% 10.0% 12.0% 14.0% 16.0% FY 2008 FY 2009 FY 2010 FY 2011 FY 2012 Free Cash Flow Margin Full Year FCF Margin 2008– 2012
  • 18. Proven Ability to Deliver Productivity Efficiency • In 2012, total company operating income and operating income margin were $1.48 billion and 11.8%, respectively, compared with $1.25 billion and 10.8%, respectively, in 2011. The increase in operating income was primarily due to profit on incremental sales from acquisitions and existing businesses • $67 million of cash restructuring costs primarily for continued headcount reductions and facility consolidations in an effort to streamline operations, including severance to reduce headcount at several businesses and abandoned facility expenses at businesses that have been or are being consolidated, such as the consolidation of several facilities in the U.S. and Europe. • Return on Capital and Return on Assets is expected to improve once post merger integration (Phadia, One Lambda and Dionex) activities are completed. 18 Efficiency Metrics MGT 6066 Fall 2016 – Corporate Restructuring 17.0% 17.5% 18.0% 18.5% 19.0% 19.5% 20.0% FY 2008 FY 2009 FY 2010 FY 2011 FY 2012 EBITDA Margin 0.0% 1.0% 2.0% 3.0% 4.0% 5.0% 6.0% 7.0% 8.0% FY 2008 FY 2009 FY 2010 FY 2011 FY 2012 Return on Capital 5.1x 5.1x 5.2x 5.2x 5.3x 5.3x 5.4x 5.4x 5.5x 5.5x FY 2008 FY 2009 FY 2010 FY 2011 FY 2012 Inventory Turnover 0.0% 1.0% 2.0% 3.0% 4.0% 5.0% 6.0% FY 2008 FY 2009 FY 2010 FY 2011 FY 2012 Return on Assets
  • 19. THERMO FISHER’s Successful Acquisition Track Record 19MGT 6066 Fall 2016 – Corporate Restructuring PHADIA DIONEX ONE LAMBDA • Enhances ThermoFisher's leadership position in high growth, high margin specialty diagnostics • Accelerates growth opportunities for Phadia • Expected to be immediately accretive to adjusted EPS; generates revenue, cost & tax synergies • PHADIA expected to increase 2011 revenue by $190 M and improve EPS by $0.07 • Sales in 2012 improved by $951M in 2012 and by $262M in 2011 • Increase ThermoFisher's footprint in growing Asia-Pacific market • Improve performance & productivity for customers • Expected to be accretive to adjusted EPS by $0.13 to $0.15 in first 12 months post close and expected to generate $60 million in total operating synergies in year three • Sales in 2012 improved by $951M in 2012 and by $262M in 2011 • Enhances ThermoFisher’s Presence in Specialty in vitro Diagnostics • Creates Opportunities to Leverage ThermoFisher’s Commercial Infrastructure in Emerging Markets • Upon close the transaction is expected to improve adjusted EPS by $0.09 to $0.11 per share • Transaction was expected to generate revenue and cost synergies to improve operating income by $15M • Transaction resulted in annual cost saving of $85M in 2013
  • 20. 20MGT 6066 Fall 2016 – Corporate Restructuring Analyst Reaction “We believe TMO remains well-positioned as a stand-alone entity, and LIFE is a “nice to have” rather than a “must have,” we remain constructive on the potential for a deal for TMO. Tycho W. Peterson, J P Morgan  TMO remains the most likely acquirer, in our view... according to press reports, TMO was the only strategic bidder for LIFE, and bid higher than private equity. While we expect TMO’s bid to include equity (so that the company can stay in its leverage comfort range), a higher bid that includes equity that is likely to appreciate should be easily superior to a lower cash offer.  …as a potential deal could be highly accretive… we could easily see >$500M of operating income synergies over time, with overlapping sales channels, G&A functions, and LIFE’s overspending on R&D being low-hanging fruit. It should also be noted that LIFE’s >1,000bp higher tax rate represents a significant source of potential net income synergies over time, in our view. With this in mind, we believe it is not difficult to see >10% ROIC on a LIFE acquisition around $70, which should bolster the case for TMO as a strong cash generator with improving returns.  …but we would expect TMO to under-promise and over-deliver. If/when a deal is announced, we believe that TMO is likely to under-promise on synergies and accretion, consistent with the company's track record of being conservative with guidance over the last year, and setting up a multi-year beat-and-raise story. While it is possible to see FY14 accretion as much as $1 in EPS (~17%), it is far more likely that initial expectations could be for half this amount, in our view.  Thoughts on antitrust. While it is not uncommon for deals in this highly technical industry to receive second requests in the U.S. (and it seems the revenue threshold would almost certainly require a China review), we believe that antitrust approval would eventually be granted without any material effect on the business. If divestitures are required in the small parts of the business that do overlap (PCR, parts of bio production), we find it difficult to see much north of 1% of the combined total revenue.
  • 21. Event Studies 21MGT 6066 Fall 2016 – Corporate Restructuring -4.00% -2.00% 0.00% 2.00% 4.00% 6.00% 8.00% CAR before investment firm was hired CAR after investment firm was hired CAR before deal announcement CAR after deal announcement Cumulative Abnormal Return (TMO) 1 Day 10 Days 40 Days 0.00% 2.00% 4.00% 6.00% 8.00% 10.00% 12.00% 14.00% 16.00% CAR before investment firm was hired CAR after investment firm was hired CAR before deal announcement CAR after deal announcement Cumulative Abnormal Return (LIFE) 1 Day 10 Days 40 Days DATE EVENT LIFE previous day closing price (Trading Volume) LIFE same day closing price (Trading Volume) THERMO previous day closing price (Trading Volume) THERMO same day closing price (Trading Volume) $54.97 $60.79 $68.93 $69.40 (2,866,092) (16,500,554) (1,836,400) (1,738,400) $68.23 $73.50 $79.59 $78.58 (3,253,850) (46,272,855) (2,325,200) (14,442,500) 18-Jan-13 LIFE hires two investment firms 15-Apr-13 THERMO deal announced
  • 22. Post Deal Announcement 22MGT 6066 Fall 2016 – Corporate Restructuring Approval by Target & Acquirer board of directors Approval by LIFE shareholders Approval by European Commission Approval by Australian Competition & Consumer Commission Approval by Chinese Ministry of Commerce Approval by Federal Trade Commission 04/15/13 08/21/13 11/26/13 12/19/13 01/15/14 01/15/14 02/03/14 Deal Completion
  • 23. Closing Thoughts* 23MGT 6066 Fall 2016 – Corporate Restructuring From ThermoFisher’s 2015 10K …. • Sales in the Life Sciences Solutions segment increased $244 million to $4.44 billion in 2015 primarily due to the acquisition of Life Technologies, net of divestitures. The increase in pro forma revenue at existing businesses was primarily due to increased demand for bioprocess production products as well as biosciences products. • During 2015 , the company’s cash flow from operations totaled $2.82 billion compared with $2.62 billion for 2014 . The increase resulted from cash disbursements in the 2014 period totaling $325 million related to the acquisition of Life Technologies, including severance obligations, third-party transaction/integration costs and monetizing certain equity awards held by Life Technologies employees at the date of acquisition. • In addition, the company recorded $82 million of cash restructuring costs primarily for actions to achieve synergies from the Life Technologies acquisition. • The company’s effective tax rate was 9.2% in 2014. Aside from the discrete tax on the divestiture, the company had a benefit from income taxes primarily due to restructuring and other costs associated with the acquisition of Life Technologies. 0.00% 20.00% 40.00% 60.00% 2012 2013 2014 2015 2 Year Performance Post Acquisition % of Total Revenue Total Revenue Growth Division Revenue Growth EPS Growth 0 5 10 15 20 2012 2013 2014 2015 Life Science Division Total revenue Revenue ($, billion) *From ThermoFisher’s 2015 10K statement