How to use the Automatic Round Off feature in Tally ERP 9?
MAC10 User Manual
1. MAC10 User Manual
Setup
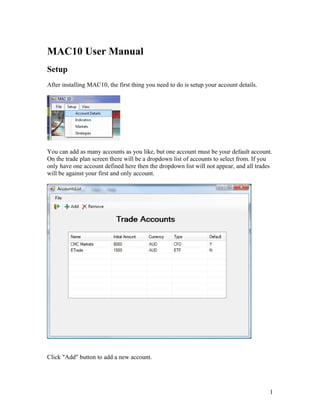
After installing MAC10, the first thing you need to do is setup your account details.
You can add as many accounts as you like, but one account must be your default account.
On the trade plan screen there will be a dropdown list of accounts to select from. If you
only have one account defined here then the dropdown list will not appear, and all trades
will be against your first and only account.
Click "Add" button to add a new account.
1
2. Or Right click the list and use the context menu. Select "Add" to add a new account, or
"Open" to see details of an existing account.
Note: Double clicking an account in the accounts list will also open that account,
allowing you to edit details.
Enter your Account Name, Account Type, Initial Equity of your account, and the base
currency of your account. If this is to be the default account, select the default check box.
There can only be one default account. Then click “Save”.
Base currencies supported are: AUD, USD, and GBP for British Pound.
2
4. Some indicators are preloaded. You can remove any you feel aren’t appropriate, by
selecting the indicator in the table, and clicking the “Remove” button.
You can view or edit any indicator by double clicking the indicator in the table.
Adding new indicators, just click “Add” button, or right click the list and select "Add"
from the context menu.
4
5. Fill in Indicator name, select type as either Study or Oscillator.
Type a brief description. Optionally you can copy and paste a chart example of your
indicator. On the menu bar, select “Edit”, then “Paste Chart”
Click the “Save” button to save you indicator.
5
6. Back on the Indicator List screen, click “Refresh” button to refresh the table, and your
new indicator will appear.
6
7. Setup Markets
Setting up market will greatly speed up your record keeping allowing the Planning screen
to be pre populates. Ideally you would have only about 5 or 6 market you trade regularly.
On the menu bar, select “Setup” then “Markets”.
On the menu bar select “Setup”, then “Markets”
7
8. Some markets have been preloaded for you. You can remove anyone of these by
selecting the market in the table and clicking the “Remove” button; Or select the Market,
right click the mouse and select Remove from the context menu.
You can view or edit any market by double clicking the market in the table.
To add your favorite market. Click the “Add” button.
Fill in Symbol, Type as either Share, ETFs, Futures or FX. Currency is the currency the
share or contract is traded in. A brief description, optional web address, and optional
notes. If you enter a Web address on this screen it will appear as a hyperlink on the
Planning Screen that you can click on and have the web page appear in your default
browser.
Multiplication Factor is used with Futures Contracts where one contract equates to
several units of under lying commodity. This figure is used in calculating profit and loss.
Click the “Save” button.
8
9. On the Markets List screen, click “Refresh” to refresh the table and your new Market
should appear.
9
10. Setup Strategies
Strategies are useful to track over time. Hopefully it will show you bad strategies before
they do to much damage to your account.
On the menu bar click “Setup”, then “Strategies”
Some strategies are preloaded. You can delete anyone of these by selecting the strategy in
the table and clicking the “Remove” button, or right click the Strategy in the list and
select Remove from the context menu.
10
11. You can view or edit a strategy by double clicking a strategy in the table.
Add a new strategy, click “Add” button”
Fill in Strategy name, select Active as either Yes or No. Source is who told you about this
strategy. Lastly, any additional notes.
Click the “Save” button.
11
12. Planning Your Trade
MAC10 insists you plan a trade before executing it.
Therefore the planning screen must be filled in, even if the trade never eventuates.
On the main screen you’ll notes three buttons; All, Month and Week. These act as filters
on the tables above. Month will display plans and trades over the last 30 days. Week will
display only the last 7 days.
Note the Grey ball in the Planning table. A plan that has not been executed will have a
grey ball and appear in the Planning screen
12
13. Once the trade has been executed but not exited, the ball will be orange, and the trade
will appear in one of the trade execution tables, either Shares, Contracts or FX. Once the
trade is exited, the ball will turn red if the trade was at a loss; or turn green if you exited
with profit.
To create a New Plan, click “New”.
Symbol is a dropdown list of the symbols of markets you have entered during setup. If
the market symbol you are look for does not appear, you can type the symbol in the text
box.
13
14. Direction will be either Long or Short.
Order will be Limit, Market or Stop. If you bought when the market fell, or sold when
the market went up, then it’s a limit order. If you sold when the market fell, or bought
when the market went up then it’s a stop order.
Type will be Shares, Futures or FX
Strategy is a dropdown list of strategies you’ve defined during setup.
Limit Entry is your planned entry price.
Price Target is your planned exit price.
Protective Stop is the price you plan to put your stop at.
Currency is the currency your financial instrument is traded in.
Conversion Rate is the exchange rate between your base currency and the currency your
financial instrument is traded in.
Max Dollar Risk is an optional field, which represents the maximum amount you are
prepared to risk on this trade. If you enter a value in here, then when you click calculate it
will calculate the number of shares or contracts you can buy or short without breaking
your limit.
Potential Loss is not a field you need to enter a value in. When you click Calculate, a
potential loss amount will be calculated for this field based on your entry price and
position of your stop loss.
No. Of Shares is the number of shares or contracts you plan to buy or short.
Risk Reward Ratio is a field that is automatically calculated based on potential profit and
loss figures.
Average Volume is an optional value which represents the average trading volume.
Upper Channel Line, is optional and represents the upper channel border. This is used in
calculating Target Values.
Lower Channel Line, is optional and represents the lower channel border. This is used
in calculating Target Values.
Channel Height this is automatically calculated based on Upper and Lower channel
values.
Potential Gain is calculated when the Calculate button is clicked. It is based on No Of
Shares * (Entry – Exit)
A Target is the exit value needed for the trade to be considered an A grade trade. It is
calculated as Profit (Entry – Exit) being 30% of the Channel Height.
B Target is the exit value needed for the trade to be considered a B grade trade. It is
calculated as Profit (Entry – Exit) being 20% of the Channel Height.
C Target is the exit value needed for the trade to be considered a C grade trade. It is
calculated as Profit (Entry – Exit) being 10% of the Channel Height.
Indicators a series of check boxes. Select which ever indicators you’re used. Overtime
this information will tell you if an indicator is useful, or redundant.
Reason for Entry – a brief description of why you entered this trade.
Click “Save”.
14
15. Charts
Charts record your view of the market at the time you formulated your plan.
It is based on Alexander Elder’s Three Screen Trading System. It is designed with three
views; Weekly Chart, Daily Chart, Hourly Chart. Use the weekly chart to see the overall
market direction. You would typically trade in this direction. Use the daily chart to pick
the right day to buy or short. I.e. on a pullback. Use the hourly chart to time your entry
during your chosen day.
Charts can be copy and pasted in from the clipboard by clicking Edit on the menu bar,
then Paste Chart, then select from Weekly, Daily or Hourly depending on your target
pane. Additional notes can be entered in the text box below the chart.
Click Save to save the changes. A saved chart can be changed later by following the same
process and pasting a new chart over the old.
15
16. There is no need to rigidly follow the three screen approach. Just paste the Daily chart if
that’s all you’ve used. Or, paste a daily into the weekly and daily panes if you so desire.
Execution
In the Execution Phase you’ll record your entry and exit details and MAC10 will
calculate your profit or loss.
Double Click a Plan you’ve previously recorded, or use the context menu to open.
16
17. Entry Data
Entry Date – Date you bought or went short
Order Price – Price you wanted to enter at.
Filled Price – Price you did enter at.
Slippage – The difference between Order Price and Filled Price. The same in most cases.
Order Type – Limit, Market or Stop
Quantity – No of shares or futures contracts
Day’s High – the high of the day you entered the market
Day’s Low – the low of the day you entered the market
Entry Grade – Calculated when you click the Calculate button. Based on entry price and
the high and low of the day you entered the market.
Exit Data
Exit Date – Date you exited the trade
Price Ordered – Price you wanted to exit at.
Filled Price – Price you did exit at.
17
18. Slippage – slippage between Order Price and Filled Price
Commission – total commission on the trade.
Total Cost – Calculated when the calculate button is clicked. Quantity * Entry Price
Day’s High – the high of the day you exited the market
Day’s Low – the low of the day you exited the market
Exit Grade – Calculated when you click the Calculate button. Based on exit price and
the high and low of the day you exited the market.
Gain/Loss % - amount gained or lost as a percentage of the trade value
Gain/Loss $ - amount gained or lost in dollars
Trade Grade – overall grading for the trade. Based on percentage of the channel
captured in the trade.
Reason for Exit – a brief description as to why you exited the trade.
Post Trade Review
Post Trade Analysis – Thoughts you have about the trade immediately after it’s
execution.
Followup Analysis – Thoughts you have about the trade weeks after it’s execution.
Click “Save” to save your results
18
19. Reports
Select Equity Report from the dropdown list.
Equity Report
Select an Account from the dropdown list
You can select either a line chart or a scatter chart from the buttons on the right.
Copy button allows the chart to be copied to the clipboard from where it can be pasted
into a email or word document.
19
20. Grading Report
The Grade Report, reports Grades of trades per month, starting at the beginning of the
current year.
On the main screen Select View from the menu bar and then Grading Report.
Select Report Type as either Entry Grades, Exit Grades or Trade Grades.
Copy button allows the chart to be copied to the clipboard from where it can be pasted
into a email or word document; or right click the chart and select from the context menu.
20
21. Indicator Report
The Indicator Report, reports the number of profit and loss trades based on indicators for
the period selected. It's designed to highlight indicators that are working for you versus
indicators that are not.
On the main screen Select View from the menu bar and then Indicator Report.
By default the report, reports all recorded trades. Click either Weekly, Monthly or Yearly
buttons to evaluate usage over different time frames.
Copy button allows the chart to be copied to the clipboard from where it can be pasted
into a email or word document; or right click the chart and select from the context menu.
21
22. Market Report
The Market Report, reports the number of profit and loss trades based on Markets for the
period selected. It's designed to highlight markets that are working for you versus
markets that are not.
On the main screen Select View from the menu bar and then Market Report.
By default the report, reports all recorded trades. Click either Weekly, Monthly or Yearly
buttons to evaluate usage over different time frames.
Copy button allows the chart to be copied to the clipboard from where it can be pasted
into a email or word document; or right click the chart and select from the context menu.
22
23. Strategies Report
The Strategies Report, reports the number of profit and loss trades based on Strategies
used for the period selected. It's designed to highlight strategies that are working for you
versus strategies that are not.
On the main screen Select View from the menu bar and then Market Report.
By default the report, reports all recorded trades. Click either Weekly, Monthly or Yearly
buttons to evaluate usage over different time frames.
Copy button allows the chart to be copied to the clipboard from where it can be pasted
into a email or word document; or right click the chart and select from the context menu.
23
24. Statistics Report
On the main screen Select View from the menu bar and then Statistics Report.
Select either Overall Results, Long or Short Results.
24