Measuring Tissue Perfusion and PO2 in Conscious Animals to Investigate Organ ...
TiandaryPoster
1. Fourier Analysis of Oscillating Blood Flow
URC # 7765
Abstract: Previously recorded video of oscillating flow of blood
through an in vitro model of a simple micro vascular network were
analyzed. The in vitro model was a triangular construction with two
inlet streams and two outlet streams. One inlet stream was perfused
with saline solution and the other introduced red blood cell suspension
into the network. The flow oscillated spontaneously between the blood
and saline inlets. The location of the meniscus between the blood and
saline rate was extracted from the recorded videos as function of time.
The MatLab Fast Fourier Transform (FFT) was used to identify the
frequencies of the blood flow oscillation. Results of the FFT allowed a
quantitative comparison of four sets of data. The analysis of the video
records shows that the spontaneous oscillations are long term and
sustained. The experimental data show that this in vitro demonstration
of spontaneous oscillations is reproducible. The analysis also
quantitatively shows influence of the blood and saline inflow rates on
the generated oscillations.
Background
Fluctuating blood flow is very common in active biological
control. In the absence of biological control, blood flow can
exhibit oscillations due to nonlinear physics. Spontaneous
nonlinear oscillations, independent of biological control, have
been demonstrated with in vitro experiments. During this
project four video records of oscillating blood flow have been
analyzed.
Experimental Conditions
The four experimental conditions were:
inlet RBC vol fract= 0.744, Qblood / Qsaline = 0.598 (set 1)
inlet RBC vol fract= 0.744, Qblood / Qsaline = 0.561 (set 2)
inlet RBC vol fract= 0.753, Qblood / Qsaline = 0.950 (set 3)
inlet RBC vol fract= 0.753, Qblood / Qsaline = 0.813 (set 4)
Rita Andary - Chemical Engineering, University of New Hampshire
Experimental Model
A triangular shaped network was fabricated
using 50 µm wire, wax and silicone rubber.
The photo to the left is a close up of one of
the junctions in one such network. All
experiments were conducted with the same
network. Clear saline solution entered in
the top branch and RBC suspension
entered in the bottom inlet branch. Fluid
exited to the left. Oscillations were
observed as the meniscus between the
RBCs and saline started moving back and
forth in the branch connecting the two
inlets.
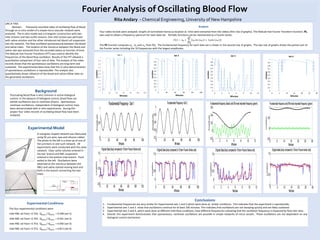
Analysis
Four video records were analyzed. Graphs of normalized meniscus location vs. time were extracted from the videos (first row of graphs). The MatLab Fast Fourier Transform function, fft,
was used to obtain a frequency spectrum for each data set. Periodic functions can be represented as a Fourier Series.
The fft function computes an , bn and ωn from f(t). The fundamental frequency for each data set is shown in the second row of graphs. The last row of graphs shows the partial sum of
the Fourier series including the 10 frequencies with the largest amplitudes.
0
0.1
0.2
0.3
0.4
0.5
0.6
0.7
0.8
0.9
1
0 2 4 6 8 10 12
Location
Minutes
Set 3
0
0.1
0.2
0.3
0.4
0.5
0.6
0.7
0.8
0.9
1
0 5 10 15 20 25 30
Position
Minutes
Set 4
Conclusions
1. Fundamental frequencies are very similar for Experimental sets 1 and 2 which were done at similar conditions. This indicates that the experiment is reproducible.
2. Experimental sets 1 and 2 show that oscillations continue for at least 100 minutes. This indicates that oscillations are not damping quickly and are likely sustained.
3. Experimental sets 3 and 4, which were done at different inlet flow conditions, have different frequencies indicating that the oscillation frequency is impacted by flow rate ratio.
4. Overall, this experiment demonstrates that spontaneous, nonlinear oscillations are possible in simple networks of micro vessels. These oscillations are not dependent on any
biological control mechanism.
0
0.1
0.2
0.3
0.4
0.5
0.6
0.7
0.8
0.9
1
0 20 40 60 80 100
Location
Minutes
Set 2
0
0.1
0.2
0.3
0.4
0.5
0.6
0.7
0.8
0.9
1
0 20 40 60 80 100 120
Location Minutes
Set 1