1. STONY BROOK UNIVERSITY
COLLEGE OF ENGINEERING AND APPLIED SCIENCES
Chemical and Molecular Engineering Program
Chemical Engineering Laboratory II:
CME 320
Gold Nanoparticles
By
Marcin Kielkiewicz
Team Members: Jennifer Imbrogno & Kathryn Margaret Caducio
Instructor: Tatsiana Mironava
Submitted to:
Prof. Miriam Rafailovich and Dr. Pinkas-Sarafova
Submitted: May 6, 2015
2. Marcin Kielkiewicz 108225444 CME 320 Hydrogels April 15, 2015
Abstract
The goal of this experiment was to synthesize Star-Like Gold Nanoparticles (SGNs) and measure
the effect stirring of the reaction mixture had on the eventual size and size distribution of SGNs produced.
Chloroauric acid was reduced by hydroquinone in water to produce SGNs; the reaction was conducted and
room temperature and the mixture was stirred for forty minutes. Five samples were extracted from the
reaction mixture every ten minutes, starting at t = 0 minutes and ending when t = 40 minutes. The samples
were first analyzed with UV-Vis spectroscopy,which revealed a common peak absorption between 637 nm
– 642 nm indicating a constant SGN diameter of approximately one hundred nanometers. Further testing
with ζ-potential equipment showed that stirring time improved the stability of the colloidal dispersion.
Every additional ten minutes of stirring increased the ζ-potential by approximately four millivolts until the
final ten minutes, in which the increase was only one millivolt. It appeared that stirring quickly establishes
a permanent stationary layer of fluid around the SGNs which is unaffectedby prolonged storage.Transition
electron microscopy (TEM) gave insight as to the actual SGNs diameter and size distribution. Only three
samples were successfully tested, however from those results it was shown that stirring for ten minutes
produced no noticeable effect on particle size or particle size distribution. However, stirring for thirty
minutes increased the nanoparticle diameter by approximately ten nanometers and narrowed the size
distribution by approximately three and a half nanometers. From these results we recommend that future
synthetic procedures include a thirty minute stirring window in order to improve colloidal stability and
narrow down the size distribution of the SGNs produced. Additional tests must be completed using the
TEM to determine whether the process can be further optimized.
Introduction
Gold nanoparticles (AuNPs) are sub-
micrometer sized nanoparticles that have unique
optical and electronic properties that are unlike
those of the bulk material.1
AuNPs are subject to
ongoing research with a wide range of
applications, including X-ray imaging,2
photocatalysis,3
cancer therapy,4
among others in
the fields of materials science and medicine.
There are several reasons why AuNPs
have received significant attention from the
scientific community. First off, they are easily
synthesized and stabilized. Second, they provide
an exceptionally high surface to volume ratio.
Third, they are biocompatible when appropriate
ligands are affixed to them. Fourth, the ability to
modify the size and shape of AuNPs allows for
the optimization of many properties, such as
plasmon resonance absorption, conductivity,
fluorescence, and redox properties.5
There are severaltypes of AuNPs,one of
them being Star-Like Gold Nanoparticles
(SGNs), which have been proposed as reliable
nanostructures for Surface Enhanced Raman
Spectroscopy (SERS).6
To provide some
background, this technique measuresthe inelastic
scattering of photons as they are reflected off of a
layer of molecules adsorbed on the surface of a
nanoparticle. Because SGNs have protruding
“hooks” from their surface, they are well suited
for this application because various proteins and
enzymes can be easily adsorbed onto their
surface.7
SGNs have been previously synthesized
by the reduction of chloroauric acid by
hydroquinone in aqueous solution, followed by
stabilization of the nanoparticles by sodium
citrate.8
The goal of our experiment was to
synthesize SGNs utilizing the reagents listed
above and study the effect of stirring time on
particle size and particle size distribution. In our
3. Marcin Kielkiewicz 108225444 CME 320 Hydrogels April 15, 2015
experimental procedure hydroquinone and
chloroauric acid were stirred at room temperature
for forty minutes. A1-2 mL sample wasextracted
from the reaction vessel every ten minutes
starting at t = 0 min. Samples were analyzed
using UV-Vis spectroscopy, ζ-potential, and
transition electron microscopy (TEM) to
determine whether stirring time affected the size
distribution of the particles. Using the data
obtained we sought to determine the optimal
stirring time that would produce SGNs with the
most narrow size distribution.
Methods and Materials
The SGNs synthesis was carried out in a
fume hood with proper ventilation. Latex gloves
were worn throughout the experiment as some
reactants/reagents were corrosive. 40 mL ± 1 mL
of deionized (DI) water was added to a 250 mL
glass beaker. The glass beaker was positioned on
a magnetic stirrer, and a magnetic stir rod was
added to the beaker. Stirring was started without
reagents at moderate speed and no heating
element was used. 200 μL of chloroauric acid
(30%, HAuCl4, aqueous) was added to the beaker
using a micropipette. Next, 400 μL of
hydroquinone (11
𝑚𝑔
𝑚𝐿
, p-C6H4(OH)2, aqueous)
was added to the beaker using a micropipette.
After the two reagents were mixed the solution
immediately turned pale blue. A 1-2 mL sample
was extracted after no more than one minute after
the addition of hydroquinone. This sample was
stored in a scintillation flask and labeled t = 0
min. Four more samples of similar volume were
extractedfrom the beakerafterten, twenty, thirty,
and forty minutes. No visible changes in color of
the solution were noticed during this time period.
Time intervals were determined using a smart
phone stopwatch. All samples were stored in
separate scintillation flasks and stabilized with
sodium citrate as well.
After one week in storage the samples
were subject to analysis by UV-Vis spectroscopy
[Thermo Scientific, UV Insight]. A scan of each
sample was conducted from 400 nm to 750 nm in
1 nm increments. The test was conducted to see
determine whether stirring time affected the size
of SGNs. It has been documented that the peak
absorption in the UV-Vis spectra corresponds to
the average diameter of the SGNs. To clarify with
an example, SGNs with diameters of
approximately 50 nm appear red in color, while
those with diameters of approximately 100 nm
appearblue. However,given a mixture of the two,
UV-Vis will indicate a single absorption peak
instead of two distinct peaks.9
The phenomena
that causes AuNPs of different size to have
unique absorption properties is known as surface
plasmon resonance. Electromagnetic radiation
induces a dipole on the surface of the metal that
oscillates with the frequency of the light;10
in turn
the electron cloud is of the AuNP is also
oscillating with a specific frequency, which is
dependent on both the shape and size the AuNPs,
since changing either parameter alters the
geometry of the electron cloud. By illuminating
the metal surface with light that has a frequency
equal to that of oscillations within the electron
cloud (resonance frequency), the energy of the
harmonic oscillations will increase. A plasmon is
the term used to describe the smallest unit of
electron density oscillation.11
On the same day the samples were
subject to UV-Vis analysis, the ζ-potential of all
five samples was also measured [NanoBrook
Omni, Brookhaven Instruments]. The ζ-potential
test measured the electric potential between the
stationary fluid layer at the surface of the SGNs
and the mobile plane of molecules surrounding
the stationary plane.12
The test was used to
determine the stability of the colloidal
distribution of SGNs in water. The magnitude of
the ζ-potential indicated the degree of
electrostatic repulsion between adjacent particles
4. Marcin Kielkiewicz 108225444 CME 320 Hydrogels April 15, 2015
in a dispersion. Hence colloids with high ζ-
potential were electrically stabilized while
colloids with low ζ-potential would tend to
coagulate or flocculate.13
After two weeks in storage the samples
were analyzed using TEM [SBU Research and
Development Park]. The previous week a droplet
of each SGN sample was administered onto a
copper support mesh and dried to remove
moisture (which would otherwise vaporize in the
TEM and disrupt imaging). At least five images
of SGN clusters were taken of each sample on
each mesh grid, and the diameter of one hundred
distinguishable nanoparticles was measured
using ImageJ software. Because the SGNs were
not spherical, the diameter was of each was
obtained in a random direction without the use of
a common axes. For each sample set,the average
diameter and the population standard deviation
were obtained using Eq. 1 and 2, respectively.
[Equation 1] xavg =
1
𝑁
∑ 𝑥𝑁
𝑖=1 i
[Equation 2] σ = √
1
𝑁
∑ (𝑥𝑁
𝑖=1 i - xavg)2
Eachsample setwascomparedto another
one using the Student’s t-Test.The parametersfor
the test were unequal variance, independent
samples, equal sample size, and two-tailed
analysis. The null hypothesis was as follows:
Two sets of data (A and B), with sample means
xavgA and xavgB, were both part of the same
population, so that their populations were equal.
The t-value was calculated using Eq. 3.
[Equation 3]
t = (xavgA - xavgB) ÷ (sxAsxB√
2
𝑁
)
Data and Data Analysis
Selected UV-Vis spectra data are shown
in Table 1. The UV-Vis spectra from the sample
t = 0 min is shown in Fig. 1. The UV-Vis spectra
of the other samples were omitted in this report
because they appeared identical to one in Fig. 1,
hence they would’ve been redundant. In Table 1
the peak absorbance wavelength for the first two
samples was 642 nm. This indicating that the
average size of the molecules was not affected by
stirring over this time interval. However,afterten
minutes the peak absorption wavelength
decreased slightly relative to those two values,
indicating that the overall average diameter of the
SGNs decreased. However,this conclusion may
be skewed, because the change in wavelength
absorbance was minute and only one UV-Vis
spectra was taken of each sample. Overall, we
concluded that the average size of the molecules
did not change significantly over the forty
minutes of stirring and was largely unaffected by
it. The data was able to confirm that the size of
the molecules was approximately one hundred
nanometers for all the samples, since a blue
colored AuNP solution corresponds to
nanoparticles of that size.
Sample # Absorbance Wavelength
(nm)
t = 0 min 0.15714 642
t = 10 min 0.154929 642
t = 20 min 0.223036 639
t = 30 min 0.154096 640
t = 40 min 0.154282 637
Table 1. UV-Vis spectra data.
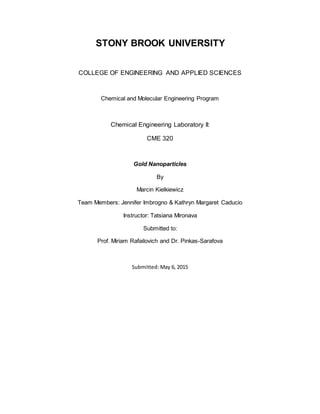
Figure 1. UV-Vis spectra of the sample, t = 0 min. From 400
nm to 750 nm, plotted with 1 nm increments.
5. Marcin Kielkiewicz 108225444 CME 320 Hydrogels April 15, 2015
The results of the ζ-potential test
indicated that stirring time increased the stability
of the SGNs. The average ζ-potential for each
sample and the corresponding standard deviation
are shown in Table 2. It is clear from the data that
ζ-potential increased from t= 0 min to t = 40 min.
From the UV-Vis analysis the consensus was that
the size of the SGNs is relatively constant,
therefore a change in particle size cannot be the
reason behind the increase in ζ-potential. A
possibility was that stirring rapidly saturated the
stationary layer of fluid around the SGNs with
both water and sodium citrate. The increase in ζ-
potential appeared to taper off between thirty and
forty minutes, indicating that the stationary layer
may have been close to reaching its saturation
point at around that time. Further research must
be done to support this theory, and an assumption
has to be made that states that interchange
between the bulk fluid and the stationary layer is
almost nonexistent throughout the week spent in
storage, otherwise the samples would have the
same ζ-potential. Regardless of the reason, the
test confirms that stirring longer stirring time
produces more stable colloidal SGNs solutions.
TEM provided the most useful
information in this experiment. Images of SGNs
clusters were obtained and then analyzed using
ImageJ software. The data is shown in Table 3.
The data from Table 3 were then analyzed using
the Student’s t-Test; the results are shown in
Table 4. Unfortunately, for samples t = 20 min
and t = 40 min, the copper mesh grids were
damaged prior to being inserted into the TEM,
and no SGN clusters were detectedon either grid.
For the remaining samples, it was evident that
stirring increased the diameter of the SGNs and
decreased the size distribution (the standard
deviation decreased). Between t = 0 min and t =
10 min, there was no meaningful change in size
distribution or nanoparticle size. This result is
supported by the t-Test, which indicated there
wasa 51% probability that the SGNs from sample
t = 0 min and t = 10 min belonged to the same
population. From this information we drew the
conclusion that stirring for the first ten minutes
had no effect on the SGNs. On the other hand,
between the first two samples and t = 30 min,
there was a noticeable change in diameter and
size distribution. Between t = 10 min/t = 0 min
and t = 30 min, the diameter increased by over
seven nanometers and the size distribution was
narrowed down by three and a half nanometers.
The t-Test indicated that the probability either
sample t = 0 min or t = 10 min being part of the
same population as t = 30 min was below 10%,
therefore unlikely according to Dr. Rafailovich,
meaning that stirring had a meaningful effect on
size distribution and particle diameter. We
concluded from the data that stirring the solution
for thirty minutes improved the size distribution,
however it increased also SGNs diameter.
However,because the data for samples t =20 min
and t = 40 min are missing, we recommend the
TEM test be repeated to obtain the missing data
because it could lead to an improved
optimization.
As proof of the successful synthesis of
SGNs, a TEM image from the sample t = 10 min
is shown in Fig. 2.
Table 2. Select data from the ζ-potential test.
Sample # ζ-potential
(mV)
σ (mV)
t = 0 min -3.27 0.42
t = 10 min -7.55 5.82
t = 20 min -10.92 2.53
t = 30 min -15.37 3.56
t = 40 min -16.88 2.77
Sample # Avg.
Diameter
(nm)
σ (nm)
t = 0 min 90.0 29.1
t = 10 min 92.8 29.2
t = 20 min No data No data
t = 30 min 100.1 25.6
t = 40 min No data No data
Table 3. Average diameter and population standard
deviation of the data obtained from ImageJ software
after analyzing TEMimages.
6. Marcin Kielkiewicz 108225444 CME 320 Hydrogels April 15, 2015
Conclusion
In this experiment we successfully synthesized SGNs and measured the effect stirring time of the
reaction mixture had on the size and size distribution of SGNs. UV-Vis analysis confirmed the existence of
SGNs with diameters of approximately one hundred nanometers; size was not noticeably affected by
stirring, given that the peak absorption remained between 637 nm – 642 nm. ζ-potential testing showed that
stirring time improved the stability of colloidal nanoparticle solutions and that they were less likely to
coagulate, even if stored at room temperature for a week. TEM gave insight as to the actual SGNs diameter
and size distribution. After analyzing the three samples, it was shown that stirring for ten minutes produced
no noticeable effect on particle size or particle size distribution. However, stirring for thirty minutes
increased the nanoparticle diameter by approximately ten nanometers and narrowed the size distribution by
approximately three and a half nanometers. From these results we recommend that future production cycles
of SGNs be conducted with a thirty minute stirring period, as it will both improve colloidal stability and
narrow down the size distribution.
Table 4. Student’s t-Test results.
Two samples being
compared
t-test result (*100%)
t = 0 min and t = 10
min
51%
t = 10 min and t= 30
min
6%
t = 0 min and t = 30
min
1%
Figure 2. A magnified image of SGNs from the sample t =
10 min obtained from the TEM.
7. Marcin Kielkiewicz 108225444 CME 320 Hydrogels April 15, 2015
References
1] Bernhard Wessling, Handbook of Nanostructured Materials and Nanotechnology, Vol. 5: Organics,
Polymers and Biological materials, ConductivePolymer/SolventSystems:SolutionsorDispersions? 1996.
2] Hainfeld, J. F. "Gold Nanoparticles: A New X-ray Contrast Agent."British Journal of Radiology 79.939
(2006): 248-53.
3] Primo, Ana, Avelino Corma, and Hermenegildo García. "Titania Supported Gold Nanoparticles as
Photocatalyst." Physical Chemistry Chemical Physics13.3 (2010): 886.
4] Jain, S., D. G. Hirst, and J. M. O’Sullivan. "Gold Nanoparticles as Novel Agents for Cancer
Therapy." British Journal of Radiology 85.1010 (2012): 101-13.
5] Saha, Krishnendu, Sarit S. Agasti, Chaekyu Kim, Xiaoning Li, and Vincent M. Rotello. "Gold
Nanoparticles in Chemical and Biological Sensing." Chemical Reviews (2012).
6] L. Rodriguez-Lorenzo, R.A. Alvarez Puebla, F. Garcia de Bajo, L.M. Liz-Maran. J. Phys. Chem. C 114
(16) (2010) 7336-7340.
7] Leru,E.c.,Blackie.e., M.Meyer,and P.g.Etchegoin. "Surface Enhanced RamanScattering Enhancement
Factors: A Comprehensive Study." Journal of Physical Chemistry C 111.37 (2007): 13794-3803.
8] H. Peng, H. Dong-xue, N. Li, L. Hai Bo. Chem. Res. Chin. Univ. 22 (2006) 493-499.
9] Gee, Nick. "Gold Nanoparticles: Strange Properties and Applications." YouTube. InnovaBiosciences.
10] Ghosh, Sujit Kumar, and Tarasankar Pal. "Interparticle Coupling Effect on the Surface Plasmon
Resonance of Gold Nanoparticles: From Theory to Applications." Chemical Reviews 107.11 (2011):4797-
862.
11] Matt7hdh. "ELI5: Surface Plasmon Resonance." Reddit.
12] Kirby, Brian J. Micro- and Nanoscale Fluid Mechanics: Transport in Microfluidic Devices. New York:
Cambridge UP, 2010.
13] Greenwood, R; Kendall, K (1999). "Electroacoustic studies of moderately concentrated colloidal
suspensions". Journal of the European Ceramic Society 19 (4): 479–488.