Download to read offline
![Sources:
1) ‘An inclusive growth monitor for measuring the relationship between poverty and growth’ (2016) by Christina
Beatty, Richard Crisp, and Tony Gore at the Centre for Regional Economic and Social Research, Sheffield
Hallam University https://www.jrf.org.uk/report/inclusive-growth-monitor and
http://www4.shu.ac.uk/research/cresr/sites/shu.ac.uk/files/jrf-inclusive-growth-technical-notes.pdf
2) Inclusive Growth Analysis Unit (IGAU) at http://www.cities.manchester.ac.uk [including datasets for 39 LEPs]](https://image.slidesharecdn.com/4slidesemmastone-170120145124/85/JRF-Inclusive-Growth-Solving-Poverty-Sheffield-2-320.jpg)

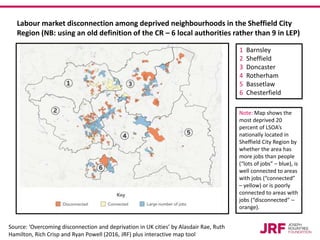

1) The document discusses inclusive growth and solving poverty in Sheffield, England. It examines labour market disconnection among deprived neighborhoods in the Sheffield City Region. 2) The document references two sources on measuring the relationship between poverty and growth, including a 2016 report by the Centre for Regional Economic and Social Research. 3) It presents a map showing the most deprived 20% of neighborhoods in the Sheffield City Region, designating areas as having many jobs, being well connected to job areas, or being poorly connected to job areas.