TrustArc Webinar - Stay Ahead of US State Data Privacy Law Developments
Slides for etsap web
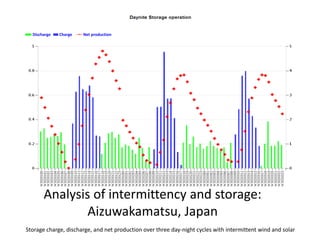
1. Storage charge, discharge, and net production over three day-night cycles with intermittent wind and solar
Analysis of intermittency and storage:
Aizuwakamatsu, Japan
Net productionDischarge Charge
2. Using many runs to parametrically explore
uncertainty space
On shore Wind
OffshoreWind
No Grid Expansion
Grid Expansion
The example shows 100 runs exploring capacity build patterns under scenarios varying carbon price,
technology availability and cost, and transmission grid expansion in a Japan multi-region TIMES model.
3. Level of process detail is analysis-driven
In the US multi-region model FACETS, individual industrial boilers and electricity generating units (EGU)
were represented, each with their own technology retrofit options for NOx emissions reduction.
4. Combining policy-relevant scenario dimensions
This online portal from the IMRT India TIMES model summarizes results from 288 runs combining
variations on seven variables: air pollutant emissions limits, coal mining capacity, coal and gas prices,
solar investment costs, and policies prescribing minimum investments in renewable and nuclear
generation and maximum shares of electricity from imported fuels.
5. Modeling variations on complex policies
The US model FACETS was used to analyze many variations of the upcoming US EPA regulation on
carbon emissions from existing power plants (Section 111d of the Clean Air Act), permuting alternate
policy designs along with gas and technology prices.
6. Carbon capture and storage on the Iberian peninsula
In the Pan-European TIMES model, development of infrastructure to transport captured carbon to
underground storage sites was analyzed.
7. Relative Roles of Efficiency vs. Cl vs. Demand Reduction
Role of Energy Efficiency, Carbon Intensity and Demand Reduction in California under severe
mitigation scenarios
Demand reduction has the most significant contribution in the short-term and carbon intensity
reduction is the dominant contributor in the long-term. Efficiency improvement is more
important in the Residential sector compared to Commercial.
9. Power production investment cost
(relative to CPI scenario, annualised, average 2050)
Increase in annual Power sector investment costs in Europe under different technology scenarios
Power sector options are examined in 3 alternate technology scenarios for Europe: Optimistic
Renewable Energy, Pessimistic Renewable Energy and Optimistic Nuclear
10. Results: Total energy system costs
(relative to total energy system cost in 2020 of CPI scenario)
Increase in total energy system costs in Europe under different technology scenarios
System costs are examined in 3 alternate technology scenarios for Europe: Optimistic Renewable
Energy, Pessimistic Renewable Energy and Optimistic Nuclear.
11. Primary energy (2050)
(GIC as reported by Eurostat – non energy use – fuel consumption by aviation – Maritime bunker)
Alternate scenarios for very low-carbon energy system in Belgium
12. Energy systems modelling for UK policy
History and evolution of ETSAP tools usage in the UK
ETSAP tools are playing an important role in the policy process of several countries.
13. Energy flows in Portugal in 2050 – Low C Road Map (2012)
A low carbon road map for Portugal
The TIMES methodology is very strong on modeling energy storage technologies, allowing charge and discharge over seasonal, weekly, and time of day. In this analysis in the Fukushima region of Japan, Monte Carlo analysis over 8,760 hourly probability distributions for wind and solar availability factors developed from historical data was used to assess storage and backup needs in order to power Aizuwakamatsu city entirely with renewable generation.
The model built and operated wind, solar, storage, and gas backup facilities to meet demand at least cost. The effects of changing wind and solar variability were then tested. Storage and backup capacity needs were fairly consistent up to the actual historical variability. Further increasing variability led to decreased wind and increased solar capacity, increasing the need for backup capacity and daily storage, while decreasing the needed seasonal storage.
The example shows 100 runs exploring capacity build patterns under scenarios varying carbon price, technology availability and cost, and transmission grid expansion in a Japan multi-region TIMES model. Shown here: scenario results for capacity of onshore and offshore wind in 2050. (Each circle depicts one scenario’s results.) Permitting or disallowing grid expansion leads to a bifurcation in results for onshore and offshore wind builds. Without grid investment (dark blue circles), onshore wind development is limited, and offshore wind is further developed. With grid expansion (light green circles), onshore wind can be further developed.
In the US multi-region model FACETS, individual industrial boilers and electricity generating units (EGU) were represented, each with their own technology retrofit options for NOx emissions reduction. The map shows emissions at each site. This level of detail can be turned on and off as analysis needs dictate.
This online portal from the IMRT India TIMES model summarizes results from 288 runs combining variations on seven variables: air pollutant emissions limits, coal mining capacity, coal and gas prices, solar investment costs, and policies prescribing minimum investments in renewable and nuclear generation and maximum shares of electricity from imported fuels. The portal provides a user-friendly way to explore the impacts these variables have on power sector configuration and emissions. Portal is available here: http://vedaviz.com/Portal/Playground.aspx?p=IMRT23Dec14&g=a24c44
The US model FACETS was used to analyze many variations of the upcoming US EPA regulation on carbon emissions from existing power plants (Section 111d of the Clean Air Act), permuting alternate policy designs along with gas and technology prices. The TIMES user constraint facility allows this complex policy to be modeled in detail.
The graphs show the differences between runs in which interstate trade in compliance credits was and was not allowed. We see increased coal use and less gas and wind when interstate 111d credit trading is allowed. This difference is heighten when new gas combined cycle units are included in the compliance budget (CY scenarios on the right side). More details on this analysis are available at http://facets-model.com/111d.
In the Pan-European TIMES model, development of infrastructure to transport captured carbon to underground storage sites was analyzed. Over 100 locations were identified in the three countries where CO2 could be captured economically. Several potential onshore and offshore storage sites were also input to the model. The map shows CO2 flows between emission clusters and storage sites. Free network formation is compared with a case where it mirrors the existing gas network in the Iberian peninsula.