Actual Cost Vs Plan Projection PowerPoint Presentation Slides
homework
1. Part B2: Discuss the project’s current status based on the metric’s
Due to some issueswithschedulingthe projectwasadjusted whichin additionwe added123
workdaystothisupdateddate.
The measurementsbelowprovidesinsightintothe projectperformance uptoandincluding76 days
intothe project.Thisdata was collectedfromprojectsleadersreportingandmetricsextrapolated
herein.
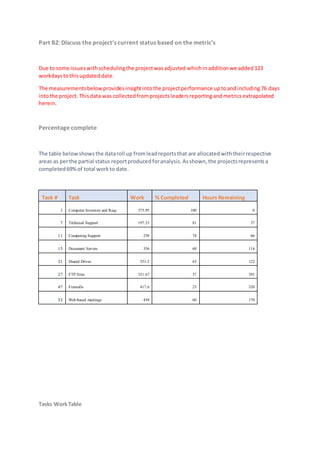
Percentage complete
The table belowshowsthe dataroll up fromleadreportsthat are allocatedwiththeirrespective
areas as perthe partial status reportproducedforanalysis.Asshown,the projectsrepresentsa
completed69%of total workto date.
Task # Task Work % Completed Hours Remaining
1 Computer Inventoryand Reqs 375.95 100 0
7 Technical Support 197.33 81 37
11 ComputingSupport 258 74 66
15 Document Servers 356 68 114
21 Shared Drives 351.2 65 122
27 FTP Sites 321.67 37 391
47 Firewalls 417.6 23 320
52 Web-based meetings 430 60 170
Tasks WorkTable
2. Task Name Critical
Work
Completed
Remaining
Work
Total
Work
Baseline
Finish
Actual
Finish Completed
Inventory computer inuse by the
telecommuters Yes 151.6 0 151.6 24-Jan 24-Jan Yes
Determine requirements to use current
computers Yes 72 0 72 14-Feb 14-Feb Yes
Identify computers for upgrade Yes 72 0 72 27-Feb 27-Feb Yes
Determine requirements for
technology Yes 48.8 0 48 6-Mar 6-Mar Yes
Report outcomes for inventory and
requirements Yes 31.55 0 31.55 9-Mar 9-Mar Yes
Determine technical support needed No 105 0 104 28-Mar 28-Mar Yes
Identify staff requirements tech
support No 53.33 0 53.33 9-Apr 9-Apr Yes
Report technical support needs and
staff req No 40 36.67 3.33 17-Apr N/A No
Identify reqcomputer support relative
to inventory No 152 0 152 30-Mar 30-Mar Yes
Identify staff requirements No 66 26 40 16-Apr N/A No
Report of computer support needs and
staff req No 40 40 0 1-May N/A No
Determine server management
requirements No 114 0 114 23-Mar 23-Mar Yes
Determine server requirements and
location No 48 0 48 30-Mar 30-Mar Yes
Install document servers No 94 14 80 11-Apr N/A No
Test document server connections No 60 60 0 1-May N/A No
Implement documents servers No 40 40 0 3-May N/A No
Determine shared drive management
req No 48 0 48 16-Mar 16-Mar Yes
Determine shared drive req and
location No 67.2 0 67.2 27-Mar 27-Mar Yes
Install share drives No 96 0 96 5-Apr 5-Apr Yes
Test share drives connection No 100 82.4 17.6 24-Apr N/A No
Implement share drives No 40 40 0 26-Apr N/A No
Determine locations of FTP services Yes 68 0 68 23-Mar 23-Mar Yes
Disable anonymous access Yes 44 0 44 29-Mar 29-Mar Yes
Enable log in Yes 47 2 47 4-Apr 4-Apr Yes
Set permissions No 14.67 0 14.67 9-Apr 9-Apr Yes
Set log on time restrictions No 20 12 8 10-May N/A No
Limited log on attempts No 20 20 0 25-May N/A No
Marcia E. Bravo April 21, 2015
Totals All 2707.75 69% 1220
The resultsisa difference of 10hours of work incorrectlyreported.The corrected percentage
complete forthe project59% completedbasedonthe leadsdata.
Earned Value (EVM):
7. The figuresbelowshow a cost overrun of $24,630 ifwe order desktopequipmentand ifwe order
laptop equipmentwe have an overrun $27,431.
BAC EAC ETC
Labor Costs
$
173,329.43
$
186,560.09
$
13,230.66
Systems
Costs
$
73,670.57
$
85,070.57
$
11,400.00
$ -
$
87,870.57
$
14,200.00
32 Setpermissions $ 1,053.33 $ 1,400.00 $ 1,053.33
$
-
$
346.67 Yes
33 Setlogontime restrictions $ 1,400.00 $ 1,400.00 $ 620.00
$
780.00
$
780.00 No
34 Limited logonattempts $ 1,400.00 $ 1,400.00 $ -
$
1,400.00
$
1,400.00 No
35 Enable account lockout $ 1,400.00 $ 1,400.00 $ -
$
1,400.00
$
1,400.00 No
36 LimitIP address range access $ 1,400.00 $ 1,400.00 $ -
$
1,400.00
$
1,400.00 No
37 Aduitlog-onattempts $ 1,400.00 $ 1,400.00 $ -
$
1,400.00
$
1,400.00 No
38 Setstrongpassword requirement $ 840.00 $ 840.00 $ -
$
840.00
$
840.00 No
40 Determine settingsforeach user $ 2,520.00 $ 2,520.00 $ 1,260.00
$
1,260.00
$
1,260.00 No
41 Configuresettingsfor each user $ 4,200.00 $ 4,200.00 $ -
$
4,200.00
$
4,200.00 No
43 Identify quotasfor each disk $ 2,520.00 $ 2,520.00 $ 2,208.00
$
312.00
$
312.00 No
44 Identify quotasfor each user $ 2,520.00 $ 2,520.00 $ -
$
2,520.00
$
2,520.00 No
45 TestConnections $ 8,640.00 $ 8,640.00 $ -
$
8,640.00
$
8,640.00 No
46 Implement FTP sites $ 2,800.00 $ 2,800.00 $ -
$
2,800.00
$
2,800.00 No
48 Determine protocols $ 5,520.00 $ 6,000.00 $ 5,520.00
$
-
$
480.00 Yes
49 Implement selected protocols $ 1,800.00 $ 1,800.00 $ 1,800.00
$
-
$
- Yes
50 Testvulnerabilities $ 12,000.00 $ 12,000.00 $ -
$
12,000.00
$
12,000.00 No
51
Finalizefilters andmonitoring
systems $ 12,000.00 $ 12,000.00 $ -
$
12,000.00
$
12,000.00 No
53
Testand evaluate web-based
meetings withpilotgroup $ 15,300.00 $ 5,400.00 $ 15,300.00
$
-
$
9,900.00 Yes
54
Develop software updates for
computers $ 6,480.00 $ 6,480.00 $ -
$
6,480.00
$
6,480.00 No
55
Testweb-based meetings with
larger groups $ 2,700.00 $ 2,700.00 $ -
$
2,700.00
$
2,700.00 No
8. $
85,070.57 Desktops
$
11,400.00
$
87,870.57 Laptops
$
14,200.00
These are fundsbeingrequestedinadditiontowhathave projected,thatwaywe close of the
project. We are overbudgetsothisquickbreakdownshowsyouwhatwe needasfar as extra
funding.
-
$24,630.66 Desktops
-
$27,430.66 Laptops
Part B3: Analyze three problemsthat currentlyexistbased on these metrics
In thispart discusshowthree problemscouldaffectimplementationandpost- projectsuccessand
howyou wouldmitigate oreliminateeachproblemthatmayarise.
Critical Path resource load balancing
FTP Tasks
Our critical pathcouldbe impactedina positive wayvsnegative way. Itcanbe impactedby6 days
giventhe approachof loadbalancingthe remainingFTPworkusingKendrick,whoisaninexpensive
resource whichwill leadtoussavingmoney.
The table belowis a summary a across FTP tasks:
Hypothetical case to loadbalance resourcesacross FTP tasks:
Resource
Cost Per
Hour
Work
Completed
Cost
Completed
Work
Remaining
Cost
Remaining
Total Labor
Cost
Zeke
$
65.00 153
$
9,945.00 245
$
15,925.00
$
25,870.00
Kendrick
$
60.00 86
$
5,160.00 0 $ -
$
5,160.00
Clemncia
$
75.00 104
$
7,800.00 114
$
8,550.00
$
16,350.00
Summary
$
63.23 1788
$
111,392.00 1220
$
76,516.00
$
187,908.00
9. Resource
Cost Per
Hour
Work
Completed
Cost
Completed
Work
Remaining
Cost
Remaining
Total Labor
Cost
Zeke
$
65.00 153
$
9,945.00 120
$
7,800.00
$
17,745.00
Kendrick
$
60.00 86
$
5,160.00 120
$
7,200.00
$
12,360.00
Clemncia
$
75.00 104
$
7,800.00 119
$
8,925.00
$
16,725.00
Summary
$
63.23 1788
$
111,392.00 1220
$
75,966.00
$
187,358.00
Method1 to estimate CP savings of FTP tasks:
WhencalculatingCPsavingswe use the long-poleestimate of 23 days remainingduringthe duration
of eachtasks,followedbycalculatingbasedonastart date fromthe day the status reportwas
generated.Whichwill give usasavingsof 6 daysoff the currentCP.
Method2 to estimate CP savings of FTP tasks:
Firewall Tasks
Deliverable Qualityand Team Efficiency
UserAdoption
10. ProcurementsManagement
Budget adjustment
PreviouslyitwasmentionedbyourCEO that firewall expensecouldbe disregardedfromthe project
budgetandallocatedtowardsthe IT teambudget.Thiswouldhelpuswithbeingonthe propertrack
course and not fallingbehind.Thisover –all couldhave apositive impactof savingsroughlyof 20k
whichwouldputus backin range withor budget.
Part C: Executive Summary
For thispart prepare andexecutive summaryforthe projectsponsorthatcommunicatesyour
analysisandrecommendationsfrompartsA and B.
Summary:
Lookingback intoourdata, if we analzye the projectwe show that we will come inonor around the
completiondate we have.Thisalsoincludesanyset-backs.The onlythingwe will require forthisis
resource reallocation whichwe will needanadditional 4-7kandwe will alsorequire forthe firewall
expensestobe sentto our IT team, that waywe can have our budgetcurrentwitwhat we originally
projected.Thatwaywe ensure thatthe entire scope of the projectandschedule restrictionsare met
and that we do notexperience anymore set-backsof the project.
Details:
Goingback to the budget,we had a fewissuesthatwe can classifyasMajor or Critical onthe
budget,whichimpactedorprojectedBAC.One of the majorissueswe hadwasexpenseswasadding
extraequipment,anothermajorissueswasthatwe neededtoupgrade 12 of the 35 computerswe
had whichalsoincreasedourbudgetthreshold. These issuesheldusupwithdelaysdue toitbeing
unforeseenissueswe encounteredandnew approvalsforbudgets.
11. The belowtable showsyououroptionsasfar as additional cost.Tosave moneyitwouldbe cheaper
to orderdesktopsvslaptopsasyou can see.These chargesare inadditiontoour projectedbudget,
whichwouldmake usgo overour goal.
-
$24,630.66 Desktops
-
$27,430.66 Laptops
Cost Performance:
The belowgraphwill showyouthe efficiency of the projectisdecreasingwithtime.OurCPItrend-
line indownwardprojection.
Completed Actual Cost
Remaining
Cost Total Cost
Work
Completed
Remaining
Work
Total
Work
No
$
12,188.33
$
79,315.27
$
91,503.60
$
198.13
$
1,209.87
$
1,408.00
Yes
$
95,056.49 $ -
$
95,056.49
$
1,589.75 $ -
$
1,589.75
Total
$
107,244.82
$
79,315.27
$
186,560.09
$
1,787.88
$
1,209.87
$
2,997.75
CV -$812.00 -$812.00 -$812.00 -$1,712.00 -$1,712.00 -$4,112.00 -$2,693.73 -$2,045.73 -$2,157.73 -$5,528.53 -$16,891.86
Cummulative
EV
$
10,150.00
$
10,150.00
$
10,150.00
$
14,650.00
$
14,650.00
$
17,650.00
$
25,021.43
$
28,261.43
$
39,001.43
$
59,591.43
$
83,505.43
Cummulative
AC
$
10,962.00
$
10,962.00
$
10,962.00
$
16,362.00
$
16,362.00
$
21,762.00
$
27,715.16
$
30,307.16
$
41,159.16
$
65,119.96
$
100,397.29
CPI
$
0.93
$
0.93
$
0.93
$
0.90
$
0.90
$
0.81
$
0.90
$
0.93
$
0.95
$
0.92
$
0.83
-$50,000.00
$0.00
$50,000.00
$100,000.00
$150,000.00
1 2 3 4 5 6 7 8 9 10 11
Cost Performance Chart
CV Cummulative EV Cummulative AC CPI
13. 3 27-Feb $ - $10,150.00
4 6-Mar $4,500.00 $14,650.00
5 9-Mar $3,000.00 $17,650.00
6 28-Mar $18,290.00 $35,940.00
7 9-Apr $2,971.43 $38,911.43
8 17-Apr $5,400.00 $44,311.43
9 30-Mar $ - $44,311.43
10 16-Apr $4,680.00 $48,991.43
11 1-May $30,554.00 $79,545.43
12 23-Mar $7,600.00 $87,145.43
13 30-Mar $ - $87,145.43
14 11-Apr $25,764.00 $112,909.43
15 1-May $11,420.00 $124,329.43
16 3-May $15,200.00 $139,529.43
17 16-Mar $2,800.00 $142,329.43
18 27-Mar $12,000.00 $154,329.43
19 5-Apr $1,400.00 $155,729.43
20 24-Apr $2,800.00 $158,529.43
21 26-Apr $2,800.00 $161,329.43
22 23-Mar $12,000.00 $173,329.43
23 29-Mar $ - $173,329.43
Scope
The biggest issue we have is assuring that our customers accept our revised business model. We have
been advised that we will need to test and conduct a gat herring process to validate the business scope
and assure that our customers are satisfied with this model. We have received fee-back that customers
are concerned about the cost increase in services as well as a decrease in service. This could lead to a
negative impact in loss of business, so we need to assure that we do not experience any loss of
business and all parties are contempt with the new model.
We have restricted severalof our resources to assure the project meets the deadline and we are
effective with scheduling and all teams deliver their part on time. That way we avoid any more issues
or delays.
Next Steps
The project is incomplete as of now and at 59% completion rate. The table below represents all the
incomplete tasks that we currently have as open. Anything that is critical is highlighted in red and
14. those critical tasks should be done first if it falls in line with the work step by step and has no impact
on the overall tasks.
Task# Task Name Critical
Work
completed
Remaining
Work
Total
Work
10
Report technical
support needs and
staffreq no 3.33 36.67 40.00
13
Identify staff
requirements no 40.00 26.00 66.00
14
Report ofcomputer
support needs and
staffreq no 0.00 40.00 40.00
18
Install document
servers no 80.00 14.00 94.00
19
Test document server
connections no 0.00 60.00 60.00
20
Implement
documents servers no 0.00 40.00 40.00
25
Test share drives
connection no 17.60 82.40 100.00
26
Implement share
drives no 0.00 40.00 40.00
33
Set log on time
restrictions no 8.00 12.00 20.00
34
Limited log on
attempts no 0.00 20.00 20.00
35
Enable account
lockout no 0.00 20.00 20.00
36
Limit IP address
range access no 0.00 20.00 20.00
37
Aduit log-on
attempts no 0.00 20.00 20.00
38
Set strong password
requirement no 0.00 12.00 12.00
40
Determine settings
foreach user yes 18.00 18.00 36.00
41
Configure settings
foreach user yes 0.00 60.00 60.00
43
Identify quotas for
each disk no 31.20 4.80 36.00
44
Identify quotas for
each user no 0.00 36.00 36.00
45 Test Connections yes 0.00 128.00 128.00
46 Implement FTP sites yes 0.00 40.00 40.00
50 Test vulnerabilities yes 0.00 160.00 160.00
51
Finalize filters and
monitoring systems yes 0.00 160.00 160.00
54
Develop software
updates for
computers no 0.00 0.00 0.00
55
Test web-based
meetings with larger
groups no 0.00 160.00 160.00