Raddon Chart of the Day March 22, 2012
•Download as PPTX, PDF•
0 likes•303 views


Recommended
Recommended
More Related Content
What's hot
What's hot (15)
Similar to Raddon Chart of the Day March 22, 2012
Similar to Raddon Chart of the Day March 22, 2012 (20)
More from Raddon Financial Group
More from Raddon Financial Group (20)
Recently uploaded
Recently uploaded (20)
Raddon Chart of the Day March 22, 2012
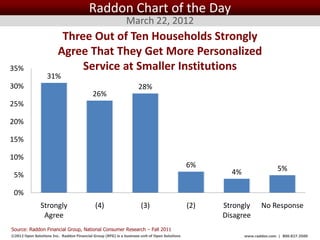
- 1. Raddon Chart of the Day March 22, 2012 Three Out of Ten Households Strongly Agree That They Get More Personalized 35% Service at Smaller Institutions 31% 30% 28% 26% 25% 20% 15% 10% 6% 5% 5% 4% 0% Strongly (4) (3) (2) Strongly No Response Agree Disagree Source: Raddon Financial Group, National Consumer Research – Fall 2011 ©2012 Open Solutions Inc. Raddon Financial Group (RFG) is a business unit of Open Solutions Inc. www.raddon.com | 800.827.3500
- 2. Raddon Chart of the Day March 20, 2012 Only One Out of Ten Households Strongly Agree that Big Institutions are Better for Checking 35% Because of their Branches and ATMs 31% 30% 25% 20% 18% 19% 16% 15% 10% 10% 6% 5% 0% Strongly (4) (3) (2) Strongly No Response Agree Disagree Source: Raddon Financial Group, National Consumer Research – Fall 2011 ©2012 Open Solutions Inc. Raddon Financial Group (RFG) is a business unit of Open Solutions Inc. www.raddon.com | 800.827.3500
- 3. Raddon Chart of the Day March 15, 2012 One-Fifth of All Households Strongly Agree that Smaller Institutions Have Online 40% Technology as Good as Big Institutions 35% 34% 30% 25% 23% 24% 20% 15% 10% 10% 6% 5% 4% 0% Strongly (4) (3) (2) Strongly No Response Agree Disagree Source: Raddon Financial Group, National Consumer Research – Fall 2011 ©2012 Open Solutions Inc. Raddon Financial Group (RFG) is a business unit of Open Solutions Inc. www.raddon.com | 800.827.3500
- 4. Raddon Chart of the Day March 13, 2012 One-Fifth of All Households Strongly Agree that it Would be Difficult For Them to Move 30% Their Checking Account to a New Bank 25% 24% 21% 20% 20% 18% 15% 13% 10% 5% 4% 0% Strongly (4) (3) (2) Strongly No Response Agree Disagree Source: Raddon Financial Group, National Consumer Research – Fall 2011 ©2012 Open Solutions Inc. Raddon Financial Group (RFG) is a business unit of Open Solutions Inc. www.raddon.com | 800.827.3500
- 5. Raddon Chart of the Day March 8, 2012 One-Third of All Households Strongly Agree that the Big Bank Bailouts Make Them 40% Less Likely to Use One of the “Big Banks” 35% 35% 30% 30% 25% 20% 17% 15% 10% 7% 6% 5% 4% 0% Strongly (4) (3) (2) Strongly No Response Agree Disagree Source: Raddon Financial Group, National Consumer Research – Fall 2011 ©2012 Open Solutions Inc. Raddon Financial Group (RFG) is a business unit of Open Solutions Inc. www.raddon.com | 800.827.3500
- 6. Raddon Chart of the Day March 6, 2012 Top Five Reasons Why Consumers Have Closed a Checking Account in the Last 12 Months Fees on Account Changed 28% Poor Service 24% Difficulty Resolving Problems with Account 23% Institution Eliminated/Stopped Offering Free Checking 22% Mistakes on Account 20% 0% 5% 10% 15% 20% 25% 30% Source: Raddon Financial Group, National Consumer Research – Fall 2011 ©2012 Open Solutions Inc. Raddon Financial Group (RFG) is a business unit of Open Solutions Inc. www.raddon.com | 800.827.3500
- 7. Raddon Chart of the Day March 1, 2012 Consumers That Have Closed a Checking Account in the Last 12 Months 9% Closed an Account in the Last 12 Months Have Not Closed an Account in the Last 12 Months 91% Source: Raddon Financial Group, National Consumer Research – Fall 2011 ©2012 Open Solutions Inc. Raddon Financial Group (RFG) is a business unit of Open Solutions Inc. www.raddon.com | 800.827.3500
- 8. Raddon Chart of the Day February 28, 2012 Number of Checking Accounts Owned by a Household 60% 53% 50% 40% 32% 30% 20% 15% 10% 0% One Two Three or More Source: Raddon Financial Group, National Consumer Research – Fall 2011 ©2012 Open Solutions Inc. Raddon Financial Group (RFG) is a business unit of Open Solutions Inc. www.raddon.com | 800.827.3500
- 9. Raddon Chart of the Day February 23, 2012 Consumers That Have Ever Clicked on Any Company’s Advertising/Promotions/Special Offers On A Social Networking Website 13% Have Clicked on an Ad Have Not Clicked on an Ad 87% Source: Raddon Financial Group, National Consumer Research – Fall 2011 ©2012 Open Solutions Inc. Raddon Financial Group (RFG) is a business unit of Open Solutions Inc. www.raddon.com | 800.827.3500
- 10. Raddon Chart of the Day February 21, 2012 Consumers That Have Ever “Logged On” 70% or Visited A Social Networking Website 60% 58% 54% 50% 40% 30% 20% 17% 10% 9% 8% 10% 3% 0% Any Social Facebook Linked In Twitter Classmates MySpace Other Networking Website Source: Raddon Financial Group, National Consumer Research – Fall 2011 ©2012 Open Solutions Inc. Raddon Financial Group (RFG) is a business unit of Open Solutions Inc. www.raddon.com | 800.827.3500
- 11. Raddon Chart of the Day February 16, 2012 Consumers That Have a Data Plan For Their Mobile Devices 34% Have a Data Plan Do Not Have a Data Plan 66% Source: Raddon Financial Group, National Consumer Research – Fall 2011 ©2012 Open Solutions Inc. Raddon Financial Group (RFG) is a business unit of Open Solutions Inc. www.raddon.com | 800.827.3500
- 12. Raddon Chart of the Day February 14, 2012 Consumers Use of a Personal Financial Management Software Program 2% 13% Use PFM Software Program Do Not Use PFM Software Program Do Not Know 85% Source: Raddon Financial Group, National Consumer Research – Fall 2011 ©2012 Open Solutions Inc. Raddon Financial Group (RFG) is a business unit of Open Solutions Inc. www.raddon.com | 800.827.3500
- 13. Raddon Chart of the Day February 9, 2012 Online Services Consumers Currently Use E-Statements 38% Check Imaging 34% Order Checks 27% PtoP Payment 27% E-Mail Fraud Alert 15% E-Mail Balance Alert 14% E-Mail Dir. Dep. Alert 9% Text Balance Alert 5% Text Fraud Alert 3% Text Dir. Dep. Alert 3% 0% 5% 10% 15% 20% 25% 30% 35% 40% Source: Raddon Financial Group, National Consumer Research – Fall 2011 ©2012 Open Solutions Inc. Raddon Financial Group (RFG) is a business unit of Open Solutions Inc. www.raddon.com | 800.827.3500
- 14. Raddon Chart of the Day February 7, 2012 Financial Activities Consumers Have Performed While Online in the Past Two Years Shopped for a Loan 13% Applied for a Loan 10% Shopped for a Savings Account 7% Opened a Savings Account 7% Shopped for a Checking Account 6% Shopped for a CD 6% Opened a Loan 5% Opened a Checking Account 5% Opened a CD 3% 0% 2% 4% 6% 8% 10% 12% 14% Source: Raddon Financial Group, National Consumer Research – Fall 2011 ©2012 Open Solutions Inc. Raddon Financial Group (RFG) is a business unit of Open Solutions Inc. www.raddon.com | 800.827.3500
- 15. Raddon Chart of the Day February 1, 2012 Value Consumers Place on a 35% Debit Card Courtesy Pay Service 30% 31% 30% 27% 25% 20% 15% 13% 10% 5% 0% Extremely Valuable Somewhat Valuable Not Very Valuable Not at All Valuable Source: Raddon Financial Group, National Consumer Research – Fall 2011 ©2012 Open Solutions Inc. Raddon Financial Group (RFG) is a business unit of Open Solutions Inc. www.raddon.com | 800.827.3500
- 16. Raddon Chart of the Day January 19, 2012 Acceptable Changes For Future Debit Card Use Small Fee Charged per Each Use 4% Purchase Limit of $100 per Use 2% Monthly Charge 2% Yearly Fee 1% Purchase Limit of $50 per Use 1% None of the Above – Would Stop Using My Debit Card 32% None of the Above – Would Look for Another Provider without Charges 47% Do Not Use a Debit Card 31% 0% 10% 20% 30% 40% 50% Source: Raddon Financial Group, National Consumer Research – Fall 2011 ©2012 Open Solutions Inc. Raddon Financial Group (RFG) is a business unit of Open Solutions Inc. www.raddon.com | 800.827.3500
- 17. Raddon Chart of the Day January 17, 2012 Consumers’ That Have Had a Debit Card Purchase Denied In the Last Six Months 4% Have Had a Debit Card Purchase Denied Have Not Had a Debit Card Purchase Denied 96% Source: Raddon Financial Group, National Consumer Research – Fall 2011 ©2012 Open Solutions Inc. Raddon Financial Group (RFG) is a business unit of Open Solutions Inc. www.raddon.com | 800.827.3500
- 18. Raddon Chart of the Day January 12, 2012 Consumers’ Likelihood to Use a Smart ATM to Deposit Funds 30% 25% 25% 25% 24% 20% 15% 15% 11% 10% 5% 0% Extremely Likely Very Likely Somewhat Likely Not Very Likely Not at All Likely Total Source: Raddon Financial Group, National Consumer Research – Fall 2011 ©2012 Open Solutions Inc. Raddon Financial Group (RFG) is a business unit of Open Solutions Inc. www.raddon.com | 800.827.3500
- 19. Raddon Chart of the Day January 10, 2012 Reasons Why Consumers Will Not Use an ATM to Deposit Funds I Prefer Dealing Directly with a Teller When 58% Depositing Funds I Never Use ATMs 23% No Need – I Don’t Get Any Non-Payroll 21% Checks I Don’t Trust ATMs – I Worry about Mistakes 15% There Are No ATMs Convenient for Me to 4% Use 0% 10% 20% 30% 40% 50% 60% 70% Source: Raddon Financial Group, National Consumer Research – Fall 2011 ©2012 Open Solutions Inc. Raddon Financial Group (RFG) is a business unit of Open Solutions Inc. www.raddon.com | 800.827.3500
- 20. Raddon Chart of the Day January 6, 2012 Consumers That Have Deposited Funds Into an ATM 33% 67% Have Deposited Funds into an ATM Have Not Deposited Funds into an ATM Source: Raddon Financial Group, National Consumer Research – Fall 2011 ©2012 Open Solutions Inc. Raddon Financial Group (RFG) is a business unit of Open Solutions Inc. www.raddon.com | 800.827.3500
- 21. Raddon Chart of the Day January 4, 2012 Consumers Remote Deposit Capture Use and Likelihood to Use Such a Service 40% 37% 35% 30% 28% 25% 20% 17% 15% 10% 8% 6% 5% 4% 0% Currently Use Extremely Very Likely Somewhat Not Very Not at All Likely Likely Likely Likely Source: Raddon Financial Group, National Consumer Research – Fall 2011 ©2012 Open Solutions Inc. Raddon Financial Group (RFG) is a business unit of Open Solutions Inc. www.raddon.com | 800.827.3500