Financial Leverage Definition, Advantages, and Disadvantages
Quarterly report on deposits september 2011 b
1. QUARTERLY REPORT ON DEPOSITS
SEPTEMBER 2011
TOTAL DEPOSITS* DEPOSIT GROWTH
by Bank Type Sep 2010 and Sep 2011
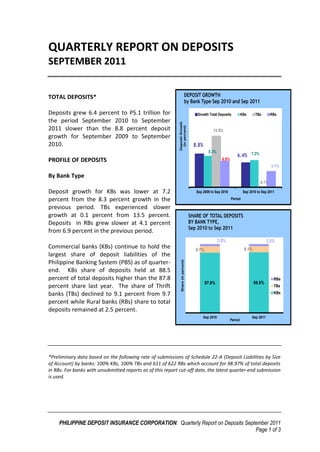
Deposits grew 6.4 percent to P5.1 trillion for Growth Total Deposits KBs TBs RBs
the period September 2010 to September
Deposit Growth
(in percent)
2011 slower than the 8.8 percent deposit 13.5%
growth for September 2009 to September
2010. 8.8%
8.3%
6.4% 7.2%
PROFILE OF DEPOSITS 6.9%
4.1%
By Bank Type
0.1%
Deposit growth for KBs was lower at 7.2 Sep 2009 to Sep 2010 Sep 2010 to Sep 2011
percent from the 8.3 percent growth in the Period
previous period. TBs experienced slower
growth at 0.1 percent from 13.5 percent. SHARE OF TOTAL DEPOSITS
Deposits in RBs grew slower at 4.1 percent BY BANK TYPE,
Sep 2010 to Sep 2011
from 6.9 percent in the previous period.
2.5% 2.5%
Commercial banks (KBs) continue to hold the 9.7% 9.1%
largest share of deposit liabilities of the
Philippine Banking System (PBS) as of quarter-
Share (in percent)
end. KBs share of deposits held at 88.5
percent of total deposits higher than the 87.8 RBs
87.8% 88.5%
percent share last year. The share of Thrift TBs
banks (TBs) declined to 9.1 percent from 9.7 KBs
percent while Rural banks (RBs) share to total
deposits remained at 2.5 percent.
Sep 2010 Sep 2011
Period
*Preliminary data based on the following rate of submissions of Schedule 22-A (Deposit Liabilities by Size
of Account) by banks: 100% KBs, 100% TBs and 611 of 622 RBs which account for 98.97% of total deposits
in RBs. For banks with unsubmitted reports as of this report cut-off date, the latest quarter-end submission
is used.
PHILIPPINE DEPOSIT INSURANCE CORPORATION: Quarterly Report on Deposits September 2011
Page 1 of 3
2. By Deposit Type
Savings deposits continue to dominate the type of deposit products and increasing its
share of deposits at 47.8 percent from 46.2 percent for the same period last year. The
share of Time and LTNCD deposits contracted to 32.6 percent from 35.2 percent while
the share of Demand & NOW deposits increased to 19.5 percent from 18.6 percent of
the total.
SHARE PER DEPOSIT TYPE DEPOSIT GROWTH by Deposit Type
TO TOTAL DEPOSITS, Sep 2010 to Sep 2011 Sep 2010 and Sep 2011
Demand & NOW Savings Time Total
Time/LTNCD Savings Demand & NOW
12.1%
Deposit Growth
10.1%
(in percent)
8.3%
9.9%
8.8%
8.7%
35.2% 32.6%
6.4%
Share (in percent)
46.2% 47.8%
-1.3%
Period
18.6% 19.5%
Sep 2010 Sep 2011 Sep 2009 to Sep 2010 Sep 2010 to Sep 2011
Period
Demand and NOW deposits grew most at 12.1 percent for the period followed by
Savings deposits at 10.1 percent. Time deposits dragged growth of total deposits with a
contraction of 1.3 percent from a growth of 8.3 percent last year.
By Bank Type and Deposit Type
DEPOSIT GROWTH by Bank Type and Deposit Type RBs posted the highest growth rate for
Sep 2010 and Sep 2011
Demand & NOW deposits with 14.6
Demand & NOW Savings Time percent, while growth rate for Time and
LTNCDs was at 14.4 percent. However,
15.6%
14.6%
there was a 1.0 percent contraction in
14.4%
13.5%
12.6%
12.0%
Savings for the period September 2010 to
10.1%
Deposit Growth
9.8%
(in percent)
8.3%
7.4%
September 2011.
6.9%
5.9%
4.4%
1.2%
0.9%
TBs experienced growth of 4.4 percent for
-2.8%
-1.0% Time and LTNCDs, Demand & NOW grew
by 1.2 percent while Savings deposits,
-7.2%
contracted by 7.2 percent.
KBs TBs RBs KBs TBs RBs
Sep 2009 to Sep 2010 Sep 2010 to Sep 2011
Period
PHILIPPINE DEPOSIT INSURANCE CORPORATION: Quarterly Report on Deposits September 2011
Page 2 of 3
3. On the other hand, KBs posted growth for
Demand & NOW deposits at 12.6 percent, SHARE PER DEPOSITOR TYPE
Savings at 12.0 percent and contraction of TO TOTAL DEPOSITS
Sep 2010 to Sep 2011
2.8 percent for Time deposits and LTNCDs.
Non- OBUs OBUs Trust Departments
Individuals Private Corporations Banks
Government
By Depositor Type 1.1%
1.1%
59.5% 54.8%
By September 2011, deposits of Individuals
Share (in percent)
account for 54.8 percent of total deposits,
lower than the 59.5 percent for the
preceding year. The share of Private
Corporations’ deposits increased to 30.2 27.2%
30.2%
percent from 27.2 percent while 10.2% 0.9% 11.4%
1.1%
Government deposits share was up at 11.4
Sep 2010 Sep 2011
percent from 10.2 percent of total deposits Period
for the comparative period.
INSURED DEPOSITS AND THE DEPOSIT INSURANCE FUND
As of end September 2011, deposits Domestic Deposit Liabilities - Philippine Banking System
that are P10,000 and below comprise (Am ounts in MIllion; Accounts in Thousand)
as of September 2011
74.4 percent of total deposits in
terms of number of accounts, but is
Grand Total
only 0.7 percent of total deposits in DEPOSIT SIZE
% to % to
terms of amount. On the other end Account Total Amount Total
of the deposit range, deposits over
P 5,000 & Below 28,588 68.2% 17,275 0.3%
P2.00 million are only 0.8 percent of
P 5,000.01 - P10,000 2,583 6.2% 18,046 0.4%
total deposits in terms of total P 10,000.01 - P15,000 1,556 3.7% 18,466 0.4%
accounts, but takes up 67.5 percent P 15,000.01 - P 40,000 2,815 6.7% 70,188 1.4%
of deposits in terms of amount. P 40,000.01 - P 60,000 1,344 3.2% 64,182 1.3%
P 60,000.01 - P 80,000 639 1.5% 44,071 0.9%
P 80,000.01 - P 100,000 494 1.2% 44,482 0.9%
With the Maximum Deposit P 100,000.01 - P 150,000 913 2.2% 108,964 2.1%
Insurance Cover (MDIC) at P500,000, P 150,000.01 - P 200,000 479 1.1% 82,835 1.6%
total insured deposits as of P 200,000.01 - P 250,000 407 1.0% 90,301 1.8%
P 250,000.01 - P 300,000 260 0.6% 71,295 1.4%
September 2011 stand at P1.47
P 300,000.01 - P 400,000 368 0.9% 125,022 2.5%
trillion, with 97.2 percent of total P 400,000.01 - P 500,000 301 0.7% 136,601 2.7%
accounts fully-insured and only 2.8 P 500,000.01 - P 750,000 363 0.9% 213,249 4.2%
percent of accounts partially insured. P 750,000.01 - P 1,000,000 173 0.4% 153,278 3.0%
P1,000,000.01 - P1,500,000 211 0.5% 245,963 4.8%
P1,500,000.01 - P2,000,000 83 0.2% 143,862 2.8%
The DIF stands at P67.0 billion as of Ov er P 2,000,000 337 0.8% 3,429,300 67.5%
September 2011, which is sufficient
Total 41,914 100.0% 5,077,378 100.0%
to cover 4.5 percent of the P1.47
trillion total insured deposits.
PHILIPPINE DEPOSIT INSURANCE CORPORATION: Quarterly Report on Deposits September 2011
Page 3 of 3