SlideShare a Scribd company logo
1 of 10
Download to read offline
FOMC Sep 2018 statement. Highlights (1)
• Unchanged characterisation of economic activities. Economic activity is seen to be rising at a strong rate, both household spending and
business fixed investment have grown strongly. The labour market has continued to strengthen; job gains have been strong, on average, and the
unemployment rate has stayed low. Job gains averaged “well above the pace” required in the long run to absorb new entrants.
• Risks to the economic outlook remains roughly balanced.
• Impact of trade protectionism, on aggregate, is seen as relatively small. The Chair is taking a wait-and-see approach, with limited
negative impact seen thus far; uncertainties remain over whether negative impact will be realised and if they did, whether to see them as permanent
or one-off adjustments and thus more transitory in nature.
• Inflation mandate fulfilled. Both headline and core prices remain near 2%. Indicators of longer-term inflation expectations are little changed, on
balance.
• Monetary policy conducted with the objective of sustaining the current cycle (via further tightening). The Committee expects that
further gradual increases in the FFR will be consistent with sustained expansion of economic activity, strong labour market conditions and inflation
near the symmetric 2% objective over the medium term. Realized and expected economic conditions will be assessed relative to the i) maximum
employment objective and ii) symmetric 2% inflation target. In determining the timing and size of adjustments to the FFR, the Committee will take
into account a wide range of information including labour market conditions, inflation pressures and expectations, and readings on financial and
international developments.
• The sentence “the stance of policy remains accommodative, thereby supporting strong labour conditions and a sustained return to 2% inflation” was
removed, as widely expected, reflecting rate hikes to date. The Chair highlighted that the change does not imply any change in the policy rate path and
that policy is proceeding in line with expectations. Policy is likely still “accommodative” considering spot to neutral (2.00-2.25% to 3.00%).
• Sound financial system and moderate financial stability risks. Banks are now held to much higher standards with regards to regulations,
capital and liquidity, and in the ways risks are assessed and managed. The Chair deems the financial system as stronger and well-positioned to
support the economy. The Chair too implied that, as of now, he sees no need for a rise in SIFIs’ CCyB. Financial stability risks are, on the whole,
deemed moderate.
FOMC Sep 2018 statement. Highlights (2)
• Pragmatism over forward guidance. Chair implicitly downplays the importance of forward guidance on more than one occasion, highlighting
that forecasts (on the economy and policy) one or two years out are highly uncertain. Many key variables are uncertain and have no precise point
estimates (NAIRU, LFPR, r*, concept of policy “accommodation”). The SEP and FFR dot-plot are individual forecasts based on a range of
expectations which are fairly uncertain and subject to changes on evolving circumstances. The most important consideration, above all, is whether the
current policy stance is appropriate in achieving the statutory goals of the Fed and such decision is taken on a meeting by meeting basis, based on
realised data and expectations on the economy and markets. The gradual approach to policy will help mitigate the long and variable lag nature of
monetary policy adjustments by providing scope for the Committee to make adjustments to policy from the subsequent response of the economy to
prior policy adjustments (data dependency). Such an approach is undertaken as an intermediate path that balances the risks of overheating and
unnecessary tightening that inadvertently cuts short the expansion cycle (which may proof to be sustainable).
• Marking-to-realised for 2018; broadly unchanged thereafter. Median growth rates were upgraded for 2018 and 2019 by 30bps and 10bps to
3.1% (cumulatively +100bps since Dec 17) and 2.5% respectively. 2020, 2021 (new projection) and longer run growth estimates were left at 2.0%,
1.8% and 1.8% respectively. This suggests that most of the impact from fiscal spending were deemed by the Fed to be cyclical rather than structural
(Chair highlighted that supply-side impact are very uncertain and may take some time, if any, to emerge). Unemployment rates barely moved, higher
by 10bps to 3.7% in 2018, unchanged at 3.5% for both 2019-2020, 3.7% and 4.5% in 2021 and longer-run respectively. Core inflation projections were
unchanged, 2.0% in 2018; unchanged at 2.1% 2019 onwards.
• Broadly unchanged path; VC leans hawkish; unchanged terminal and higher neutral. Sep’s Fed’s median expectations, 2018 = 2.375%
(unchanged); 2019 = 3.125% (unchanged; 5:4:7; 11/16 =<Median); 2020 = 3.375% (unchanged; 7:2:7); 2021 = 3.375% (5:4:7) and longer run = 3.00%
(+12.5bps; 2:6:7). This implies that policy will be at neutral in 2Q19 and tight thereafter. With regards to median voting patterns, hawkish/dovish
surprise for 2019, 2020, and 2021 requires 3, 1, and 3 voters and 1, 1, and 1 voter to flip, pointing to a dovish skew in 2019 and 2021 and a more
hawkish skew in 2020. Following a 12.5bps increase to 3%, longer-run projection are more anchored (requires 6 voters to flip hawkish, compared to
just 1 for a more dovish outcome). Number (remaining) of hikes in 2018, 2019 ,2020 and 2021 is 1-3-1-0.
FFRs and money markets
0.00
0.25
0.50
0.75
1.00
1.25
1.50
1.75
2.00
2.25
Jan-15 Jul-15 Jan-16 Jul-16 Jan-17 Jul-17 Jan-18 Jul-18
% Eff FFR IOER 1Mth T-Bills ON RRP Target FFR
0.00
0.25
0.50
0.75
1.00
1.25
1.50
1.75
2.00
2.25
2.50
Jan-15 Jul-15 Jan-16 Jul-16 Jan-17 Jul-17 Jan-18 Jul-18
% IOER 90d CP 90d Libor 90d T-bills 90d OIS Effective FFR
0
500
1,000
1,500
2,000
2,500
3,000
3,500
4,000
4,500
5,000
Jan-00 Jan-02 Jan-04 Jan-06 Jan-08 Jan-10 Jan-12 Jan-14 Jan-16 Jan-18
US$ Bil Fed Total Assets Banks' Reserves Balance
8
9
10
11
12
13
14
15
16
17
2
4
6
8
10
12
Mar-00 Mar-02 Mar-04 Mar-06 Mar-08 Mar-10 Mar-12 Mar-14 Mar-16 Mar-18
Consumer Credit
Interest, %
New Car 5/1Yr ARM CC (RHS) Personal Loans (RHS)
2,000
2,500
3,000
3,500
4,000
4,500
5,000
-10
-5
0
5
10
15
20
25
30
35
40
Jan-10 Jan-11 Jan-12 Jan-13 Jan-14 Jan-15 Jan-16 Jan-17 Jan-18
Federal Reserve, %yoy
Thousands
US$ BilAssets, B/S (RHS) %yoy
Fed policy trajectory
Policy likely to follow guidance in 4Q18/1H19. Monetary policy is likely to follow Fed guidance in 4Q18/1H19, considering current
growth/inflation and labour market dynamics. Both the employment/inflation mandates are broadly met with policy, going forward, conducted with the
objective of sustaining the cycle (via further tightening in the next 6-9 months). Hence, the Fed will likely continue to tighten policy in 1Q18 (+25bps to
2.25-2.50%) and 1H19 (+50bps to 2.50-3.00%).
FFR decisions, on the margin, can be viewed through three key considerations, i) economic developments (data dependency) and hurdle to tightening,
considering degree of spare capacity (NAIRU, LFPR and inflation) – inflation at target, job gains being deemed (too) brisk with the unemployment rate
under-shooting NAIRU projections; ii) degree of accommodation (75bps to neutral at 3.00% according to dot-plot; monetary models imply around
100bps of buffer before neutral); and iii) orthodox central banking assumption of monetary policy lag.
Our framework of understanding Fed decisions have changed at the margin with point ii (concept of “neutral” becoming a drifting anchor) and iii (data
dependency; feedback from realised rather than positioning policy further into the future) likely to play a more diminished role under Chair Powell
(“pragmatism” over theoretical models; though with uncertainties over buy-in from more theoretically attuned Fed members) and as time decays. The
increased focus on data dependency will introduce higher uncertainties into markets’ perception of the policy path.
Just-in-time policy making. Going into 2H19, the policy outlook will become increasingly uncertain. The median Fed is projecting a further +75bps
increase in 2019 (3.25%), +25bps increase in 2020 (3.50%) and then a pause in 2021. Our expectations remain for another 50bps in 2019 with the FFR
hitting cycle terminal at 3%. As argued, we expect both domestic consumption (higher debt service and cost of living, slower pace of asset price
appreciation, low real income gains) and capital expenditure (higher debt service, elevated current spending vis-à-vis GDP, weakening domestic demand,
external uncertainties) to ease off, with the fiscal impulse peaking, financial conditions tightening, and impact of prior dollar strength. This should taper
labour market gains and keep inflation pressures benign. The extent of slowdown will be dependent upon the resiliency of private sector balance sheet
and the subsequent impact on demand. It is imperative that the Fed stays ahead in managing overall debt servicing costs (short-run implications on
demand; longer-run may short-circuit the feedback from demand to capital spending and future productivity), and limit the negative impact of policy on
overall growth.
USTs, Scenarios
1. So far so good and all is well. As per guidance, the Committee will likely lean towards hiking insofar as the labour market remains robust
(unemployment stable/falling), inflation near/above target, growth stable, coupled with a balanced risk profile (regardless of ex-ante perceived
“neutrals”; no model outputs as anchor), with FFR passing neutral by 3Q19 (real FFR, =>100bps) and tightening further by 2020 (real FFR, 150bps).
This will enable the Fed to sustain the expansion, by getting ahead of the labour market under-shoot and containing inflation, before moving back
towards neutral with growth at target. End of cycle is likely to be caused by a build-up of fundamental fragility with time, leading to a break in the
economic equilibrium. This scenario assumes certain degree of macro-economic resiliency, provide scope for productivity improvements (higher real
rates), and anchoring (higher) inflation expectations. This is probably the Fed’s best hand (balancing the need to be reactive vis-à-vis pre-emptive).
Rates should predominantly be driven by higher risk neutral with term premiums anchored (risk market friendly outcome); curve flattener with 5T
and 10T capped by expectations of front-end FFR and terminal, <=3.25-3.50%. Scope remains for transition into curve steepening with higher long
rates on realisation of higher productivity, pushing real potential growth and real neutral rate higher (front end pushing long end higher,
subsequently, long end dragging short end higher; economic cycle extended).
2. Fed behind the curve. The Fed lose control of the labour market, unable to rein in the under-shoot, leading to higher wages with no productivity
offset, margin compression and partial pass through to higher inflation. Term premium rises on a Fed that is deemed behind the curve. Fed changes
tack and guide for higher rates, pushing risk neutral higher, in order to anchor term premiums, inverting the curve on a higher perceived terminal
but still low neutral; curve steepener to curve flattener with low real neutral – long rates can trade >3.50% - depending on magnitude of imbalance,
Fed’s subsequent reaction and perceived loss and recovery in policy credibility - but should remain bounded; short end can rise substantially. The
combination of high terminal and low neutral will have a significant adverse impact on risk markets.
3. Structural changes starts to bind; no escape velocity. Growth and inflation starts to taper off as i) boost from the fiscal stimulus fades; ii) prior
monetary tightening starts to bite; and iii) the downward pull from unresolved US (credit, wealth-driven economy; skewed labour/capital share) and
global imbalances (Euro-zone fragmentation, internal balance; China de-leveraging while approaching balance sheet limits, re-structuring; EM
stresses). This should be reflected in a peak in growth and inflation soon, coupled with a slowdown in labour gains as demand weakens. The Fed
should pause/reverse the tightening cycle, in order to lower short rates to anchor longer-run risk neutral and term premiums. 5T and 10T should
ease and re-anchor at a new perceived neutral and terminal (<2.50%). High valuations of markets will ensure that risk markets perform poorly on
the turn in the cycle.
USTs, Views (1)
Markets currently are trading on scenario 1. Further upside surprises in estimates are required to push out the Fed’s FFR forecasts, within a base
case of no growth/inflation disappointment (2018/2019 GDP, 3.1%/2.5% and Core PCE, 2.0%/2.1%). Near term outlook will be driven by i) market
expectations of the degree of slack in the US – Fed ahead/behind the curve; ii) real-time reassessment of perceived secular fundamentals (where all the
secular stars will be – r*, U*, Y*; separation between secular (neutral) and cyclical (terminal)); and iii) re-calibration of the level of Fed put – central
banks’ reaction function and market perception vis-à-vis required magnitude and persistency of market stresses. Understandably, narratives have pushed
the balance of risk towards higher yields.
Our base case remains 3. We like rates structurally, both on adequate valuations (breakeven levels: 5y, 3.55% (2.98%); and 10y, 3.36% (3.09%)) and as a
hedge for risk assets, taking the under on the (largely) priced base case of a smooth 3 year (2018-2020) rate hiking cycle. Based on our macro risk-neutral
model and pure expectations, we see 1.80-2.50% and 2.10-2.30% on the UST 5 and 10. Our view is to stay long on the UST 5-10y, prefer 7y; tactical view
suggests range trading, 10T around 2.80-3.20%, into 1H19 (Fed hikes by 75bps to 2.75-3.00% by 1H19; anchor extent of rates rally; near term upside
risks of a Republican sweep of the mid-terms, providing the President and the Republican Party with another opportunity to pursue even looser (pro-
wealth) fiscal policy. Risk neutral have scope to re-price lower with real risk-neutral 5y5y at close to 1.4% (compared to Fed’s 100bps; 60bps off 2005-
2007 bubble years and already surpassing 2008’s level, assuming unchanged term premiums), premised on a peak in growth/inflation into 2019,
considering the cumulative impact of prior and prospective monetary tightening (into financing costs), a turn to negative in the fiscal impulse, amid more
subdued global demand considering the tightening in financial condition (ex-US; more limited in the US) should start dampening the economic outlook.
USTs, Views (2)
We will not seek to drink the Kool-Aid, until more visible changes in the make-up of
growth suggests otherwise (sustainably higher capex, productivity, labour share of income,
more sustainable nature of global demand, easing debt burdens). We maintain that private
sector debt loads remain too high to withstand sustained higher interest rates. We believe
that current growth drivers are cyclical (fiscal policy will have a transitory impact on the
economy via demand channels with spending targeted at wrong segments of the economy),
not structural, and that latent secular dis-inflation impulses remains. To repeat, certain
factors underlying the US (and global) economy seems highly persistent, a structural
reflection of the current global growth model/political paradigm/broken models
everywhere; Phillips curve (lower cost labour driven growth; no productivity); r* on
consumption and investment and thus not transient (non-linear, easing have limited
impact/tightening massive); a lack of substance in global re-balancing; rise in oligarchy);
continued dependence on orthodox global central bank policy put – continues to suggest
that one can ultimately position for the scenario of a shortened rate hiking cycle as limits
are reached once cyclical strength fades. We maintain our view of a neutral no >2.5%
(markets already higher).
The narrative of omnipotent central banks will be severely tested, considering that
monetary policy will have limited traction on growth outcomes, going forward
(wealth/debt-driven consumption/investment via credit/portfolio re-balancing/signalling
limited by debt-servicing/asset valuations – defaults/sell-off required first; broken
monetary models); fiscal, FX, reforms will be required as policy tools (no stable global
equilibrium – secular stagnation).
-1.0
-1.2
0.4
0.1 0.1
0.7
-1.5
-1.0
-0.5
0.0
0.5
1.0
2018 2019 2020 2021 2022 2023
%Potential GDP Chng in Cyclically-adjusted Fiscal Policy
-800
-600
-400
-200
0
200
400
600
1Q93 1Q97 1Q01 1Q05 1Q09 1Q13 1Q17
bps Growth spread-to-Interest Expense
% GDP
BBB Corps
5Y Interest
Cost, UST +
Spreads
Non-fin
Private
interest
expense
Excess
spread over
GDP
5Y 3.92 5.70 -0.30
1Y5Y 4.08 5.94 -0.54
2Y5Y 4.13 6.01 -0.61
3Y5Y 4.16 6.05 -0.65
4Y5Y 4.18 6.08 -0.68
5Y5Y 4.21 6.12 -0.72
GDP Growth 5.40
Rates markets
Rates markets are broadly priced for 2018/2019, off by 25-50bps, with a pause expected
close to 3.00%. Marking-to-market the better growth/inflation outlook and rolling prior
rate hikes, the UST curve shifted higher with the curve up by 50-100bps with a flattening
bias. YTD higher 10T is predominantly driven by higher implied real growth (50%), and to a
lesser extent break-evens (30%) and term premiums (20%). Based on Fed’s projections, the
risk-neutral fair value of the US5T and US10T is at 3.05% and 3.02%, compared to spot of
2.98% (+7bps) and 3.09% (-7), excluding term premiums. Our internal models based on
spot nominal GDP (2Q18: 5.4%) suggests US5T and US10T FV at 3.14% and 3.20%. Markets
have re-priced long run expectations of neutral, with the real risk neutral moving to 1.25-
1.50% (Fed forward estimate approx. 1.0%; nominal GDP assumption around 3.8%; PCE at
2.0%). We deem the UST curve well-priced. Longer–run rates are anchored by markets
expectations of terminal and neutral around 3.00-3.25%. Sell-off will be led by higher term
premiums with real neutral and break-evens adequately priced (unless real growth/inflation
take off in a sustainable manner).
2.375
3.125
3.375
3.000
2.52
3.02 3.01
3.26
2.37
2.81
2.72 2.80
2.56
3.08 3.02
3.27
2.67
3.13 3.15
3.38
2.43
2.91 2.93 2.98
2.25
2.80 2.85
0.00
0.50
1.00
1.50
2.00
2.50
3.00
3.50
2018 2019 2020
% FOMC 1M UST FRs 1M OIS 1M Swaps Euro-dollar SOFR FFF
Longer run
2.00
2.25
2.50
2.75
3.00
3.25
3.50
Current 3M 6M 9M 1Y 2Y 3Y 4Y 5Y 10Y
Foward Curves, % 1Y 2Y 5Y 10Y 3M
Year Fed Path Current
Fed Path,
Risk Neutral
Breakeven
Chng, bps
2018 2.375 5y 2.98 3.05 72
2019 3.125 10y 3.09 3.02 39
2020 3.375
2021 3.375
2022 3.000
2023 3.000
2024 3.000
2025 3.000
2026 3.000
2027 3.000
-2
-1
0
1
2
3
4
Jan-99 Jan-01 Jan-03 Jan-05 Jan-07 Jan-09 Jan-11 Jan-13 Jan-15 Jan-17
Real Risk Neutral, %
Mkt perception of equilibrium real FFR
5y 10y 5y5y
USTs, Curve flattening
0
1
2
3
4
5
6
7
8
9-150
-100
-50
0
50
100
150
200
Jan-90 Jan-96 Jan-02 Jan-08 Jan-14
%
reverse scale
Risk Neutral
bps
10y2y 5y2y 10y5y FFR (RHS)
0
1
2
3
4
5
6
7
8
9-50
0
50
100
150
200
250
300
Jan-90 Jan-96 Jan-02 Jan-08 Jan-14
%
reverse scale
TP, bps 10y2y 5y2y 10y5y FFR (RHS)
0
1
2
3
4
5
6
7
8
-150
-100
-50
0
50
100
150
200
250
Jan-97 Jan-00 Jan-03 Jan-06 Jan-09 Jan-12 Jan-15 Jan-18
%bps 18M3M - 3M (LHS) 18M3M 3M
0
50
100
150
200
250
300
Jan-12 Jul-12 Jan-13 Jul-13 Jan-14 Jul-14 Jan-15 Jul-15 Jan-16 Jul-16 Jan-17 Jul-17 Jan-18 Jul-18
bps 10y2y 10y2y, 1yfwd 10y2y, 2yfwd 10y2y, 3yfwd
USTs, Technicals
-12
-10
-8
-6
-4
-2
0
Jan-98 Jan-01 Jan-04 Jan-07 Jan-10 Jan-13 Jan-16
Maximum drawdown, 3Yr, % Barclays UST 7-10Yrs Max Drawdown
1.00
1.25
1.50
1.75
2.00
2.25
2.50
2.75
3.00
3.25
3.50
Jan-16 Jul-16 Jan-17 Jul-17 Jan-18 Jul-18
% 10-Yr Treasury 50 WMA +2stdev -2stdev
-3
-2
-1
0
1
2
3
4
5
Jan-16 Apr-16 Jul-16 Oct-16 Jan-17 Apr-17 Jul-17 Oct-17 Jan-18 Apr-18 Jul-18
52wk z-score Copper/Gold Oil/Gold Ratio Metals/Gold Lumber/Gold
Risk off
0
1
2
3
4
5
6
7
8
Jan-98 Jan-00 Jan-02 Jan-04 Jan-06 Jan-08 Jan-10 Jan-12 Jan-14 Jan-16 Jan-18
% US10T US10T, ISM Model +1stdev -1stdev

More Related Content

What's hot

The Impact of Monetary Policy on Economic Growth and Price Stability in Kenya...
The Impact of Monetary Policy on Economic Growth and Price Stability in Kenya...The Impact of Monetary Policy on Economic Growth and Price Stability in Kenya...
The Impact of Monetary Policy on Economic Growth and Price Stability in Kenya...iosrjce
 
Current Monetary policy of Pakistan 2017-2018
Current Monetary policy of Pakistan 2017-2018Current Monetary policy of Pakistan 2017-2018
Current Monetary policy of Pakistan 2017-2018Mohammad Adeel Bhatti
 
SandPointe_September Market Perspective 2014
SandPointe_September Market Perspective 2014SandPointe_September Market Perspective 2014
SandPointe_September Market Perspective 2014Roger Brinner
 
Monetary policy
Monetary policyMonetary policy
Monetary policynight seem
 
Report on Monetary Policies & its transmission mechanism
Report on Monetary Policies & its transmission mechanismReport on Monetary Policies & its transmission mechanism
Report on Monetary Policies & its transmission mechanismGopal Kumar
 
Transmission Mechanism of Monetary Policy
Transmission Mechanism of Monetary PolicyTransmission Mechanism of Monetary Policy
Transmission Mechanism of Monetary PolicyAmandiNiwarthanaWeer
 
State Bank of Pakidtan-Monetary Policy
State Bank of Pakidtan-Monetary PolicyState Bank of Pakidtan-Monetary Policy
State Bank of Pakidtan-Monetary PolicySalma Bashir
 
Long or Short Mauritius_ Final (7) (1)
Long or Short Mauritius_ Final (7) (1)Long or Short Mauritius_ Final (7) (1)
Long or Short Mauritius_ Final (7) (1)Davin Appanah
 
Market outlook debt march 2021
Market outlook debt march 2021Market outlook debt march 2021
Market outlook debt march 2021Rahulpathak154
 
Monetary policy layana
Monetary policy layanaMonetary policy layana
Monetary policy layanaapaswathy14
 
Monetary policy & Economic Indicators
Monetary policy & Economic IndicatorsMonetary policy & Economic Indicators
Monetary policy & Economic IndicatorsNouman Tamimi
 
monetary policy and its tools
monetary policy and its toolsmonetary policy and its tools
monetary policy and its toolszunairahanif
 
Understanding monetary & fiscal policy
Understanding monetary & fiscal policyUnderstanding monetary & fiscal policy
Understanding monetary & fiscal policyAnil Nandyala
 
Monetary policy and_gdp
Monetary policy and_gdpMonetary policy and_gdp
Monetary policy and_gdpSyed Ali
 
Policy Rate, Lending Rate and Investment in Africa - A Phd proposal for defense
Policy Rate, Lending Rate and Investment in Africa - A Phd proposal for defensePolicy Rate, Lending Rate and Investment in Africa - A Phd proposal for defense
Policy Rate, Lending Rate and Investment in Africa - A Phd proposal for defenseSamuel Agyei
 

What's hot (20)

The Impact of Monetary Policy on Economic Growth and Price Stability in Kenya...
The Impact of Monetary Policy on Economic Growth and Price Stability in Kenya...The Impact of Monetary Policy on Economic Growth and Price Stability in Kenya...
The Impact of Monetary Policy on Economic Growth and Price Stability in Kenya...
 
Current Monetary policy of Pakistan 2017-2018
Current Monetary policy of Pakistan 2017-2018Current Monetary policy of Pakistan 2017-2018
Current Monetary policy of Pakistan 2017-2018
 
Monetary Policy PPT
Monetary Policy PPTMonetary Policy PPT
Monetary Policy PPT
 
SandPointe_September Market Perspective 2014
SandPointe_September Market Perspective 2014SandPointe_September Market Perspective 2014
SandPointe_September Market Perspective 2014
 
Lecture # 3 (30.01.2017) @ ibt monetary policy
Lecture # 3 (30.01.2017) @ ibt monetary policyLecture # 3 (30.01.2017) @ ibt monetary policy
Lecture # 3 (30.01.2017) @ ibt monetary policy
 
Monetary policy
Monetary policyMonetary policy
Monetary policy
 
Report on Monetary Policies & its transmission mechanism
Report on Monetary Policies & its transmission mechanismReport on Monetary Policies & its transmission mechanism
Report on Monetary Policies & its transmission mechanism
 
Transmission Mechanism of Monetary Policy
Transmission Mechanism of Monetary PolicyTransmission Mechanism of Monetary Policy
Transmission Mechanism of Monetary Policy
 
State Bank of Pakidtan-Monetary Policy
State Bank of Pakidtan-Monetary PolicyState Bank of Pakidtan-Monetary Policy
State Bank of Pakidtan-Monetary Policy
 
Monetary policy by Ali Roshaan
Monetary policy by Ali RoshaanMonetary policy by Ali Roshaan
Monetary policy by Ali Roshaan
 
Long or Short Mauritius_ Final (7) (1)
Long or Short Mauritius_ Final (7) (1)Long or Short Mauritius_ Final (7) (1)
Long or Short Mauritius_ Final (7) (1)
 
Market outlook debt march 2021
Market outlook debt march 2021Market outlook debt march 2021
Market outlook debt march 2021
 
Monetary policy
Monetary policyMonetary policy
Monetary policy
 
Monetary policy layana
Monetary policy layanaMonetary policy layana
Monetary policy layana
 
Monetary policy & Economic Indicators
Monetary policy & Economic IndicatorsMonetary policy & Economic Indicators
Monetary policy & Economic Indicators
 
monetary policy and its tools
monetary policy and its toolsmonetary policy and its tools
monetary policy and its tools
 
Understanding monetary & fiscal policy
Understanding monetary & fiscal policyUnderstanding monetary & fiscal policy
Understanding monetary & fiscal policy
 
Monetary policy and_gdp
Monetary policy and_gdpMonetary policy and_gdp
Monetary policy and_gdp
 
Policy Rate, Lending Rate and Investment in Africa - A Phd proposal for defense
Policy Rate, Lending Rate and Investment in Africa - A Phd proposal for defensePolicy Rate, Lending Rate and Investment in Africa - A Phd proposal for defense
Policy Rate, Lending Rate and Investment in Africa - A Phd proposal for defense
 
Monetary Policy
Monetary PolicyMonetary Policy
Monetary Policy
 

Similar to 201809 FOMC

gopinath-bcb-17may2023-slides.pptx
gopinath-bcb-17may2023-slides.pptxgopinath-bcb-17may2023-slides.pptx
gopinath-bcb-17may2023-slides.pptxSaiVenkat105
 
Market Perspective - September 2018
Market Perspective - September 2018Market Perspective - September 2018
Market Perspective - September 2018Mark Biegel
 
economic group assinment.pdf
economic group assinment.pdfeconomic group assinment.pdf
economic group assinment.pdfFazilatShahid
 
Monetary and fiscal policy response and recent developments
Monetary and fiscal policy response and recent developmentsMonetary and fiscal policy response and recent developments
Monetary and fiscal policy response and recent developmentsClaro Ganac
 
The Current Outlook for the Economy and the Budget
The Current Outlook for the Economy and the BudgetThe Current Outlook for the Economy and the Budget
The Current Outlook for the Economy and the BudgetCongressional Budget Office
 
MPC Statement 19 July 2018
MPC Statement 19 July 2018 MPC Statement 19 July 2018
MPC Statement 19 July 2018 SABC News
 
Credit Suisse Analysis Brasil 2019-2020
Credit Suisse Analysis Brasil 2019-2020Credit Suisse Analysis Brasil 2019-2020
Credit Suisse Analysis Brasil 2019-2020Edward Lange
 
Statement of the Monetary Policy Committee 19 November 2020
Statement of the Monetary Policy Committee 19 November 2020Statement of the Monetary Policy Committee 19 November 2020
Statement of the Monetary Policy Committee 19 November 2020SABC News
 
Statement of the monetary policy committee 19 november 2020
Statement of the monetary policy committee 19 november 2020Statement of the monetary policy committee 19 november 2020
Statement of the monetary policy committee 19 november 2020Preggie Moodley
 
Macroeconomic relationships
Macroeconomic relationshipsMacroeconomic relationships
Macroeconomic relationshipsGaetan Lion
 
Global Economic Update & Strategic Investment Outlook Q2 2014
Global Economic Update & Strategic Investment Outlook Q2 2014Global Economic Update & Strategic Investment Outlook Q2 2014
Global Economic Update & Strategic Investment Outlook Q2 2014Cohen and Company
 
LBS comment - Bank of Canada Decision - April 2017
LBS comment - Bank of Canada Decision - April 2017LBS comment - Bank of Canada Decision - April 2017
LBS comment - Bank of Canada Decision - April 2017Mark MacIsaac
 
MACROECONOMIC FOCUS AND INDUSTRY ANALYSIS .docx
MACROECONOMIC FOCUS AND INDUSTRY ANALYSIS                         .docxMACROECONOMIC FOCUS AND INDUSTRY ANALYSIS                         .docx
MACROECONOMIC FOCUS AND INDUSTRY ANALYSIS .docxsmile790243
 

Similar to 201809 FOMC (20)

US Outlook 2H18/1H19
US Outlook 2H18/1H19US Outlook 2H18/1H19
US Outlook 2H18/1H19
 
gopinath-bcb-17may2023-slides.pptx
gopinath-bcb-17may2023-slides.pptxgopinath-bcb-17may2023-slides.pptx
gopinath-bcb-17may2023-slides.pptx
 
Market Perspective - September 2018
Market Perspective - September 2018Market Perspective - September 2018
Market Perspective - September 2018
 
economic group assinment.pdf
economic group assinment.pdfeconomic group assinment.pdf
economic group assinment.pdf
 
Monetary and fiscal policy response and recent developments
Monetary and fiscal policy response and recent developmentsMonetary and fiscal policy response and recent developments
Monetary and fiscal policy response and recent developments
 
The Current Outlook for the Economy and the Budget
The Current Outlook for the Economy and the BudgetThe Current Outlook for the Economy and the Budget
The Current Outlook for the Economy and the Budget
 
Monetary policy
Monetary policyMonetary policy
Monetary policy
 
BOJ yield curve control
BOJ yield curve controlBOJ yield curve control
BOJ yield curve control
 
MPC Statement 19 July 2018
MPC Statement 19 July 2018 MPC Statement 19 July 2018
MPC Statement 19 July 2018
 
Credit Suisse Analysis Brasil 2019-2020
Credit Suisse Analysis Brasil 2019-2020Credit Suisse Analysis Brasil 2019-2020
Credit Suisse Analysis Brasil 2019-2020
 
Statement of the Monetary Policy Committee 19 November 2020
Statement of the Monetary Policy Committee 19 November 2020Statement of the Monetary Policy Committee 19 November 2020
Statement of the Monetary Policy Committee 19 November 2020
 
Statement of the monetary policy committee 19 november 2020
Statement of the monetary policy committee 19 november 2020Statement of the monetary policy committee 19 november 2020
Statement of the monetary policy committee 19 november 2020
 
Macroeconomic relationships
Macroeconomic relationshipsMacroeconomic relationships
Macroeconomic relationships
 
Company Presentation
Company PresentationCompany Presentation
Company Presentation
 
FOMC - Federal Reserve Meeting Transcript March 16 2016
FOMC - Federal Reserve Meeting Transcript March 16 2016FOMC - Federal Reserve Meeting Transcript March 16 2016
FOMC - Federal Reserve Meeting Transcript March 16 2016
 
Global Economic Update & Strategic Investment Outlook Q2 2014
Global Economic Update & Strategic Investment Outlook Q2 2014Global Economic Update & Strategic Investment Outlook Q2 2014
Global Economic Update & Strategic Investment Outlook Q2 2014
 
LBS comment - Bank of Canada Decision - April 2017
LBS comment - Bank of Canada Decision - April 2017LBS comment - Bank of Canada Decision - April 2017
LBS comment - Bank of Canada Decision - April 2017
 
Inflation growth
Inflation growthInflation growth
Inflation growth
 
MACROECONOMIC FOCUS AND INDUSTRY ANALYSIS .docx
MACROECONOMIC FOCUS AND INDUSTRY ANALYSIS                         .docxMACROECONOMIC FOCUS AND INDUSTRY ANALYSIS                         .docx
MACROECONOMIC FOCUS AND INDUSTRY ANALYSIS .docx
 
Union budget fy14 feb'13
Union budget fy14 feb'13Union budget fy14 feb'13
Union budget fy14 feb'13
 

Recently uploaded

The Economic History of the U.S. Lecture 19.pdf
The Economic History of the U.S. Lecture 19.pdfThe Economic History of the U.S. Lecture 19.pdf
The Economic History of the U.S. Lecture 19.pdfGale Pooley
 
The Economic History of the U.S. Lecture 18.pdf
The Economic History of the U.S. Lecture 18.pdfThe Economic History of the U.S. Lecture 18.pdf
The Economic History of the U.S. Lecture 18.pdfGale Pooley
 
05_Annelore Lenoir_Docbyte_MeetupDora&Cybersecurity.pptx
05_Annelore Lenoir_Docbyte_MeetupDora&Cybersecurity.pptx05_Annelore Lenoir_Docbyte_MeetupDora&Cybersecurity.pptx
05_Annelore Lenoir_Docbyte_MeetupDora&Cybersecurity.pptxFinTech Belgium
 
(DIYA) Bhumkar Chowk Call Girls Just Call 7001035870 [ Cash on Delivery ] Pun...
(DIYA) Bhumkar Chowk Call Girls Just Call 7001035870 [ Cash on Delivery ] Pun...(DIYA) Bhumkar Chowk Call Girls Just Call 7001035870 [ Cash on Delivery ] Pun...
(DIYA) Bhumkar Chowk Call Girls Just Call 7001035870 [ Cash on Delivery ] Pun...ranjana rawat
 
VIP Call Girls LB Nagar ( Hyderabad ) Phone 8250192130 | ₹5k To 25k With Room...
VIP Call Girls LB Nagar ( Hyderabad ) Phone 8250192130 | ₹5k To 25k With Room...VIP Call Girls LB Nagar ( Hyderabad ) Phone 8250192130 | ₹5k To 25k With Room...
VIP Call Girls LB Nagar ( Hyderabad ) Phone 8250192130 | ₹5k To 25k With Room...Suhani Kapoor
 
letter-from-the-chair-to-the-fca-relating-to-british-steel-pensions-scheme-15...
letter-from-the-chair-to-the-fca-relating-to-british-steel-pensions-scheme-15...letter-from-the-chair-to-the-fca-relating-to-british-steel-pensions-scheme-15...
letter-from-the-chair-to-the-fca-relating-to-british-steel-pensions-scheme-15...Henry Tapper
 
call girls in Nand Nagri (DELHI) 🔝 >༒9953330565🔝 genuine Escort Service 🔝✔️✔️
call girls in  Nand Nagri (DELHI) 🔝 >༒9953330565🔝 genuine Escort Service 🔝✔️✔️call girls in  Nand Nagri (DELHI) 🔝 >༒9953330565🔝 genuine Escort Service 🔝✔️✔️
call girls in Nand Nagri (DELHI) 🔝 >༒9953330565🔝 genuine Escort Service 🔝✔️✔️9953056974 Low Rate Call Girls In Saket, Delhi NCR
 
Q3 2024 Earnings Conference Call and Webcast Slides
Q3 2024 Earnings Conference Call and Webcast SlidesQ3 2024 Earnings Conference Call and Webcast Slides
Q3 2024 Earnings Conference Call and Webcast SlidesMarketing847413
 
High Class Call Girls Nagpur Grishma Call 7001035870 Meet With Nagpur Escorts
High Class Call Girls Nagpur Grishma Call 7001035870 Meet With Nagpur EscortsHigh Class Call Girls Nagpur Grishma Call 7001035870 Meet With Nagpur Escorts
High Class Call Girls Nagpur Grishma Call 7001035870 Meet With Nagpur Escortsranjana rawat
 
20240417-Calibre-April-2024-Investor-Presentation.pdf
20240417-Calibre-April-2024-Investor-Presentation.pdf20240417-Calibre-April-2024-Investor-Presentation.pdf
20240417-Calibre-April-2024-Investor-Presentation.pdfAdnet Communications
 
Interimreport1 January–31 March2024 Elo Mutual Pension Insurance Company
Interimreport1 January–31 March2024 Elo Mutual Pension Insurance CompanyInterimreport1 January–31 March2024 Elo Mutual Pension Insurance Company
Interimreport1 January–31 March2024 Elo Mutual Pension Insurance CompanyTyöeläkeyhtiö Elo
 
Booking open Available Pune Call Girls Shivane 6297143586 Call Hot Indian Gi...
Booking open Available Pune Call Girls Shivane  6297143586 Call Hot Indian Gi...Booking open Available Pune Call Girls Shivane  6297143586 Call Hot Indian Gi...
Booking open Available Pune Call Girls Shivane 6297143586 Call Hot Indian Gi...Call Girls in Nagpur High Profile
 
How Automation is Driving Efficiency Through the Last Mile of Reporting
How Automation is Driving Efficiency Through the Last Mile of ReportingHow Automation is Driving Efficiency Through the Last Mile of Reporting
How Automation is Driving Efficiency Through the Last Mile of ReportingAggregage
 
Instant Issue Debit Cards - School Designs
Instant Issue Debit Cards - School DesignsInstant Issue Debit Cards - School Designs
Instant Issue Debit Cards - School Designsegoetzinger
 
Independent Lucknow Call Girls 8923113531WhatsApp Lucknow Call Girls make you...
Independent Lucknow Call Girls 8923113531WhatsApp Lucknow Call Girls make you...Independent Lucknow Call Girls 8923113531WhatsApp Lucknow Call Girls make you...
Independent Lucknow Call Girls 8923113531WhatsApp Lucknow Call Girls make you...makika9823
 
Log your LOA pain with Pension Lab's brilliant campaign
Log your LOA pain with Pension Lab's brilliant campaignLog your LOA pain with Pension Lab's brilliant campaign
Log your LOA pain with Pension Lab's brilliant campaignHenry Tapper
 
High Class Call Girls Nashik Maya 7001305949 Independent Escort Service Nashik
High Class Call Girls Nashik Maya 7001305949 Independent Escort Service NashikHigh Class Call Girls Nashik Maya 7001305949 Independent Escort Service Nashik
High Class Call Girls Nashik Maya 7001305949 Independent Escort Service NashikCall Girls in Nagpur High Profile
 
VIP Call Girls Thane Sia 8617697112 Independent Escort Service Thane
VIP Call Girls Thane Sia 8617697112 Independent Escort Service ThaneVIP Call Girls Thane Sia 8617697112 Independent Escort Service Thane
VIP Call Girls Thane Sia 8617697112 Independent Escort Service ThaneCall girls in Ahmedabad High profile
 
VVIP Pune Call Girls Katraj (7001035870) Pune Escorts Nearby with Complete Sa...
VVIP Pune Call Girls Katraj (7001035870) Pune Escorts Nearby with Complete Sa...VVIP Pune Call Girls Katraj (7001035870) Pune Escorts Nearby with Complete Sa...
VVIP Pune Call Girls Katraj (7001035870) Pune Escorts Nearby with Complete Sa...Call Girls in Nagpur High Profile
 

Recently uploaded (20)

The Economic History of the U.S. Lecture 19.pdf
The Economic History of the U.S. Lecture 19.pdfThe Economic History of the U.S. Lecture 19.pdf
The Economic History of the U.S. Lecture 19.pdf
 
The Economic History of the U.S. Lecture 18.pdf
The Economic History of the U.S. Lecture 18.pdfThe Economic History of the U.S. Lecture 18.pdf
The Economic History of the U.S. Lecture 18.pdf
 
05_Annelore Lenoir_Docbyte_MeetupDora&Cybersecurity.pptx
05_Annelore Lenoir_Docbyte_MeetupDora&Cybersecurity.pptx05_Annelore Lenoir_Docbyte_MeetupDora&Cybersecurity.pptx
05_Annelore Lenoir_Docbyte_MeetupDora&Cybersecurity.pptx
 
(DIYA) Bhumkar Chowk Call Girls Just Call 7001035870 [ Cash on Delivery ] Pun...
(DIYA) Bhumkar Chowk Call Girls Just Call 7001035870 [ Cash on Delivery ] Pun...(DIYA) Bhumkar Chowk Call Girls Just Call 7001035870 [ Cash on Delivery ] Pun...
(DIYA) Bhumkar Chowk Call Girls Just Call 7001035870 [ Cash on Delivery ] Pun...
 
Veritas Interim Report 1 January–31 March 2024
Veritas Interim Report 1 January–31 March 2024Veritas Interim Report 1 January–31 March 2024
Veritas Interim Report 1 January–31 March 2024
 
VIP Call Girls LB Nagar ( Hyderabad ) Phone 8250192130 | ₹5k To 25k With Room...
VIP Call Girls LB Nagar ( Hyderabad ) Phone 8250192130 | ₹5k To 25k With Room...VIP Call Girls LB Nagar ( Hyderabad ) Phone 8250192130 | ₹5k To 25k With Room...
VIP Call Girls LB Nagar ( Hyderabad ) Phone 8250192130 | ₹5k To 25k With Room...
 
letter-from-the-chair-to-the-fca-relating-to-british-steel-pensions-scheme-15...
letter-from-the-chair-to-the-fca-relating-to-british-steel-pensions-scheme-15...letter-from-the-chair-to-the-fca-relating-to-british-steel-pensions-scheme-15...
letter-from-the-chair-to-the-fca-relating-to-british-steel-pensions-scheme-15...
 
call girls in Nand Nagri (DELHI) 🔝 >༒9953330565🔝 genuine Escort Service 🔝✔️✔️
call girls in  Nand Nagri (DELHI) 🔝 >༒9953330565🔝 genuine Escort Service 🔝✔️✔️call girls in  Nand Nagri (DELHI) 🔝 >༒9953330565🔝 genuine Escort Service 🔝✔️✔️
call girls in Nand Nagri (DELHI) 🔝 >༒9953330565🔝 genuine Escort Service 🔝✔️✔️
 
Q3 2024 Earnings Conference Call and Webcast Slides
Q3 2024 Earnings Conference Call and Webcast SlidesQ3 2024 Earnings Conference Call and Webcast Slides
Q3 2024 Earnings Conference Call and Webcast Slides
 
High Class Call Girls Nagpur Grishma Call 7001035870 Meet With Nagpur Escorts
High Class Call Girls Nagpur Grishma Call 7001035870 Meet With Nagpur EscortsHigh Class Call Girls Nagpur Grishma Call 7001035870 Meet With Nagpur Escorts
High Class Call Girls Nagpur Grishma Call 7001035870 Meet With Nagpur Escorts
 
20240417-Calibre-April-2024-Investor-Presentation.pdf
20240417-Calibre-April-2024-Investor-Presentation.pdf20240417-Calibre-April-2024-Investor-Presentation.pdf
20240417-Calibre-April-2024-Investor-Presentation.pdf
 
Interimreport1 January–31 March2024 Elo Mutual Pension Insurance Company
Interimreport1 January–31 March2024 Elo Mutual Pension Insurance CompanyInterimreport1 January–31 March2024 Elo Mutual Pension Insurance Company
Interimreport1 January–31 March2024 Elo Mutual Pension Insurance Company
 
Booking open Available Pune Call Girls Shivane 6297143586 Call Hot Indian Gi...
Booking open Available Pune Call Girls Shivane  6297143586 Call Hot Indian Gi...Booking open Available Pune Call Girls Shivane  6297143586 Call Hot Indian Gi...
Booking open Available Pune Call Girls Shivane 6297143586 Call Hot Indian Gi...
 
How Automation is Driving Efficiency Through the Last Mile of Reporting
How Automation is Driving Efficiency Through the Last Mile of ReportingHow Automation is Driving Efficiency Through the Last Mile of Reporting
How Automation is Driving Efficiency Through the Last Mile of Reporting
 
Instant Issue Debit Cards - School Designs
Instant Issue Debit Cards - School DesignsInstant Issue Debit Cards - School Designs
Instant Issue Debit Cards - School Designs
 
Independent Lucknow Call Girls 8923113531WhatsApp Lucknow Call Girls make you...
Independent Lucknow Call Girls 8923113531WhatsApp Lucknow Call Girls make you...Independent Lucknow Call Girls 8923113531WhatsApp Lucknow Call Girls make you...
Independent Lucknow Call Girls 8923113531WhatsApp Lucknow Call Girls make you...
 
Log your LOA pain with Pension Lab's brilliant campaign
Log your LOA pain with Pension Lab's brilliant campaignLog your LOA pain with Pension Lab's brilliant campaign
Log your LOA pain with Pension Lab's brilliant campaign
 
High Class Call Girls Nashik Maya 7001305949 Independent Escort Service Nashik
High Class Call Girls Nashik Maya 7001305949 Independent Escort Service NashikHigh Class Call Girls Nashik Maya 7001305949 Independent Escort Service Nashik
High Class Call Girls Nashik Maya 7001305949 Independent Escort Service Nashik
 
VIP Call Girls Thane Sia 8617697112 Independent Escort Service Thane
VIP Call Girls Thane Sia 8617697112 Independent Escort Service ThaneVIP Call Girls Thane Sia 8617697112 Independent Escort Service Thane
VIP Call Girls Thane Sia 8617697112 Independent Escort Service Thane
 
VVIP Pune Call Girls Katraj (7001035870) Pune Escorts Nearby with Complete Sa...
VVIP Pune Call Girls Katraj (7001035870) Pune Escorts Nearby with Complete Sa...VVIP Pune Call Girls Katraj (7001035870) Pune Escorts Nearby with Complete Sa...
VVIP Pune Call Girls Katraj (7001035870) Pune Escorts Nearby with Complete Sa...
 

201809 FOMC

  • 1. FOMC Sep 2018 statement. Highlights (1) • Unchanged characterisation of economic activities. Economic activity is seen to be rising at a strong rate, both household spending and business fixed investment have grown strongly. The labour market has continued to strengthen; job gains have been strong, on average, and the unemployment rate has stayed low. Job gains averaged “well above the pace” required in the long run to absorb new entrants. • Risks to the economic outlook remains roughly balanced. • Impact of trade protectionism, on aggregate, is seen as relatively small. The Chair is taking a wait-and-see approach, with limited negative impact seen thus far; uncertainties remain over whether negative impact will be realised and if they did, whether to see them as permanent or one-off adjustments and thus more transitory in nature. • Inflation mandate fulfilled. Both headline and core prices remain near 2%. Indicators of longer-term inflation expectations are little changed, on balance. • Monetary policy conducted with the objective of sustaining the current cycle (via further tightening). The Committee expects that further gradual increases in the FFR will be consistent with sustained expansion of economic activity, strong labour market conditions and inflation near the symmetric 2% objective over the medium term. Realized and expected economic conditions will be assessed relative to the i) maximum employment objective and ii) symmetric 2% inflation target. In determining the timing and size of adjustments to the FFR, the Committee will take into account a wide range of information including labour market conditions, inflation pressures and expectations, and readings on financial and international developments. • The sentence “the stance of policy remains accommodative, thereby supporting strong labour conditions and a sustained return to 2% inflation” was removed, as widely expected, reflecting rate hikes to date. The Chair highlighted that the change does not imply any change in the policy rate path and that policy is proceeding in line with expectations. Policy is likely still “accommodative” considering spot to neutral (2.00-2.25% to 3.00%). • Sound financial system and moderate financial stability risks. Banks are now held to much higher standards with regards to regulations, capital and liquidity, and in the ways risks are assessed and managed. The Chair deems the financial system as stronger and well-positioned to support the economy. The Chair too implied that, as of now, he sees no need for a rise in SIFIs’ CCyB. Financial stability risks are, on the whole, deemed moderate.
  • 2. FOMC Sep 2018 statement. Highlights (2) • Pragmatism over forward guidance. Chair implicitly downplays the importance of forward guidance on more than one occasion, highlighting that forecasts (on the economy and policy) one or two years out are highly uncertain. Many key variables are uncertain and have no precise point estimates (NAIRU, LFPR, r*, concept of policy “accommodation”). The SEP and FFR dot-plot are individual forecasts based on a range of expectations which are fairly uncertain and subject to changes on evolving circumstances. The most important consideration, above all, is whether the current policy stance is appropriate in achieving the statutory goals of the Fed and such decision is taken on a meeting by meeting basis, based on realised data and expectations on the economy and markets. The gradual approach to policy will help mitigate the long and variable lag nature of monetary policy adjustments by providing scope for the Committee to make adjustments to policy from the subsequent response of the economy to prior policy adjustments (data dependency). Such an approach is undertaken as an intermediate path that balances the risks of overheating and unnecessary tightening that inadvertently cuts short the expansion cycle (which may proof to be sustainable). • Marking-to-realised for 2018; broadly unchanged thereafter. Median growth rates were upgraded for 2018 and 2019 by 30bps and 10bps to 3.1% (cumulatively +100bps since Dec 17) and 2.5% respectively. 2020, 2021 (new projection) and longer run growth estimates were left at 2.0%, 1.8% and 1.8% respectively. This suggests that most of the impact from fiscal spending were deemed by the Fed to be cyclical rather than structural (Chair highlighted that supply-side impact are very uncertain and may take some time, if any, to emerge). Unemployment rates barely moved, higher by 10bps to 3.7% in 2018, unchanged at 3.5% for both 2019-2020, 3.7% and 4.5% in 2021 and longer-run respectively. Core inflation projections were unchanged, 2.0% in 2018; unchanged at 2.1% 2019 onwards. • Broadly unchanged path; VC leans hawkish; unchanged terminal and higher neutral. Sep’s Fed’s median expectations, 2018 = 2.375% (unchanged); 2019 = 3.125% (unchanged; 5:4:7; 11/16 =<Median); 2020 = 3.375% (unchanged; 7:2:7); 2021 = 3.375% (5:4:7) and longer run = 3.00% (+12.5bps; 2:6:7). This implies that policy will be at neutral in 2Q19 and tight thereafter. With regards to median voting patterns, hawkish/dovish surprise for 2019, 2020, and 2021 requires 3, 1, and 3 voters and 1, 1, and 1 voter to flip, pointing to a dovish skew in 2019 and 2021 and a more hawkish skew in 2020. Following a 12.5bps increase to 3%, longer-run projection are more anchored (requires 6 voters to flip hawkish, compared to just 1 for a more dovish outcome). Number (remaining) of hikes in 2018, 2019 ,2020 and 2021 is 1-3-1-0.
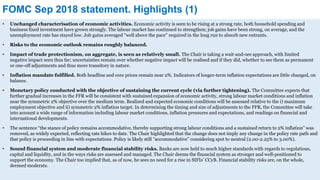
  • 3. FFRs and money markets 0.00 0.25 0.50 0.75 1.00 1.25 1.50 1.75 2.00 2.25 Jan-15 Jul-15 Jan-16 Jul-16 Jan-17 Jul-17 Jan-18 Jul-18 % Eff FFR IOER 1Mth T-Bills ON RRP Target FFR 0.00 0.25 0.50 0.75 1.00 1.25 1.50 1.75 2.00 2.25 2.50 Jan-15 Jul-15 Jan-16 Jul-16 Jan-17 Jul-17 Jan-18 Jul-18 % IOER 90d CP 90d Libor 90d T-bills 90d OIS Effective FFR 0 500 1,000 1,500 2,000 2,500 3,000 3,500 4,000 4,500 5,000 Jan-00 Jan-02 Jan-04 Jan-06 Jan-08 Jan-10 Jan-12 Jan-14 Jan-16 Jan-18 US$ Bil Fed Total Assets Banks' Reserves Balance 8 9 10 11 12 13 14 15 16 17 2 4 6 8 10 12 Mar-00 Mar-02 Mar-04 Mar-06 Mar-08 Mar-10 Mar-12 Mar-14 Mar-16 Mar-18 Consumer Credit Interest, % New Car 5/1Yr ARM CC (RHS) Personal Loans (RHS) 2,000 2,500 3,000 3,500 4,000 4,500 5,000 -10 -5 0 5 10 15 20 25 30 35 40 Jan-10 Jan-11 Jan-12 Jan-13 Jan-14 Jan-15 Jan-16 Jan-17 Jan-18 Federal Reserve, %yoy Thousands US$ BilAssets, B/S (RHS) %yoy
  • 4. Fed policy trajectory Policy likely to follow guidance in 4Q18/1H19. Monetary policy is likely to follow Fed guidance in 4Q18/1H19, considering current growth/inflation and labour market dynamics. Both the employment/inflation mandates are broadly met with policy, going forward, conducted with the objective of sustaining the cycle (via further tightening in the next 6-9 months). Hence, the Fed will likely continue to tighten policy in 1Q18 (+25bps to 2.25-2.50%) and 1H19 (+50bps to 2.50-3.00%). FFR decisions, on the margin, can be viewed through three key considerations, i) economic developments (data dependency) and hurdle to tightening, considering degree of spare capacity (NAIRU, LFPR and inflation) – inflation at target, job gains being deemed (too) brisk with the unemployment rate under-shooting NAIRU projections; ii) degree of accommodation (75bps to neutral at 3.00% according to dot-plot; monetary models imply around 100bps of buffer before neutral); and iii) orthodox central banking assumption of monetary policy lag. Our framework of understanding Fed decisions have changed at the margin with point ii (concept of “neutral” becoming a drifting anchor) and iii (data dependency; feedback from realised rather than positioning policy further into the future) likely to play a more diminished role under Chair Powell (“pragmatism” over theoretical models; though with uncertainties over buy-in from more theoretically attuned Fed members) and as time decays. The increased focus on data dependency will introduce higher uncertainties into markets’ perception of the policy path. Just-in-time policy making. Going into 2H19, the policy outlook will become increasingly uncertain. The median Fed is projecting a further +75bps increase in 2019 (3.25%), +25bps increase in 2020 (3.50%) and then a pause in 2021. Our expectations remain for another 50bps in 2019 with the FFR hitting cycle terminal at 3%. As argued, we expect both domestic consumption (higher debt service and cost of living, slower pace of asset price appreciation, low real income gains) and capital expenditure (higher debt service, elevated current spending vis-à-vis GDP, weakening domestic demand, external uncertainties) to ease off, with the fiscal impulse peaking, financial conditions tightening, and impact of prior dollar strength. This should taper labour market gains and keep inflation pressures benign. The extent of slowdown will be dependent upon the resiliency of private sector balance sheet and the subsequent impact on demand. It is imperative that the Fed stays ahead in managing overall debt servicing costs (short-run implications on demand; longer-run may short-circuit the feedback from demand to capital spending and future productivity), and limit the negative impact of policy on overall growth.
  • 5. USTs, Scenarios 1. So far so good and all is well. As per guidance, the Committee will likely lean towards hiking insofar as the labour market remains robust (unemployment stable/falling), inflation near/above target, growth stable, coupled with a balanced risk profile (regardless of ex-ante perceived “neutrals”; no model outputs as anchor), with FFR passing neutral by 3Q19 (real FFR, =>100bps) and tightening further by 2020 (real FFR, 150bps). This will enable the Fed to sustain the expansion, by getting ahead of the labour market under-shoot and containing inflation, before moving back towards neutral with growth at target. End of cycle is likely to be caused by a build-up of fundamental fragility with time, leading to a break in the economic equilibrium. This scenario assumes certain degree of macro-economic resiliency, provide scope for productivity improvements (higher real rates), and anchoring (higher) inflation expectations. This is probably the Fed’s best hand (balancing the need to be reactive vis-à-vis pre-emptive). Rates should predominantly be driven by higher risk neutral with term premiums anchored (risk market friendly outcome); curve flattener with 5T and 10T capped by expectations of front-end FFR and terminal, <=3.25-3.50%. Scope remains for transition into curve steepening with higher long rates on realisation of higher productivity, pushing real potential growth and real neutral rate higher (front end pushing long end higher, subsequently, long end dragging short end higher; economic cycle extended). 2. Fed behind the curve. The Fed lose control of the labour market, unable to rein in the under-shoot, leading to higher wages with no productivity offset, margin compression and partial pass through to higher inflation. Term premium rises on a Fed that is deemed behind the curve. Fed changes tack and guide for higher rates, pushing risk neutral higher, in order to anchor term premiums, inverting the curve on a higher perceived terminal but still low neutral; curve steepener to curve flattener with low real neutral – long rates can trade >3.50% - depending on magnitude of imbalance, Fed’s subsequent reaction and perceived loss and recovery in policy credibility - but should remain bounded; short end can rise substantially. The combination of high terminal and low neutral will have a significant adverse impact on risk markets. 3. Structural changes starts to bind; no escape velocity. Growth and inflation starts to taper off as i) boost from the fiscal stimulus fades; ii) prior monetary tightening starts to bite; and iii) the downward pull from unresolved US (credit, wealth-driven economy; skewed labour/capital share) and global imbalances (Euro-zone fragmentation, internal balance; China de-leveraging while approaching balance sheet limits, re-structuring; EM stresses). This should be reflected in a peak in growth and inflation soon, coupled with a slowdown in labour gains as demand weakens. The Fed should pause/reverse the tightening cycle, in order to lower short rates to anchor longer-run risk neutral and term premiums. 5T and 10T should ease and re-anchor at a new perceived neutral and terminal (<2.50%). High valuations of markets will ensure that risk markets perform poorly on the turn in the cycle.
  • 6. USTs, Views (1) Markets currently are trading on scenario 1. Further upside surprises in estimates are required to push out the Fed’s FFR forecasts, within a base case of no growth/inflation disappointment (2018/2019 GDP, 3.1%/2.5% and Core PCE, 2.0%/2.1%). Near term outlook will be driven by i) market expectations of the degree of slack in the US – Fed ahead/behind the curve; ii) real-time reassessment of perceived secular fundamentals (where all the secular stars will be – r*, U*, Y*; separation between secular (neutral) and cyclical (terminal)); and iii) re-calibration of the level of Fed put – central banks’ reaction function and market perception vis-à-vis required magnitude and persistency of market stresses. Understandably, narratives have pushed the balance of risk towards higher yields. Our base case remains 3. We like rates structurally, both on adequate valuations (breakeven levels: 5y, 3.55% (2.98%); and 10y, 3.36% (3.09%)) and as a hedge for risk assets, taking the under on the (largely) priced base case of a smooth 3 year (2018-2020) rate hiking cycle. Based on our macro risk-neutral model and pure expectations, we see 1.80-2.50% and 2.10-2.30% on the UST 5 and 10. Our view is to stay long on the UST 5-10y, prefer 7y; tactical view suggests range trading, 10T around 2.80-3.20%, into 1H19 (Fed hikes by 75bps to 2.75-3.00% by 1H19; anchor extent of rates rally; near term upside risks of a Republican sweep of the mid-terms, providing the President and the Republican Party with another opportunity to pursue even looser (pro- wealth) fiscal policy. Risk neutral have scope to re-price lower with real risk-neutral 5y5y at close to 1.4% (compared to Fed’s 100bps; 60bps off 2005- 2007 bubble years and already surpassing 2008’s level, assuming unchanged term premiums), premised on a peak in growth/inflation into 2019, considering the cumulative impact of prior and prospective monetary tightening (into financing costs), a turn to negative in the fiscal impulse, amid more subdued global demand considering the tightening in financial condition (ex-US; more limited in the US) should start dampening the economic outlook.
  • 7. USTs, Views (2) We will not seek to drink the Kool-Aid, until more visible changes in the make-up of growth suggests otherwise (sustainably higher capex, productivity, labour share of income, more sustainable nature of global demand, easing debt burdens). We maintain that private sector debt loads remain too high to withstand sustained higher interest rates. We believe that current growth drivers are cyclical (fiscal policy will have a transitory impact on the economy via demand channels with spending targeted at wrong segments of the economy), not structural, and that latent secular dis-inflation impulses remains. To repeat, certain factors underlying the US (and global) economy seems highly persistent, a structural reflection of the current global growth model/political paradigm/broken models everywhere; Phillips curve (lower cost labour driven growth; no productivity); r* on consumption and investment and thus not transient (non-linear, easing have limited impact/tightening massive); a lack of substance in global re-balancing; rise in oligarchy); continued dependence on orthodox global central bank policy put – continues to suggest that one can ultimately position for the scenario of a shortened rate hiking cycle as limits are reached once cyclical strength fades. We maintain our view of a neutral no >2.5% (markets already higher). The narrative of omnipotent central banks will be severely tested, considering that monetary policy will have limited traction on growth outcomes, going forward (wealth/debt-driven consumption/investment via credit/portfolio re-balancing/signalling limited by debt-servicing/asset valuations – defaults/sell-off required first; broken monetary models); fiscal, FX, reforms will be required as policy tools (no stable global equilibrium – secular stagnation). -1.0 -1.2 0.4 0.1 0.1 0.7 -1.5 -1.0 -0.5 0.0 0.5 1.0 2018 2019 2020 2021 2022 2023 %Potential GDP Chng in Cyclically-adjusted Fiscal Policy -800 -600 -400 -200 0 200 400 600 1Q93 1Q97 1Q01 1Q05 1Q09 1Q13 1Q17 bps Growth spread-to-Interest Expense % GDP BBB Corps 5Y Interest Cost, UST + Spreads Non-fin Private interest expense Excess spread over GDP 5Y 3.92 5.70 -0.30 1Y5Y 4.08 5.94 -0.54 2Y5Y 4.13 6.01 -0.61 3Y5Y 4.16 6.05 -0.65 4Y5Y 4.18 6.08 -0.68 5Y5Y 4.21 6.12 -0.72 GDP Growth 5.40
  • 8. Rates markets Rates markets are broadly priced for 2018/2019, off by 25-50bps, with a pause expected close to 3.00%. Marking-to-market the better growth/inflation outlook and rolling prior rate hikes, the UST curve shifted higher with the curve up by 50-100bps with a flattening bias. YTD higher 10T is predominantly driven by higher implied real growth (50%), and to a lesser extent break-evens (30%) and term premiums (20%). Based on Fed’s projections, the risk-neutral fair value of the US5T and US10T is at 3.05% and 3.02%, compared to spot of 2.98% (+7bps) and 3.09% (-7), excluding term premiums. Our internal models based on spot nominal GDP (2Q18: 5.4%) suggests US5T and US10T FV at 3.14% and 3.20%. Markets have re-priced long run expectations of neutral, with the real risk neutral moving to 1.25- 1.50% (Fed forward estimate approx. 1.0%; nominal GDP assumption around 3.8%; PCE at 2.0%). We deem the UST curve well-priced. Longer–run rates are anchored by markets expectations of terminal and neutral around 3.00-3.25%. Sell-off will be led by higher term premiums with real neutral and break-evens adequately priced (unless real growth/inflation take off in a sustainable manner). 2.375 3.125 3.375 3.000 2.52 3.02 3.01 3.26 2.37 2.81 2.72 2.80 2.56 3.08 3.02 3.27 2.67 3.13 3.15 3.38 2.43 2.91 2.93 2.98 2.25 2.80 2.85 0.00 0.50 1.00 1.50 2.00 2.50 3.00 3.50 2018 2019 2020 % FOMC 1M UST FRs 1M OIS 1M Swaps Euro-dollar SOFR FFF Longer run 2.00 2.25 2.50 2.75 3.00 3.25 3.50 Current 3M 6M 9M 1Y 2Y 3Y 4Y 5Y 10Y Foward Curves, % 1Y 2Y 5Y 10Y 3M Year Fed Path Current Fed Path, Risk Neutral Breakeven Chng, bps 2018 2.375 5y 2.98 3.05 72 2019 3.125 10y 3.09 3.02 39 2020 3.375 2021 3.375 2022 3.000 2023 3.000 2024 3.000 2025 3.000 2026 3.000 2027 3.000 -2 -1 0 1 2 3 4 Jan-99 Jan-01 Jan-03 Jan-05 Jan-07 Jan-09 Jan-11 Jan-13 Jan-15 Jan-17 Real Risk Neutral, % Mkt perception of equilibrium real FFR 5y 10y 5y5y
  • 9. USTs, Curve flattening 0 1 2 3 4 5 6 7 8 9-150 -100 -50 0 50 100 150 200 Jan-90 Jan-96 Jan-02 Jan-08 Jan-14 % reverse scale Risk Neutral bps 10y2y 5y2y 10y5y FFR (RHS) 0 1 2 3 4 5 6 7 8 9-50 0 50 100 150 200 250 300 Jan-90 Jan-96 Jan-02 Jan-08 Jan-14 % reverse scale TP, bps 10y2y 5y2y 10y5y FFR (RHS) 0 1 2 3 4 5 6 7 8 -150 -100 -50 0 50 100 150 200 250 Jan-97 Jan-00 Jan-03 Jan-06 Jan-09 Jan-12 Jan-15 Jan-18 %bps 18M3M - 3M (LHS) 18M3M 3M 0 50 100 150 200 250 300 Jan-12 Jul-12 Jan-13 Jul-13 Jan-14 Jul-14 Jan-15 Jul-15 Jan-16 Jul-16 Jan-17 Jul-17 Jan-18 Jul-18 bps 10y2y 10y2y, 1yfwd 10y2y, 2yfwd 10y2y, 3yfwd
  • 10. USTs, Technicals -12 -10 -8 -6 -4 -2 0 Jan-98 Jan-01 Jan-04 Jan-07 Jan-10 Jan-13 Jan-16 Maximum drawdown, 3Yr, % Barclays UST 7-10Yrs Max Drawdown 1.00 1.25 1.50 1.75 2.00 2.25 2.50 2.75 3.00 3.25 3.50 Jan-16 Jul-16 Jan-17 Jul-17 Jan-18 Jul-18 % 10-Yr Treasury 50 WMA +2stdev -2stdev -3 -2 -1 0 1 2 3 4 5 Jan-16 Apr-16 Jul-16 Oct-16 Jan-17 Apr-17 Jul-17 Oct-17 Jan-18 Apr-18 Jul-18 52wk z-score Copper/Gold Oil/Gold Ratio Metals/Gold Lumber/Gold Risk off 0 1 2 3 4 5 6 7 8 Jan-98 Jan-00 Jan-02 Jan-04 Jan-06 Jan-08 Jan-10 Jan-12 Jan-14 Jan-16 Jan-18 % US10T US10T, ISM Model +1stdev -1stdev