QNBFS Daily Market Report February 13, 2020
•
0 likes•17 views

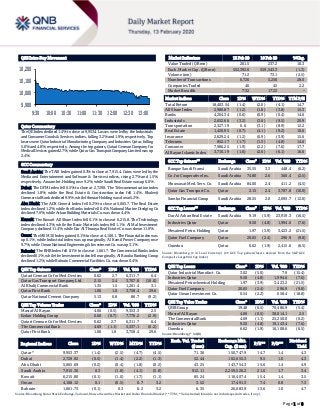
The QE Index declined 1.4% to close at 9,953.4. Losses were led by the Industrials and Consumer Goods & Services indices, falling 3.2% and 1.9%, respectively.

Recommended
Recommended
More Related Content
More from QNB Group
More from QNB Group (20)
Recently uploaded
Recently uploaded (20)
QNBFS Daily Market Report February 13, 2020
- 1. ` Page 1 of 8 QSE Intra-Day Movement Qatar Commentary The QE Index declined 1.4% to close at 9,953.4. Losses were led by the Industrials and Consumer Goods & Services indices, falling 3.2% and 1.9%, respectively. Top losers were Qatar Industrial Manufacturing Company and Industries Qatar, falling 5.0% and 4.8%, respectively. Among the top gainers, Qatari German Company for Medical Devices gained 2.7%, while Qatar Gas Transport Company Limited was up 2.4%. GCC Commentary Saudi Arabia: The TASI Index gained 0.3% to close at 7,915.4. Gains were led by the Media and Entertainment and Software & Services indices, rising 2.7% and 1.5%, respectively. Anaam Int. Holding rose 9.2%, while Saudi Real Estate was up 6.0%. Dubai: The DFM Index fell 0.5% to close at 2,729.9. The Telecommunication index declined 1.8%, while the Real Estate & Construction index fell 1.4%. Khaleeji Commercial Bank declined 9.9%, while Ithmaar Holding was down 5.2%. Abu Dhabi: The ADX General Index fell 0.2% to close at 5,065.7. The Real Estate index declined 1.2%, while the Banks index fell 0.4%. National Marine Dredging Co declined 7.0%, while Arkan Building Materials Co. was down 4.4%. Kuwait: The Kuwait All Share Index fell 0.1% to close at 6,215.8. The Technology index declined 4.3%, while the Basic Materials index fell 1.1%. Al Mal Investment Company declined 11.4%, while Dar Al Thuraya Real Estate Co. was down 11.0%. Oman: The MSM 30 Index gained 0.1% to close at 4,108.1. The Financial index was up 0.1%, while Industrial index was up marginally. Al Kamil Power Company rose 9.7%, while Oman National Engineering & Investment Co. was up 3.1%. Bahrain: The BHB Index fell 0.1% to close at 1,661.7. The Commercial Banks index declined 0.1%, while the Investment index fell marginally. Al Baraka Banking Group declined 1.2%, while Bahrain Commercial Facilities Co. was down 0.4%. QSE Top Gainers Close* 1D% Vol. ‘000 YTD% Qatari German Co for Med. Devices 0.62 2.7 6,311.7 6.4 Qatar Gas Transport Company Ltd. 2.15 2.4 3,707.8 (10.0) Al Khalij Commercial Bank 1.35 1.5 1,261.4 3.1 Qatar First Bank 1.06 1.0 3,758.4 29.6 Qatar National Cement Company 5.13 0.8 86.7 (9.2) QSE Top Volume Trades Close* 1D% Vol. ‘000 YTD% Masraf Al Rayan 4.06 (0.5) 9,353.3 2.5 Ezdan Holding Group 0.60 (0.7) 7,776.2 (2.9) Qatari German Co for Med. Devices 0.62 2.7 6,311.7 6.4 The Commercial Bank 4.69 (1.1) 5,337.1 (0.2) Qatar First Bank 1.06 1.0 3,758.4 29.6 Market Indicators 12 Feb 20 10 Feb 20 %Chg. Value Traded (QR mn) 261.5 237.2 10.3 Exch. Market Cap. (QR mn) 552,392.6 559,543.3 (1.3) Volume (mn) 71.2 73.1 (2.5) Number of Transactions 6,726 5,256 28.0 Companies Traded 46 45 2.2 Market Breadth 7:32 17:22 – Market Indices Close 1D% WTD% YTD% TTM P/E Total Return 18,403.54 (1.4) (2.0) (4.1) 14.7 All Share Index 2,980.87 (1.2) (1.8) (3.8) 15.3 Banks 4,204.34 (0.6) (0.9) (0.4) 14.6 Industrials 2,652.66 (3.2) (3.6) (9.5) 20.9 Transportation 2,327.19 0.6 (3.1) (8.9) 12.2 Real Estate 1,420.95 (0.7) (4.1) (9.2) 10.6 Insurance 2,629.24 (1.2) (0.9) (3.9) 15.6 Telecoms 852.17 (1.7) (1.3) (4.8) 14.6 Consumer 7,986.25 (1.9) (2.2) (7.6) 17.7 Al Rayan Islamic Index 3,710.19 (1.6) (2.6) (6.1) 16.0 GCC Top Gainers## Exchange Close# 1D% Vol. ‘000 YTD% Banque Saudi Fransi Saudi Arabia 35.55 3.3 448.4 (6.2) Co. for Cooperative Ins. Saudi Arabia 74.80 2.6 360.4 (2.5) Mouwasat Med. Serv. Co. Saudi Arabia 84.00 2.4 411.2 (4.5) Qatar Gas Transport Co. Qatar 2.15 2.4 3,707.8 (10.0) Samba Financial Group Saudi Arabia 28.55 2.0 2,695.7 (12.0) GCC Top Losers## Exchange Close# 1D% Vol. ‘000 YTD% Dar Al Arkan Real Estate Saudi Arabia 9.19 (5.9) 23,919.3 (16.5) Industries Qatar Qatar 9.50 (4.8) 1,994.6 (7.6) Mesaieed Petro. Holding Qatar 1.97 (3.9) 3,423.2 (21.5) Qatar Fuel Company Qatar 20.65 (2.4) 296.9 (9.8) Ooredoo Qatar 6.62 (1.9) 2,415.6 (6.5) Source: Bloomberg (# in Local Currency) (## GCC Top gainers/losers derived from the S&P GCC Composite Large Mid Cap Index) QSE Top Losers Close* 1D% Vol. ‘000 YTD% Qatar Industrial Manufact. Co. 3.02 (5.0) 7.9 (15.4) Industries Qatar 9.50 (4.8) 1,994.6 (7.6) Mesaieed Petrochemical Holding 1.97 (3.9) 3,423.2 (21.5) Qatar Fuel Company 20.65 (2.4) 296.9 (9.8) Qatar Oman Investment Co. 0.54 (2.2) 658.4 (18.8) QSE Top Value Trades Close* 1D% Val. ‘000 YTD% QNB Group 19.48 (0.5) 70,486.9 (5.4) Masraf Al Rayan 4.06 (0.5) 38,014.1 2.5 The Commercial Bank 4.69 (1.1) 25,250.0 (0.2) Industries Qatar 9.50 (4.8) 19,143.4 (7.6) Ooredoo 6.62 (1.9) 16,108.6 (6.5) Source: Bloomberg (* in QR) Regional Indices Close 1D% WTD% MTD% YTD% Exch. Val. Traded ($ mn) Exchange Mkt. Cap. ($ mn) P/E** P/B** Dividend Yield Qatar* 9,953.37 (1.4) (2.5) (4.7) (4.5) 71.36 150,747.9 14.7 1.4 4.3 Dubai 2,729.92 (0.5) (1.4) (2.2) (1.3) 52.44 102,655.3 9.5 1.0 4.3 Abu Dhabi 5,065.69 (0.2) (0.4) (1.8) (0.2) 43.25 143,754.3 15.6 1.4 4.9 Saudi Arabia 7,915.36 0.3 (1.8) (4.1) (5.8) 912.11 2,259,526.2 21.6 1.7 3.4 Kuwait 6,215.80 (0.1) (1.0) (1.7) (1.1) 85.24 116,407.4 15.4 1.4 3.5 Oman 4,108.12 0.1 (0.5) 0.7 3.2 3.52 17,491.3 7.4 0.8 7.3 Bahrain 1,661.73 (0.1) 0.3 0.2 3.2 6.35 26,083.9 13.6 1.0 4.7 Source: Bloomberg, Qatar Stock Exchange, Tadawul, Muscat Securities Market and Dubai Financial Market (** TTM; * Value traded ($ mn) do not include special trades, if any) 9,900 10,000 10,100 10,200 9:30 10:00 10:30 11:00 11:30 12:00 12:30 13:00
- 2. Page 2 of 8 Qatar Market Commentary The QE Index declined 1.4% to close at 9,953.4. The Industrials and Consumer Goods & Services indices led the losses. The index fell on the back of selling pressure from GCC shareholders despite buying support from Qatari and non-Qatari shareholders. Qatar Industrial Manufacturing Company and Industries Qatar were the top losers, falling 5.0% and 4.8%, respectively. Among the top gainers, Qatari German Company for Medical Devices gained 2.7%, while Qatar Gas Transport Company Limited was up 2.4%. Volume of shares traded on Wednesday fell by 2.5% to 71.2mn from 73.1mn on Monday. Further, as compared to the 30-day moving average of 82.0mn, volume for the day was 13.2% lower. Masraf Al Rayan and Ezdan Holding Group were the most active stocks, contributing 13.1% and 10.9% to the total volume, respectively. Source: Qatar Stock Exchange (* as a % of traded value) Earnings Releases, Global Economic Data and Earnings Calendar Earnings Releases Company Market Currency Revenue (mn) 4Q2019 % Change YoY Operating Profit (mn) 4Q2019 % Change YoY Net Profit (mn) 4Q2019 % Change YoY Dxb Entertainments* Dubai AED 491.2 -9.1% – – (924.8) N/A Gfh Financial Group* Dubai USD 335.7 17.3% – – 80.1 -29.8% Emaar Malls* Dubai AED 4,673.0 5.1% 2,462.1 3.1% 2,285.6 2.5% Dubai Refreshments Company* Dubai AED 596.0 -8.7% 38.3 -44.4% 42.3 -37.2% National Cement Company* Dubai AED 190.8 -15.7% (25.0) N/A 51.4 N/A Gulf Cement Co.* Abu Dhabi AED 443.6 -6.8% – – (26.8) N/A Fujairah Building Industries* Abu Dhabi AED 218.4 -12.0% 43.6 2.1% 47.3 1.9% Emirates Telecom Group Co.* Abu Dhabi AED 52,186.0 -0.4% 11,798.0 -6.9% 8,693.0 0.9% Gulf Medical Projects* Abu Dhabi AED 534.9 13.7% 136.3 21.0% 69.8 -41.6% Aldar Properties* Abu Dhabi AED 7,147.9 13.7% – – 1,984.1 6.9% Umm Al Qaiwain General Investment* Abu Dhabi AED – – – – 22.6 43.4% Dana Gas* Abu Dhabi AED 1,682.0 -2.4% – – 575.0 N/A Source: Company data, DFM, ADX, MSM, TASI, BHB. (# – Values in Thousands, *Financial for FY2019) Global Economic Data Date Market Source Indicator Period Actual Consensus Previous 02/12 US Mortgage Bankers Association MBA Mortgage Applications 7-Feb 1.10% – 5.00% 02/12 EU Eurostat Industrial Production SA MoM Dec -2.10% -2.00% 0.00% 02/12 EU Eurostat Industrial Production WDA YoY Dec -4.10% -2.50% -1.70% 02/12 Japan Bank of Japan Money Stock M2 YoY Jan 2.80% 2.70% 2.70% 02/12 Japan Bank of Japan Money Stock M3 YoY Jan 2.30% 2.30% 2.30% 02/12 India India Central Statistical Organization CPI YoY Jan 7.59% 7.40% 7.35% 02/12 India India Central Statistical Organization Industrial Production YoY Dec -0.30% 1.70% 1.80% Source: Bloomberg (s.a. = seasonally adjusted; n.s.a. = non-seasonally adjusted; w.d.a. = working day adjusted) Overall Activity Buy %* Sell %* Net (QR) Qatari Individuals 18.32% 17.08% 3,229,073.46 Qatari Institutions 25.38% 20.33% 13,225,074.47 Qatari 43.70% 37.41% 16,454,147.92 GCC Individuals 1.13% 0.87% 689,803.41 GCC Institutions 0.64% 14.71% (36,793,564.41) GCC 1.77% 15.58% (36,103,761.00) Non-Qatari Individuals 5.64% 5.50% 363,237.54 Non-Qatari Institutions 48.88% 41.51% 19,286,375.54 Non-Qatari 54.52% 47.01% 19,649,613.08
- 3. Page 3 of 8 Earnings Calendar Tickers Company Name Date of reporting 4Q2019 results No. of days remaining Status SIIS Salam International Investment Limited 13-Feb-20 0 Due ORDS Ooredoo 13-Feb-20 0 Due QEWS Qatar Electricity & Water Company 16-Feb-20 3 Due DHBK Doha Bank 17-Feb-20 4 Due QGTS Qatar Gas Transport Company Limited (Nakilat) 17-Feb-20 4 Due AHCS Aamal Company 18-Feb-20 5 Due MERS Al Meera Consumer Goods Company 19-Feb-20 6 Due GISS Gulf International Services 19-Feb-20 6 Due MPHC Mesaieed Petrochemical Holding Company 20-Feb-20 7 Due QNNS Qatar Navigation (Milaha) 25-Feb-20 12 Due QGRI Qatar General Insurance & Reinsurance Company 26-Feb-20 13 Due QISI Qatar Islamic Insurance Group 26-Feb-20 13 Due Source: QSE News Qatar QAMC reports net profit of QR19.5mn in 4Q2019 – Qatar Aluminium Manufacturing Company (QAMC) reported net profit of QR19.5mn in 4Q2019. The company's share of profit of a joint venture came in at QR18.3mn in 4Q2019. For the first financial year consisting of the 13-month period that ended December 31, 2019, QAMC’s net profit stood at QR80.0mn, with QAMC’s share of the joint venture’s EBITDA at QR704mn for 2019. QAMC’s share of revenue for the financial period amounted to QR2.7bn. The company's share of profit of a joint venture came in at QR85.93mn for the first financial year consisting of the 13- month period that ended December 31, 2019. The company recorded EPS of QR0.0143 for the first financial period ended December 31, 2019. During the year, profitability remained resilient despite a combination of factors affecting performance, including lowered revenues, one-off impairment losses and increased financing costs on account of interest costs recognized in leases capitalized under IFRS 16, which were partially offset by one-off sale of alumina and insurance claims. QAMC’s average selling prices fell by 12% during 2019, which was largely attributable to the decline in global market prices for aluminum, which led to a decrease of QR365mn in net earnings when compared with the last pro-forma period. This was slightly offset by the positive variance in sales volumes, which marginally increased by 2%, and translated into an increase of QR45mn in the net earnings. Environmental restrictions and sanctions played a vital role in affecting aluminum prices. Also, the channeling of historically built excess inventories by aluminum producers into the market pressured prices. By contrast, QAMC’s LME price premiums remained stable which is a reflection of the JV’s resilience in the negative environment. LME premiums averaged approximately 12% of LME realized prices. QAMC’s total assets as of December 31, 2019 stood at QR5.7bn, with bank balances amounting to QR103mn. QAMC’s share of net debt in the JV decreased by 17% during 2019, to reach QR1.9bn as of December 31, 2019, after considering share of cash and bank balances amounting to QR497mn. Given the financial performance of the company which was broadly affected by the macroeconomic conditions throughout the period, which pressured the overall profitability of the company, the board of directors proposed a dividend distribution for the period ended December 31, 2019 of QR55.8mn, equivalent to a payout of QR0.01 per share. This is in addition to the interim dividend of QR111.6mn paid on May 5, 2019, equivalent to QR0.02 per share, which was distributed to shareholders during the year in relation to the six month period ended December 31, 2018. The total dividends paid during the period amounted to QR167.4mn representing a payout of 3% of the nominal value of the shares. The overall cost of goods sold remained stable on account of declining raw material prices, which was offset primarily by high energy cost consumption during steam turbine overhauls. Alumina prices declined at a slower rate than aluminum prices, which depressed the industry margins. At the same time, QAMC’s JV leveraged its contracts for alumina supplies to outperform the market, which led to supply chain optimization. This competitive advantage will continue to contribute sustained growth and will support the JV to maintain its market standing. QAMC’s business performance in 2019 was impacted by the challenging macroeconomic environment. Most of the demand for aluminum was met by excess inventories built up over previous years, which were sold at lower market rates and which exerted downward pressure on aluminum prices. Global aluminum prices on average declined by 13% compared to the last year. QAMC responded to the adverse market climate by increasing the efficiency of its joint venture, with sales and production volumes remaining largely stable compared with 2018 levels, recording marginal increases of 2% and 1%, respectively. The increase in sales volume is a testament to the company’s global marketing partnership, which provided access to strategic markets to compete with international players. (Company Press Release) QCFS' net profit declines ~63% YoY and ~39% QoQ in 4Q2019 – Qatar Cinema and Film Distribution Company's (QCFS) net profit declined ~63% YoY (-~39% QoQ) to ~QR0.8mn (~ QR782 thousands) in 4Q2019. In FY2019, QCFS posted net profit of QR6.38mn compared to net profit amounting to QR8.45mn for
- 4. Page 4 of 8 the same period of the previous year. EPS amounted to QR0.102 in FY2019 as compared to QR0.135 in FY2018. A recommendation to distribute of a cash dividend of 10% of the nominal share value i.e. QR0.10 per share. (QSE) QGRI postpones its board meeting to February 26 – Qatar General Insurance & Reinsurance Company (QGRI) has postponed its board meeting to February 26, 2020 instead of February 17, 2020, to discuss the financial statements for the year ended December 31, 2019. (QSE) QIMD investor relation conference call to be held on February 13 – Qatar Industrial Manufacturing Company (QIMD) announced that the investor relation conference call will be held on February 13, 2020, to discuss the financial statements ended December 31, 2019. (QSE) QFBQ issues a supplementary disclosure on sale of a subsidiary – Qatar First Bank (QFBQ) has announced its full adherence to disclosure and transparency regulations on the sale in accordance with the regulatory requirements pursuant to the provisions of Article 2/2 of the Merger & Acquisition rules. There is no expected effect of the completion of the sale transaction on the profit and loss account. QFBQ will benefit from liquidating this investment and reinvesting it in other, better liquidity investments. As is customary in similar deals, the bank provided guarantees and guarantees equivalent to about $3.5mn. This transaction does not entail any conflict of interest. As for Article 2.2, the following are the required data: (1) The bidder company is called Toban Gravity Company, a Hong Kong-based printing company, which is a private company affiliated to Toban Print Company listed on the Tokyo Stock Exchange. (2) The sale was made through FutureCard Technologies, a subsidiary of the bank, and the subsidiary sold all of its shares in Future Industries Holding, established in the Abu Dhabi global market. Whereas, Future Industries Holding is a holding company whose sole objective is to hold 100% of the shares of Futurecard Industries, which is the operating asset of the acquisition. Futurecard Industries is headquartered in Sharjah, with a paid up capital of AED20mn. FutureCard Industries is one of the leading companies in the manufacture of smart cards. (3) QFBQ owns 71.3% of FutureCard Technologies. The other shareholders of the company are Nizar Rajoub, 23%, and Omar Al Shamsi, 5.7%. FutureCard Technologies holds 100% of Future Industries Holding shares. (4) The acquiring company acquired the bank’s full shares amounting to 71.30%. The offer was for all shares or none. (5) The bank's exit was made with a total amount of $22mn. (6) The aim of the acquisition is to grow and expand in the markets of the Middle East region. (7) The graduation process took place during the month of October 2019. (8) The Futurecard Industries Company is headquartered in Sharjah with a paid up capital of AED20mn. FutureCard Industries is one of the leading companies in the manufacture of smart cards. (9) The value of the acquisition was $22mn and the process was done through internal sources without using debt or external financing. (10) Attached herewith the financial statements of FutureCard Industries, which represents the operating asset of the acquisition. As for the bidder, we requested this information and were told it is private. (QSE) Cabinet nod for strategy to develop real estate sector – The Cabinet has approved a decision to form a committee charged with implementing a strategy on developing the country's real estate sector. This came during the Cabinet's regular meeting on Wednesday. The new project will see the Ministry of Municipality and Environment establish a temporary committee concerned with the strategy on developing the real estate sector, the official Qatar News Agency (QNA) reported. The committee will be chaired by HE the Minister of Municipality and Environment, with membership from the designated authorities. Some of the powers of the committee will be to propose a strategy to develop the real estate sector as well as the required policies and plans required to achieve the strategy. (Gulf- Times.com) International US government posts $33bn budget deficit in January – The US government recorded a $33bn budget deficit in January, the Treasury Department said on Wednesday. That compared to a budget surplus of $9bn in the same month a year earlier, according to the Treasury’s monthly budget statement. Analysts polled by Reuters had forecasted an $11.5bn deficit for last month. Unadjusted receipts last month totaled $372bn, up 10% from January 2019, while unadjusted outlays were $405bn, a jump of 22% from the same month a year earlier. When adjusted for calendar effects, the deficit for January was $200mn compared with an adjusted deficit of $12bn in January of last year. (Reuters) Mortgage applications increase in latest MBA weekly survey – Mortgage applications increased 1.1% from one week earlier, according to data from the Mortgage Bankers Association's (MBA) Weekly Mortgage Applications Survey for the week ending February 7, 2020. The Market Composite Index, a measure of mortgage loan application volume, increased 1.1% on a seasonally adjusted basis from one week earlier. On an unadjusted basis, the Index increased 3% compared with the previous week. The Refinance Index increased 5% from the previous week and was 207 percent higher than the same week one year ago. The seasonally adjusted Purchase Index decreased 6% from one week earlier. The unadjusted Purchase Index increased 0.3% compared with the previous week and was 16 percent higher than the same week one year ago. The refinance share of mortgage activity increased to 65.5% of total applications from 64.5% the previous week. The adjustable-rate mortgage (ARM) share of activity increased to 6.2% of total applications. The FHA share of total applications increased to 9.7% from 9.6% the week prior. The VA share of total applications decreased to 10.1% from 10.2% the week prior. The USDA share of total applications remained unchanged from 0.4% the week prior. The average contract interest rate for 30- year fixed-rate mortgages with conforming loan balances ($510,400 or less) increased to 3.72% from 3.71%, with points remaining unchanged at 0.28 (including the origination fee) for 80% loan-to-value ratio (LTV) loans. The effective rate remained unchanged from last week. (MBA) RICS: UK house prices jump by most since 2017 in post-election bounce – British house prices rose at the fastest pace in nearly three years last month, according to a closely watched survey that adds to signs of a rebound in consumer sentiment since December’s election lifted some Brexit uncertainty. The Royal Institution of Chartered Surveyors’ (RICS) monthly house price
- 5. Page 5 of 8 index surged to +17 in January from -2 in December, its highest reading since May 2017 and above all forecasts from economists in a Reuters poll. The growth was driven by a turnaround in London and southeast England, which had previously underperformed due to higher property purchase taxes and the prospect of Britain leaving the European Union in a disorderly way. Mortgage lender Halifax reported a 4.1% annual rise in house prices in January, the biggest increase since February 2018, and the Bank of England said lenders approved the most new mortgages since July 2017. (Reuters) Eurozone’s industrial output tumbles more than expected in December – Eurozone’s manufacturing output plunged more than expected in December ending a weak quarter for the single currency area, official estimates showed on Wednesday. Industrial production fell 2.1% MoM in the 19-countries sharing the euro, the EU statistics agency Eurostat said, in a slump that was worse than the 1.6% fall predicted by economists polled by Reuters. On YoY basis output fell 4.1%, much more than market forecasts of a 2.3% drop. The negative monthly reading followed a 0.9% drop in October and a stalled production in November, which was revised down on Wednesday from the previously estimated 0.2% rise, as Eurozone manufacturers were battered by global trade tensions. Production in December fell significantly in all major economies in the bloc, pointing to a possible downward revision of GDP growth for the last quarter. At the end of January, before the output data was known, Eurostat estimated the Eurozone grew 0.1% in the last quarter. (Reuters) India's December industrial output contracts 0.3% – India’s industrial output contracted 0.3% in December from a year earlier, government data showed on Wednesday. Analysts polled by Reuters had forecasted industrial output to rise 1.8%. The cumulative growth in April-December over the corresponding period of the previous year was 0.5%, the data showed. (Reuters) India's January retail inflation rises, industrial output shrinks – India’s annual retail inflation accelerated to its highest level in nearly six years, while industrial output unexpectedly contracted, showing that Asia’s third-largest economy remains troubled. Annual retail inflation rose to 7.59% in January, partly driven by rising vegetable prices. December industrial output contracted 0.3%, after rising for the first time in three months in November. The inflation rate was above December’s 7.35%, the 7.40% forecast in a Reuters poll of economists and the Reserve Bank of India’s medium-term target of 4%, the data released by the Ministry of Statistics on Wednesday showed. Economists said the rising inflation could prompt the Reserve Bank of India to leave interest rates unchanged in coming months as it tries to support the faltering economy. Retail inflation touched 8.33% in May 2014, according to Refinitiv data. Reuters analysts had forecasted a rise of 1.8% in industrial output for December. It contracted because of a 1.2% decline in manufacturing and 0.1% drop in electricity. (Reuters) Regional Most Russian oil firms want OPEC+ deal extended into second- quarter – Most Russian oil companies want OPEC’s global output curbs to remain in place for one more quarter, however, Moscow has still not made a final decision on a possible new deal with OPEC and its allies, a senior Lukoil official said. Saudi Arabia has been trying to persuade Russia to join deeper oil production cuts. Moscow has said it will disclose its stance in the coming days. The current agreement on oil output curbs between the OPEC and its allies led by Russia expires at the end of March. Russia has played a central role in the alliance between OPEC and non- OPEC oil exporters, known as OPEC +, since they began coordinating moves on the oil market in 2016. The OPEC and non-OPEC countries are due to meet in early March to discuss further action, but there have been calls to bring forward that meeting due to coronavirus’s impact on oil prices. “The decision has not been taken, we discussed all (scenarios). Most (of the companies) are leaning towards extending for one quarter,” Lukoil’s first Executive Vice President, Ravil Maganov said. (Reuters) OPEC says coronavirus to trim 2020 oil demand, weighs output cut – OPEC cut its forecast for global growth in oil demand this year due to the coronavirus outbreak and said its output fell sharply in January as producers implemented a new supply- limiting pact. In a report, OPEC said 2020 demand for its crude will average 29.30mn bpd, 200,000 bpd less than previously thought. OPEC pumped below that rate in January, suggesting a 2020 supply deficit. The report could bolster the case for even more supply curbs by the OPEC, which is considering whether to curb output further to offset slower demand. Oil has fallen 15% this year to $55 a barrel, alarming producers. “The impact of the coronavirus outbreak on China’s economy has added to the uncertainties surrounding global economic growth in 2020, and by extension global oil demand growth,” OPEC said in the report. “Clearly, the ongoing developments in China require continuous monitoring and assessment.” In the report, OPEC said world oil demand will rise by 990,000 bpd this year, down 230,000 bpd from the previous forecast. That is less than the reduction made by the US government’s Energy Information Administration in its report. (Reuters) SoftBank profit wiped out by Vision Fund losses, second fund scaled back – Quarterly profit at SoftBank Group Corp was almost wiped out as the Japanese technology giant was hit for a second straight quarter by losses at its $100bn Vision Fund. The dismal results could further dampen investor enthusiasm for founder Masayoshi Son’s big bets on untested start-ups. While Son told a news conference SoftBank had turned a corner, he also said he has been forced to scale back a second Vision Fund while investing with only SoftBank’s own capital. That marks a major climbdown from July, when SoftBank said it had attracted $108bn in pledges for a second mega-fund. More pointedly, it shows how the bailout of start-up WeWork last year and other missteps have put a chill on the tech investing scene and given SoftBank shareholder Elliott ammunition to lobby for change. SoftBank executive flags some 50 'winners' in $100bn Vision Fund. Softbank's Vision Fund 2 stalls as key backers opt out. “We have caused a lot of concern,” Son said in Tokyo following the results, adding he needs to “give everyone peace of mind” to secure outside funds for Vision Fund 2. Group profit was 2.6 billion yen in the October-December quarter versus 438 billion yen a year before. The Vision Fund posted an operating loss of 225 billion yen for the quarter compared with a 176 billion yen profit in the same period a year earlier. However, Son, known for an ebullience and charisma that is still rare in corporate Japan,
- 6. Page 6 of 8 said the company’s performance was already improving. “The tide is turning,” he said. (Reuters) Softbank's Vision Fund 2 stalls as key backers opt out – Big investors who are critical to SoftBank Group’s plans for a second massive technology investment fund are refusing to take part unless the first $100bn Vision Fund can turn around its performance, sources told Reuters. SoftBank Chairman, Masayoshi Son acknowledged the lack of commitments for Vision Fund 2, but vowed to forge ahead with his investment strategy using SoftBank money. That approach could prove difficult in the wake of news last week that activist investor Elliott Management has built up a stake of nearly 3% in SoftBank and will pressure the company to spend its cash on share buybacks. The first Vision Fund lost $2.5bn in the quarter ended December, SoftBank reported, largely as a result of a disastrous bet on office-sharing company WeWork. Sources told Reuters the two biggest backers of the Vision Fund - Abu Dhabi’s state fund Mubadala and Saudi Arabia’s PIF sovereign wealth fund - had declined to commit to Vision Fund 2, though some conversations were ongoing. One of those sources said iPhone- maker Foxconn, which Son said last year had committed in principle to the new fund, was also pulling out. (Reuters) Saudi Arabia cuts March crude supply to some Asian buyers – The world’s top oil exporter Saudi Arabia has reduced crude supplies to some Asian buyers in March after refiners cut output following the coronavirus outbreak and for regular maintenance, sources said. The drop in supplies comes after state oil giant Saudi Aramco cut March official selling prices (OSPs) more than expected. Buyers’ overall nominations for March-loading cargoes were lower, but so far the virus has not had a big impact, a source familiar with Saudi Aramco oil exports said, adding that seasonal maintenance in Asia in the second quarter had made more difference. Sources declined to say how much lower the volumes were at their refineries, but said Saudi Aramco may have allowed some Chinese buyers to reduce their volumes by more than 10% as their situation was an exceptional case. (Reuters) Dubai Islamic Bank’s net income net profit at AED5.1bn, up by 2% YoY – Dubai Islamic Bank’s net income grew to AED9,267mn, up 13% YoY. The net profit at AED 5.1bn, up by 2% YoY. Cost to income ratio now at 26.9%, amongst the best in the market. Noor Bank acquisition complete, with integration underway to realize the synergies and boost returns. DIB Board has recommended an increase in Foreign Ownership Limit to 40%, subject to regulatory and corporate approvals . Total Income reached AED13,684mn, up by 17% YoY compared to AED11,730mn. Group net profit increased to AED5,103mn, up 2% YoY compared to AED5,004mn. Net Income grew to AED9,267mn, up 13% YoY compared to AED8,202mn. Operating expenses continue to be stable at AED2,358mn as compared to AED2,322mn in 2018. Net operating profit before impairment charges grew by 17% YoY to AED6,908mn. Cost to income ratio continues to improve now at 26.9% compared to 28.3% at the end of 2018. Net profit margin is at 3.15%, is at the higher end of the guidance for the year. ROA is at 2.25% and ROE is at 17.1% for the year. (Zawya) First Abu Dhabi Bank sells £450mn sterling bonds – First Abu Dhabi Bank (FAB) sold £450mn of three-year sterling- denominated bonds at 98 basis points (bps) over UK gilts, according to an investment note seen by Reuters. The debt sale has garnered around £1.25bn in demand, the note said. FAB hired Barclays, First Abu Dhabi Bank, HSBC and Nomura to lead the deal. The bank tightened the spreads after it began marketing the bonds at 115-120 bps over UK gilts earlier on Wednesday. The issuance is under FAB’s $15bn Euro medium-term note program. It follows a series of debt deals by Gulf banks, despite fund managers seeing the coronavirus outbreak as potentially hindering regional debt issues that were already expected to be slower this year. (Reuters) Abu Dhabi Islamic Bank 2019 net profit rises 4.0% to AED2,601.1mn – Abu Dhabi Islamic Bank (ADIB), announced a growth of 4.0% in net profit to AED2,601.1mn. Operating Profit increased 4.4% to AED3,262.2mn, driven by a 3.1% growth in customer financing to AED81.1bn, a 30.7% increase in investment income to AED687.0mn and a 23.6% rise in foreign exchange income to AED317.5mn. Group net revenues increased by 2.5% in 2019 to AED5,915.2mn. Group net revenues for 2019 grew by 2.5% to AED5,915.2 as compared to AED5,769.5mn in 2018 due to growth in customer finance and higher investment and foreign exchange income. Net profit margin was 4.25%, despite lower rates in the market, helped by the positive impact of the low cost of funds and a growth in customer financing. Operating expenses at AED2.6bn were flat YoY, reflecting cost discipline initiatives that led to a decrease of 1% in cost to income ratio. This was achieved despite investments in key strategic and digital initiatives designed to support business growth, enhance customer experience and create future efficiencies. Total assets as of December 31, 2019 were AED125.9bn, representing an increase of 0.6% from AED125.2bn at the end of December 31, 2018. Net customer financing increased by 3.1% to AED81.1bn from AED78.7bn at the end of December 31, 2018. Credit provisions and impairments for 2019 increased by 6.1% to AED658.1mn as compared to AED620.1mn in 2018, with net cost of risk increasing to an annualized 78 bps. CASA deposits increased by AED1.7bn (2.5% increase YoY) to AED69.8bn as at December 31, 2019, comprising 69% of the AED101.4bn total customer deposits compared to 67.8% a year earlier. The advances to stable funds ratio increased in 4Q2019 to 84.1% from 82.9% at December 31, 2018 reflecting its ability to make optimal use of the balance sheet. The bank’s common equity tier 1 ratio of 13.11% and capital adequacy ratio of 18.88% remains well above minimum requirements. (Zawya) UAE's Dana Gas receives bids for Egyptian assets – UAE-based Dana Gas said it has received bids from some companies for its assets in Egypt. “We have received a number of bids from a number of companies,” the company’s CEO, Patrick Allman- Ward said on an earnings call, declining to say how many bids or from which companies. The CEO said a final decision had not been taken on whether the company will sell its Egyptian assets. He said offers would be submitted to the company’s board for review and that a decision is expected by the end of March. He said the company would cover its outstanding Sukuk, or Islamic bonds, of $397mn, due on October 31, with the potential sale of its Egypt assets. The company is in talks with banks to refinance the Sukuk if the sale does not cover the whole amount, or if there is no sale, he said. “We received bids for the entire package of onshore and offshore” assets in Egypt, the CEO said, adding that the bidders were given flexibility to only bid for development
- 7. Page 7 of 8 leases and exclude exploration deals. Production from Egypt fell 4% to 33,000 barrels of oil equivalent per day (boepd) in 2019 from 34,500 boepd in 2018, the company said. He added that the company was disappointed by the Egyptian government failing to make overdue payments bythe end of 2019. The payments are part of $111mn in receivables expected from Egypt. He said part of that amount is overdue and part is in the process of payment. (Reuters) NBB posts 6.0% YoY rise in net profit to BHD74.2mn in FY2019 – National Bank of Bahrain (NBB) recorded net profit of BHD74.2mn in FY2019, an increase of 6.0% YoY. Net interest income rose 7% YoY to BHD93.3mn in FY2019. Total operating income rose 7.2% YoY to BHD125.8mn in FY2019. Total assets stood at BHD3.2bn at the end of December 31, 2019 as compared to BHD3.2bn at the end of December 31, 2018. Loans and advances stood at BHD1.2bn (+2% YoY), while customers’ deposits stood at BHD2.1bn (-4.4% YoY) at the end of December 31, 2019. EPS came in at 49 fils in FY2019 as compared to 46 fils in FY2018. (Bahrain Bourse) EIBANK's net profit falls 77.1% YoY to AED8.9mn in FY2019 – Emirates Investment Bank (EIBANK) recorded net profit of AED8.9mn in FY2019, registering decrease of 77.1% YoY. Revenue fell 7.5% YoY to AED175.7mn in FY2019. Net operating profit fell 11.6% YoY to AED120.3mn in FY2019. Total assets stood at AED3,120.4mn at the end of December 31, 2019 as compared to AED4,016.9mn at the end of December 31, 2018. Shareholder's equity stood at AED493.2mn (+4.8% YoY) at the end of December 31, 2019. EPS came in at AED12.64 in FY2019 as compared to AED52.79 in FY2018. (DFM) SALAM posts 14.0% YoY rise in net profit to BHD21.1mn in FY2019 – Al Salam Bank-Bahrain (SALAM) recorded net profit of BHD21.1mn in FY2019, an increase of 14.0% YoY. Finance income rose 20.9% YoY to BHD59.7mn in FY2019. Total operating income rose 8.0% YoY to BHD91.7mn in FY2019. Total assets stood at BHD2,038.2mn at the end of December 31, 2019 as compared to BHD1,710.4mn at the end of December 31, 2018. Financing assets stood at BHD723.2mn (+27.1% YoY), while placements from customers stood at BHD751.7mn (+18.2% YoY) at the end of December 31, 2019. EPS came in at 9.8 fils in FY2019 as compared to 8.7 fils in FY2018. (DFM)
- 8. Contacts Saugata Sarkar, CFA, CAIA Shahan Keushgerian Zaid al-Nafoosi, CMT, CFTe Head of Research Senior Research Analyst Senior Research Analyst Tel: (+974) 4476 6534 Tel: (+974) 4476 6509 Tel: (+974) 4476 6535 saugata.sarkar@qnbfs.com.qa shahan.keushgerian@qnbfs.com.qa zaid.alnafoosi@qnbfs.com.qa Mehmet Aksoy, PhD QNB Financial Services Co. W.L.L. Senior Research Analyst Contact Center: (+974) 4476 6666 Tel: (+974) 4476 6589 PO Box 24025 mehmet.aksoy@qnbfs.com.qa Doha, Qatar Disclaimer and Copyright Notice: This publication has been prepared by QNB Financial Services Co. W.L.L. (“QNB FS”) a wholly-owned subsidiary of Qatar National Bank (Q.P.S.C.). QNB FS is regulated by the Qatar Financial Markets Authority and the Qatar Exchange. Qatar National Bank (Q.P.S.C.) is regulated by the Qatar Central Bank. This publication expresses the views and opinions of QNB FS at a given time only. It is not an offer, promotion or recommendation to buy or sell securities or other investments, nor is it intended to constitute legal, tax, accounting, or financial advice. QNB FS accepts no liability whatsoever for any direct or indirect losses arising from use of this report. Any investment decision should depend on the individual circumstances of the investor and be based on specifically engaged investment advice. We therefore strongly advise potential investors to seek independent professional advice before making any investment decision. Although the information in this report has been obtained from sources that QNB FS believes to be reliable, we have not independently verified such information and it may not be accurate or complete. QNB FS does not make any representations or warranties as to the accuracy and completeness of the information it may contain, and declines any liability in that respect. For reports dealing with Technical Analysis, expressed opinions and/or recommendations may be different or contrary to the opinions/recommendations of QNB FS Fundamental Research as a result of depending solely on the historical technical data (price and volume). QNB FS reserves the right to amend the views and opinions expressed in this publication at any time. It may also express viewpoints or make investment decisions that differ significantly from, or even contradict, the views and opinions included in this report. This report may not be reproduced in whole or in part without permission from QNB FS. COPYRIGHT: No part of this document may be reproduced without the explicit written permission of QNB FS. Page 8 of 8 Rebased Performance Daily Index Performance Source: Bloomberg Source: Bloomberg Source: Bloomberg (# Market was closed on February 12, 2020) Source: Bloomberg (*$ adjusted returns) 60.0 80.0 100.0 120.0 140.0 Jan-16 Jan-17 Jan-18 Jan-19 Jan-20 QSEIndex S&PPanArab S&PGCC 0.3% (1.4%) (0.1%) (0.1%) 0.1% (0.2%) (0.5%) (1.8%) (1.2%) (0.6%) 0.0% 0.6% SaudiArabia Qatar Kuwait Bahrain Oman AbuDhabi Dubai Asset/Currency Performance Close ($) 1D% WTD% YTD% Global Indices Performance Close 1D%* WTD%* YTD%* Gold/Ounce 1,566.06 (0.1) (0.3) 3.2 MSCI World Index 2,434.95 0.6 1.3 3.2 Silver/Ounce 17.49 (0.9) (1.2) (2.0) DJ Industrial 29,551.42 0.9 1.5 3.5 Crude Oil (Brent)/Barrel (FM Future) 55.79 3.3 2.4 (15.5) S&P 500 3,379.45 0.6 1.6 4.6 Crude Oil (WTI)/Barrel (FM Future) 51.17 2.5 1.7 (16.2) NASDAQ 100 9,725.96 0.9 2.2 8.4 Natural Gas (Henry Hub)/MMBtu 1.91 4.9 1.6 (8.6) STOXX 600 431.16 0.2 1.0 0.5 LPG Propane (Arab Gulf)/Ton# 37.25 0.0 (3.2) (9.7) DAX 13,749.78 0.5 1.2 0.7 LPG Butane (Arab Gulf)/Ton# 48.88 0.0 (3.2) (26.4) FTSE 100 7,534.37 0.6 1.4 (2.3) Euro 1.09 (0.4) (0.7) (3.0) CAC 40 6,104.73 0.4 0.7 (1.1) Yen 110.09 0.3 0.3 1.4 Nikkei 23,861.21 0.4 (0.1) (0.2) GBP 1.30 0.1 0.5 (2.2) MSCI EM 1,109.70 0.9 1.7 (0.4) CHF 1.02 (0.3) (0.1) (1.1) SHANGHAI SE Composite 2,926.90 0.8 2.2 (4.2) AUD 0.67 0.3 1.0 (4.0) HANG SENG 27,823.66 0.8 1.5 (1.1) USD Index 99.05 0.3 0.4 2.8 BSE SENSEX 41,565.90 0.8 1.3 0.7 RUB 63.22 (0.3) (1.4) 2.0 Bovespa 116,674.10 0.8 1.7 (6.8) BRL 0.23 (0.6) (0.8) (7.7) RTS 1,557.44 1.2 2.6 0.6 119.8 114.8 95.4