Lundin Gold April 2024 Corporate Presentation v4.pdf
5 January Daily technical Trader
1. TECHNICAL ANALYSIS: QE INDEX AND KEY STOCKS TO CONSIDER
QE Index: Short-Term – Breakout
Al Rayan Islamic Index: Short-Term – Upmove
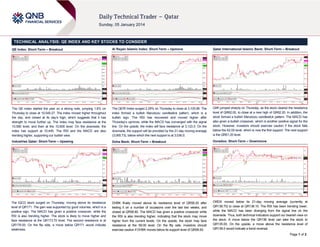
Qatar International Islamic Bank: Short-Term – Breakout
The QE index started the year on a strong note, jumping 1.6% on
Thursday to close at 10,545.27. The index moved higher throughout
the day, and closed at its day’s high, which suggests that it has
strength to move further up. The index may face resistance at the
10,580 level, and then at the 10,600 level. On the downside, the
index has support at 10,445. The RSI and the MACD are also
trending higher, supporting our bullish view.
The QERI Index surged 2.29% on Thursday to close at 3,105.66. The
index formed a bullish Marubozu candlestick pattern, which is a
bullish sign. The RSI has recovered and moved higher after
Thursday’s upmove, while the MACD has converged with the signal
line. On the upside, the index will face resistance at 3,123.0. On the
downside, the support will be provided by the 21-day moving average
(3,065.73), below which the next support is at 3,036.0.
QIIK jumped sharply on Thursday, as the stock cleared the resistance
level of QR62.00, to close at a new high of QR62.20. In addition, the
stock formed a bullish Marubozu candlestick pattern. The MACD has
also given a bullish crossover, which is another positive signal for the
stock. However, investors should exercise caution if the stock falls
below the 62.00 level, which is now the first support. The next support
is the QR61.20 level.
Industries Qatar: Short-Term – Upswing
Doha Bank: Short-Term – Breakout
Ooredoo: Short-Term – Downmove
The IQCD stock surged on Thursday, moving above its resistance
level of QR171. The gain was supported by good volumes, which is a
positive sign. The MACD has given a positive crossover, while the
RSI is also trending higher. The stock is likely to move higher and
face resistance at the QR173.70 level. The second resistance is at
QR176.00. On the flip side, a move below QR171 would indicate
weakness.
DHBK finally moved above its resistance level of QR58.20 after
testing it on a number of occasions over the last two weeks, and
closed at QR58.80. The MACD has given a positive crossover while
the RSI is also trending higher, indicating that the stock may move
higher from the current levels. On the upside, the stock may face
resistance at the 59.00 level. On the flip side, investors should
exercise caution if DHBK moves below its support level of QR58.50.
ORDS moved below its 21-day moving average (currently at
QR136.70) to close at QR136.10. The RSI has been trending lower,
while the MACD has been diverging from the signal line on the
downside. Thus, both technical indicators support our bearish view on
the stock. A move below the QR136 level can take the stock to
QR135.00. On the upside, a move above the resistance level of
QR138.0 would indicate a trend reversal.
Page 1 of 2
2. Name (Ticker)
Last Close
Trend
Short Term
Support
Long Term
First
Resistance
Second
First
Second
Qatar Exchange Index (QE Index)
10,545.27
UP
UP
10,445.00
10,316.03
10,400.00
10,445.44
Al Rayan Islamic Index (QERI Index)
3,105.66
UP
UP
3,000.00
2,985.00
3,048.00
3,071.36
Masraf Al Rayan (MARK QD)
32.55
DOWN
DOWN
31.73
30.95
32.89
33.20
Commercial Bank of Qatar (CBQK QD)
70.90
UP
UP
70.50
70.00
71.00
71.50
Doha Bank (DHBK QD)*
58.80
UP
UP
58.50
58.20
59.00
59.55
Qatar Islamic Bank (QIBK QD)
69.80
DOWN
UP
69.50
69.00
70.10
70.30
Qatar International Islamic Bank (QIIK QD)*
62.20
UP
UP
62.00
61.20
62.50
63.00
Qatar Insurance (QATI QD)
67.50
FLAT
UP
66.50
65.90
68.00
68.50
National Leasing Holding Co. (NLCS QD)
30.10
DOWN
DOWN
30.00
29.55
30.60
31.00
Widam Food Co. (WDAM QD)
51.50
DOWN
UP
51.00
50.30
51.90
53.00
Al Meera Consumer Goods Co. (MERS)
133.80
DOWN
DOWN
133.40
132.00
133.90
134.50
Industries Qatar (IQCD QD)*
172.30
UP
UP
171.00
169.50
173.70
176.00
Qatar Electricity & Water Co. (QEWS QD)
179.50
UP
UP
177.20
175.00
180.00
182.50
Gulf International Services (GISS QD)
64.30
UP
UP
62.80
62.20
64.70
65.00
Qatari Investors Group (QIGD QD)
48.05
UP
UP
45.50
45.00
48.90
51.40
Barwa Real Estate Co. (BRES QD)
30.60
DOWN
UP
30.10
29.70
30.85
31.20
United Development Co. (UDCD QD)
23.15
DOWN
DOWN
22.85
22.50
23.35
23.50
Ooredoo (ORDS QD)*
136.10
DOWN
DOWN
136.00
135.00
138.00
139.00
Vodafone Qatar (VFQS QD)
11.02
DOWN
UP
11.00
10.70
11.10
11.19
Nakilat (QGTS QD)
20.50
DOWN
UP
20.35
20.00
20.60
20.75
Milaha (QNNS QD)
84.60
DOWN
DOWN
84.10
83.00
85.20
86.00
Banks and Financial Services
Banks and
Consumer Goods and Services
Consumer G
Industrials
Industrials
Real Estate
Real Estate
Telecom
Telecom
Transportation
Transportat
*These stocks are today’s suggested ideas
Overall Methodology: The charts and descriptions on Page 1 provide an indicative view of the future direction of the equities mentioned. The table on page 2 has been provided to denote historical movements in certain stocks. The historical trend analysis uses 21- and 55day SMAs for indicating short-term and long-term trends, respectively. Based on these SMAs, the historical direction of the trend is denoted as UP, DOWN or FLAT.
Selection of Key Stocks of the Day: Key stocks’ selection is based on our analysis of 19 members of the QE Index (excludes QNBK QD). Analysis includes identifying trends (short-term as well as long-term), patterns and support/resistance levels.
Trend Direction: The methods used to determine trend direction are subjective in nature. We use 21-day SMA and 55-day SMA, absolute price movements, price movements relative to SMAs and accurately drawn trend lines and chart patterns to determine the short- and
long-term trends.
Investment Horizon: The definition of short term and long term depends upon investors’ preferences and their investment objectives. As a rule of thumb, the time horizon for traders/short-term trend is 1-3 weeks while it is 1-3 months for investors/long-term trend.
Combining Technical and Fundamental Analysis: Investors can combine technical analysis (TA) with fundamental analysis (FA) to maximize their investment returns. While the “True Value” of stocks could be estimated by FA, the entry and exit timings could be fine
tuned using technical analysis to benefit from short-term movements in stock prices.
Trading Tactics: The trend direction should be analyzed based on the time-horizon of your investments. In general, investors attempt selling close to resistance levels during a downtrend and attempt buying close to support levels during uptrend.
Definitions:
1>
Simple Moving Average (SMA): A SMA is the average of the closing price of a security for a given period.
2>
RSI (Relative Strength Index): A technical momentum indicator that ranges from 0 to 100 and compares the stock’s recent price movements by evaluating recent gains and losses. Stocks with RSI above 70 could be considered overbought and below 30 could be
considered oversold. If the RSI falls below 70, it is a bearish signal. On the other hand, if the RSI rises above 30 it is considered bullish. We use a RSI of 14 days.
3>
MACD (Moving Average Convergence Divergence): MACD denotes the relationship between two moving averages, which is used to spot changes in strength, direction, momentum and duration of a stock price trend. The MACD is calculated by subtracting the 26-day
exponential moving average (EMA) from the 12-day EMA. A nine-day EMA of the MACD, called the signal line, is also plotted on top of the MACD, functioning as a trigger for buy/sell signals. The MACD line above the signal line provides a positive signal and vice versa.
Contacts
Saugata Sarkar
Ahmed M. Shehada
Keith Whitney
Sahbi Kasraoui
QNB Financial Services SPC
Head of Research
Tel: (+974) 4476 6534
saugata.sarkar@qnbfs.com.qa
Head of Trading
Tel: (+974) 4476 6535
ahmed.shehada@qnbfs.com.qa
Head of Sales
Tel: (+974) 4476 6533
keith.whitney@qnbfs.com.qa
Manager - HNWI
Tel: (+974) 4476 6544
sahbi.alkasraoui@qnbfs.com.qa
Contact Center: (+974) 4476 6666
PO Box 24025
Doha, Qatar
DISCLAIMER: This publication has been prepared by QNB Financial Services SPC (“QNBFS”) a wholly-owned subsidiary of Qatar National Bank (“QNB”). QNBFS is regulated by the Qatar Financial Markets Authority and the Qatar Exchange; QNB is
regulated by the Qatar Central Bank. This publication expresses the views and opinions of QNBFS at a given time only. It is not an offer, promotion or recommendation to buy or sell securities or other investments, nor is it intended to constitute legal,
tax, accounting, or financial advice. We therefore strongly advise potential investors to seek independent professional advice before making any investment decision. Although the information in this report has been obtained from sources that QNBFS
believes to be reliable, we have not independently verified such information and it may not be accurate or complete. While this publication has been prepared with the utmost degree of care by our analysts, QNBFS does not make any representations or
warranties as to the accuracy and completeness of the information it may contain, and declines any liability in that respect. QNBFS reserves the right to amend the views and opinions expressed in this publication at any time. It may also express
viewpoints or make investment decisions that differ significantly from, or even contradict, the views and opinions included in this report.
COPYRIGHT: No part of this document may be reproduced without the explicit written permission of QNBFS.
Page 2 of 2