SlideShare a Scribd company logo
1 of 1
Business Objective : Classify the likelihood of
customers being default or current after taking loan
Data:
Data Cleaning:
• Feature reduction based on 60% & above missing data
• Missing value treatment using MICE(PMM, poly reg)
• Outlier treatment
Evaluation:
Process Flow:
Model Development:
Classification Metrics (Test Dataset):
# Row 42,535
# Column 111
# Default (1) 5660 (13%)
# Current (0) 36875 (87%)
Loans issued: 2007-2011
Business
Need
Data
Cleaning
Data Prep.
(ABT)
Modeling
Evaluation
MICE
Feature
Selection
SMOTEClassification
Tree
Boosting
algorithm
Probabilistic
method
Descriptive Analytics:
Univariate Analysis
Binning
and
Standardiz
ation
Imputation
using MICE
and Outlier
correction
Data
import
and
merging
Data Preparation:
Feature
Selection
• Variance Inflation
factor (VIF)
• Chi-Sq Tests
• Weight of
Evidence (WOE)
Feature
Transformation
• One hot
encoding
• Label Encoder
Range
Normaliz
ation
Analytical
Base
Table
(ABT)
Outlier
Treatment
Synthetic Minority Over-Sampling Technique ROC performance (Multiple models - Test Dataset)
Boosting and simple classifiers are used to train and
performances were compared on validation data
Stochastic Gradient Boosting – Tuning Parms:
• n_estimators = 100
• Learning_rate=0.2
• Subsample = 0.8
• max_depth= 10
• Min_samples_split=30
• warm_start=True
• Execution time = 7.1 mins
Parameter Relative Importance (%)
SMOTE Output: Balanced Classification (50:50)
Categorical: WOE, IV, Chi-Sq test
Numerical: VIF (Multi-collinearity)
Applicants’ Credit Risk Scoring – Jigar, Preethi
0.4%
0.5%
1.5%
1.7%
1.8%
2.0%
2.2%
2.2%
2.3%
2.7%
3.1%
4.0%
4.6%
5.2%
6.3%
6.5%
6.8%
7.1%
7.4%
10.3%
21.3%
delinq_2yrs
out_prncpal_amt
loan_grade
home_ownership
Purpose_loan
inquiries_last_6mths
employment_leng
Region_home
term_loan
verification_status
open_credit_lines
credit_window_time
total_crdt_lines_used
applied_issued_dif_amt
annual_inc
int_rate
revol_bal
Debt-to-Income Ratio
revol_util
mon_installment
last_pymnt_amnt
Misclassification
Rate
Precision (for '1') Recall (for "1") AUC Score
10%
0.61
0.57
0.92
16%
0.41
0.49
0.85
12%
0.56
0.36
0.84
25%
0.30
0.65
0.82
Gradient Boosting ADA Boosting
Random Forest Logistic Regression
Tools : R, Python
1.42
1.44
1.46
1.48
1.5
1.52
1.54
1.56
1.58
1.6
1.62
0
0.2
0.4
0.6
0.8
1
1.2
1
29
57
85
113
141
169
197
225
253
281
309
337
365
393
421
449
477
505
533
561
589
617
645
673
Error
N_estimators = 700
Deviance Plot
Training Data Error Test Data Error
Lowest Test Error
Train - Test Error Gap
Precision (for 1) 0.59
Recall (for 1) 0.56
Validation data Results:

More Related Content

Similar to Christiewall_DataMiners

Presentation Title
Presentation TitlePresentation Title
Presentation Title
butest
 
Automated Change Impact Analysis between SysML Models of Requirements and Design
Automated Change Impact Analysis between SysML Models of Requirements and DesignAutomated Change Impact Analysis between SysML Models of Requirements and Design
Automated Change Impact Analysis between SysML Models of Requirements and Design
Lionel Briand
 

Similar to Christiewall_DataMiners (20)

Six sigma training
Six sigma trainingSix sigma training
Six sigma training
 
Six sigma training
Six sigma trainingSix sigma training
Six sigma training
 
ES2022-Minh-Nguyen-ShapingTestsIntoModelsForAutomatedTCGeneration.pdf
ES2022-Minh-Nguyen-ShapingTestsIntoModelsForAutomatedTCGeneration.pdfES2022-Minh-Nguyen-ShapingTestsIntoModelsForAutomatedTCGeneration.pdf
ES2022-Minh-Nguyen-ShapingTestsIntoModelsForAutomatedTCGeneration.pdf
 
Experimenting with Data!
Experimenting with Data!Experimenting with Data!
Experimenting with Data!
 
Six_Sigma.pptx
Six_Sigma.pptxSix_Sigma.pptx
Six_Sigma.pptx
 
DataScience-101
DataScience-101DataScience-101
DataScience-101
 
Digitalization in electronics manufacturing
Digitalization in electronics manufacturingDigitalization in electronics manufacturing
Digitalization in electronics manufacturing
 
ML Application Life Cycle
ML Application Life CycleML Application Life Cycle
ML Application Life Cycle
 
Dadm (lys)
Dadm (lys)Dadm (lys)
Dadm (lys)
 
Erdi güngör bbs
Erdi güngör bbsErdi güngör bbs
Erdi güngör bbs
 
Big Data Testing : Automate theTesting of Hadoop, NoSQL & DWH without Writing...
Big Data Testing : Automate theTesting of Hadoop, NoSQL & DWH without Writing...Big Data Testing : Automate theTesting of Hadoop, NoSQL & DWH without Writing...
Big Data Testing : Automate theTesting of Hadoop, NoSQL & DWH without Writing...
 
Presentation Title
Presentation TitlePresentation Title
Presentation Title
 
Comparative Study of Machine Learning Algorithms for Sentiment Analysis with ...
Comparative Study of Machine Learning Algorithms for Sentiment Analysis with ...Comparative Study of Machine Learning Algorithms for Sentiment Analysis with ...
Comparative Study of Machine Learning Algorithms for Sentiment Analysis with ...
 
Automated Change Impact Analysis between SysML Models of Requirements and Design
Automated Change Impact Analysis between SysML Models of Requirements and DesignAutomated Change Impact Analysis between SysML Models of Requirements and Design
Automated Change Impact Analysis between SysML Models of Requirements and Design
 
Drifting Away: Testing ML Models in Production
Drifting Away: Testing ML Models in ProductionDrifting Away: Testing ML Models in Production
Drifting Away: Testing ML Models in Production
 
INTERNSHIP
INTERNSHIPINTERNSHIP
INTERNSHIP
 
Machine Maintenance Management Predictive Analytics Use Case - Smarten
Machine Maintenance Management Predictive Analytics Use Case - SmartenMachine Maintenance Management Predictive Analytics Use Case - Smarten
Machine Maintenance Management Predictive Analytics Use Case - Smarten
 
Six Sigma
Six SigmaSix Sigma
Six Sigma
 
20220914-MBT-Experiences-SB1-final.pptx
20220914-MBT-Experiences-SB1-final.pptx20220914-MBT-Experiences-SB1-final.pptx
20220914-MBT-Experiences-SB1-final.pptx
 
Ops A La Carte SPC Seminar
Ops A La Carte SPC SeminarOps A La Carte SPC Seminar
Ops A La Carte SPC Seminar
 

Christiewall_DataMiners

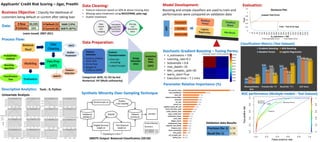
  • 1. Business Objective : Classify the likelihood of customers being default or current after taking loan Data: Data Cleaning: • Feature reduction based on 60% & above missing data • Missing value treatment using MICE(PMM, poly reg) • Outlier treatment Evaluation: Process Flow: Model Development: Classification Metrics (Test Dataset): # Row 42,535 # Column 111 # Default (1) 5660 (13%) # Current (0) 36875 (87%) Loans issued: 2007-2011 Business Need Data Cleaning Data Prep. (ABT) Modeling Evaluation MICE Feature Selection SMOTEClassification Tree Boosting algorithm Probabilistic method Descriptive Analytics: Univariate Analysis Binning and Standardiz ation Imputation using MICE and Outlier correction Data import and merging Data Preparation: Feature Selection • Variance Inflation factor (VIF) • Chi-Sq Tests • Weight of Evidence (WOE) Feature Transformation • One hot encoding • Label Encoder Range Normaliz ation Analytical Base Table (ABT) Outlier Treatment Synthetic Minority Over-Sampling Technique ROC performance (Multiple models - Test Dataset) Boosting and simple classifiers are used to train and performances were compared on validation data Stochastic Gradient Boosting – Tuning Parms: • n_estimators = 100 • Learning_rate=0.2 • Subsample = 0.8 • max_depth= 10 • Min_samples_split=30 • warm_start=True • Execution time = 7.1 mins Parameter Relative Importance (%) SMOTE Output: Balanced Classification (50:50) Categorical: WOE, IV, Chi-Sq test Numerical: VIF (Multi-collinearity) Applicants’ Credit Risk Scoring – Jigar, Preethi 0.4% 0.5% 1.5% 1.7% 1.8% 2.0% 2.2% 2.2% 2.3% 2.7% 3.1% 4.0% 4.6% 5.2% 6.3% 6.5% 6.8% 7.1% 7.4% 10.3% 21.3% delinq_2yrs out_prncpal_amt loan_grade home_ownership Purpose_loan inquiries_last_6mths employment_leng Region_home term_loan verification_status open_credit_lines credit_window_time total_crdt_lines_used applied_issued_dif_amt annual_inc int_rate revol_bal Debt-to-Income Ratio revol_util mon_installment last_pymnt_amnt Misclassification Rate Precision (for '1') Recall (for "1") AUC Score 10% 0.61 0.57 0.92 16% 0.41 0.49 0.85 12% 0.56 0.36 0.84 25% 0.30 0.65 0.82 Gradient Boosting ADA Boosting Random Forest Logistic Regression Tools : R, Python 1.42 1.44 1.46 1.48 1.5 1.52 1.54 1.56 1.58 1.6 1.62 0 0.2 0.4 0.6 0.8 1 1.2 1 29 57 85 113 141 169 197 225 253 281 309 337 365 393 421 449 477 505 533 561 589 617 645 673 Error N_estimators = 700 Deviance Plot Training Data Error Test Data Error Lowest Test Error Train - Test Error Gap Precision (for 1) 0.59 Recall (for 1) 0.56 Validation data Results: