This document summarizes patterns observed in water chemistry and solids distribution in major Arizona streams. Two main patterns are identified: 1) A 5-7 year sine curve in major ion concentrations beginning in the mid-1960s, likely related to releases from Glen Canyon Dam. 2) A tighter, seasonal curve seen in parameters like sulfate, with high points in summer and low points in winter. Mixing of waters with different chemistries, like between the Colorado and Gila Rivers, can cause correlated changes in metal concentrations over time as the system adjusts.
Analyzing Aggregates by Sedimentation Velocity and Light Scattering
Patterns in Gila and Colorado River Water Chemistry and Solids Distributions
1. Patternsin Gilaand ColoradoRiverWaterChemistry andSolidsDistribution*
The purpose of thisprojectis to enumerate anddescribe patternsinwaterchemistry andsolids
distribution of majorArizonastreams. Itisthe contentionof thispaperthat solids,particularly the major
ions, forma contextwithinwhichwaterqualityexceedancesoccur. Each ‘matrix’hasa differentsetof
electronic,solidspartitioning, pH,andalkalinityrelationswhichaffecttrace metal andnutrient
speciationandsolubility.
While some attempthasbeenmade totie togethersimilarphenomenon andsuggestpossible causes
and effects,manyobservations remain‘loose ends.’Theircause andfull significance are notknown so
‘explaining’themispremature andsummarizing leadstolossof information. The hope is these may
prove useful atsome pointinthe future toan investigatorwhomayfindine tobe justthe ‘key’needed
to create a betterpicture of howthese systemswork.
FINDINGS
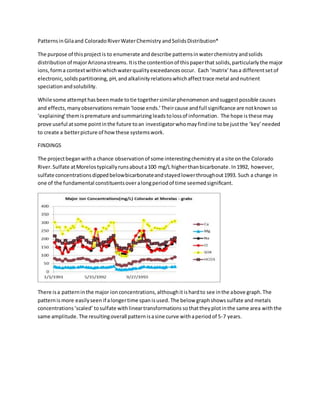
The projectbeganwitha chance observationof some interestingchemistryata site onthe Colorado
River. Sulfate atMorelos typicallyrunsabouta100 mg/L higherthanbicarbonate.In1992, however,
sulfate concentrationsdippedbelowbicarbonateandstayedlowerthroughout1993. Such a change in
one of the fundamental constituentsoveralongperiodof time seemedsignificant.
There isa patterninthe major ionconcentrations,althoughitishardto see inthe above graph.The
patternis more easilyseen if alongertime span isused.The below graphshowssulfate and metals
concentrations‘scaled’ tosulfate withlineartransformations sothatthey plotinthe same area withthe
same amplitude.The resultingoverall patternisasine curve withaperiodof 5-7 years.
2. This patternisfirstseeninthe majorionsat LeesFerry,at the opposite endof the state,inthe mid-
1960s. It contrasts clearly withanearlierperiodinwhichmajorionconcentrationswere muchmore
variable. Itisprobablysignificantthat GlenCanyonDam wentintooperationinthe mid-1960s.Infact,
GlenCanyondam releases are identical withflow atthe gage before 1996-97 anddifferonlyslightly
after.So we can surmise thatthe 5-7 sine curve isprobably relatedtodamreleases.
The relationshipbetweenflowandconcentrationisseeninthe graphbelow but itisnot a strongone.
The weaknessof the correlation isapparentinthe secondgraphbelow and furtherevidencedin
numerical correlation of only R^2
=-0.56 overthe periodof record.
Correlations - elevated flows from Gila
0
100
200
300
400
500
600
700
8/28/76 5/25/79 2/18/82 11/14/84 8/11/87 5/7/90 1/31/93 10/28/95 7/24/98 4/19/01 1/14/04
date
units
SULFATE, TOTAL (MG/L AS SO4)
CALCIU x 4.48 + -99.12
MAGNES x 12.49 + -86.67
SODIUM x 1.96 + 8.37
POTASS x 75.57 + -86.88
BORON, x 1182.90 + 63.40
ARSENI x 41684.85 + 185.38
MANGAN x 4930.23 + 233.11
COPPER x 44421.93 + 218.25
BARIUM x 4337.11 + -98.62
3. .
Part of the reason couldbe that all dam releasesmaynotbe the same. It wouldprobablymake a
difference if releaseswere made ‘off the top,’which wouldhave apresumably‘decanting’effect,or
withmixingwhich,assumingsome stratificationinLake Powell,mightstirup higher,bottom
concentrations. A more in-depthlookatGlenCanyonDam operationsthanwhatisgenerallyavailableto
the publicwouldprobablyclearupa lotof the uncertaintyhere.
A closerlookat sulfate concentrations,however, mayreveal anotherreason why the correlationwith
flowisso poor.The sulfate curve shows a tighter,innercurve withinthe larger5-7 yearcurve.The ups
and downsof thisinnercurve interfere withthe correlationbetweenflow andthe largersine curve.The
innercurve has highpointstypicallyinJun-Augandlow pointsin Oct-Jansowe can guessitto be a
seasonal effectstill goingonwithinthe contextof regulatedflow.
4. The seasonalityhypothesis canbe investigatedfurtherwithautocorrelations.The followingtwographs
showchloride concentrations atLeesFerry from1926 to 1965 and from1966 to 2008. Bothshow,to
some extent,the ‘dampedoscillator’patterntypical of seasonal effects.Presumablythe 5-7sine curve is
causingthe undulationandtighteramplitudesinthe 1966 to 2008 plot.
1926-1965
Autocorrelation - CHLORIDE,TOTAL IN WATER MG/L
-0.4
-0.2
0
0.2
0.4
0.6
0.8
1
0 100 200 300 400 500 600
lag
coefficient
5. 1966-2008
It mightseemobviousthatflowsinthe earlierperiodwouldbe more heavilyinfluencedbyseasonality
than inthe laterperiod. But there were ‘technical’difficultiesinattemptingtoshow thiswith
autocorrelations.The earlierperiodshowssome evidence of seasonality inflow withaplotthatlooks
verymuch like the ’26 to ‘65 chloride above.The laterperiodshowsaless convincingpatternbutthere
was a shiftfromusingmeandailytoinstantaneousflows,soall betsare off.
In fact, flowsand sulfate concentrationsinthe earlierperiod seemtosuggestthatthere maybe
seasonal effectsnotrelatedto‘seasonal flows.’Inthe graphsbelow highflows usuallycorrespondto
dropsin sulfate but notalways. Some dropsmay be the resultof changingsolubilityorspeciation with
temperature anddensitywithinthe base flow.Whateverthe cause,sulfate concentrationsatLeesFerry
routinelydroppedbelowbicarbonate inthe springorearlysummerfrom1948 to 1958. For several
yearsafterthere isspottydata so it ishard to tell butafterthe mid-1960s these dropsno longeroccur.
In general,Coloradomajorionchemistryshowstwobasicpatterns–one,a5-7 sine curve beginningin
the mid-1960s and possibly relatedtodamreleasesand two, a tighter,innercurve whichappearstobe
Autocorrelation - CHLORIDE,TOTAL IN WATER MG/L
-0.6
-0.4
-0.2
0
0.2
0.4
0.6
0.8
1
0 100 200 300 400 500 600
lag
coefficient
6. seasonal butnotstrictlytiedto seasonal flow. Metalsconcentrations loosely follow the majorion
concentrations 5-7year sine curve.
These patternsare seen at Morelasbutthe onsetof the 5-7 curve is eithermutedornot fully visible
(earliestdata,1961) and therefore lessdistinct.The inner,seasonal curve atMorelashas highsin Oct-
Jan andlowsin Mar-Aug,opposite toLeesFerryandthere are more anomalies.Some dropsinsulfate
are outside the normal amplitudesof eitherthe 5-7year sine orthe innerseasonal curve.
Returningtothe metals concentrationsatMorelas,one seesthatthey alsorespondduringthe same
periodasthe sulfate dip. The graphbelow isthe same as the metalsgraph above (p.2) withall
parameters scaledtosulfate, butovera shortertime span andwithparameters removed thatdonot
have at leasttwopointswithinthe time of interest(92-94).
7. Obviouslythesegraphshave ‘waytoomanypoints’andit ishard to see the forestforthe trees,as the
sayinggoes. But there seemtobe nodes (3) duringwhichtime all the metals are all movingeitherupor
downand the center(nochange in concentration) clearsout. Inotherwords,all the parameterswith
data inthe time of interestseemtobe affectedinone wayoranother. Thisapparent, ‘multi-variate’
correlation naturally raisesthe questionof whatmightbe the cause.
The period1992-1993 was a time whenmajorflowsonthe Gilacausedit to flow all the way from
Saffordto Dome andthe Colorado.The maincharge carrierson the Gila are sodiumandchloride
whereas onthe Coloradosodiumand sulfate. Whatwe seemtobe seeingare the metalsadjustingfrom
theirpositioninthe Coloradomatrix tothatin the Gilaand thenslowlyreturningasGilaflow tapersoff.
The ‘matrix’here isa theoretical constructthatpositsthatthe majorionsforman environmentora
‘structure’forall the otherconstituents.Thishypothesisis notbasedonanyfirstprinciple,itissimplya
‘hunch’,probablyinspiredbythe hierarchyof redox reactions, usedtogenerate anapproach.
A searchwas made for similarpatternsof mixingatother‘transition’zonesbetweendifferentmatrices
aroundthe state.Veryfewexampleswere found.While somemixingoccurseverytime atributary
entersa stream,flow,concentration,andtime span probably needtobe justrightto actuallysee a
concentrationresponse.(Most‘grab’samplesare takenamonth apart – for that reasonconsiderable
mixingneedstogoon foralmost6 months,ashere,to be visible)
Mixinganalysisprogramsare,of course,available but the focushere waslessonverifyingthe above
hypothesisthaninsimplycharacterizingthe twosystems involved. The Gila,like the rest of the southor
westflowingstreams inArizonaexamined(Colorado,Gila,Salt,Verde) gainsinsulfateasitprogresses.
(Northflowingstreams(SantaCruz,SanPedro andLittle Colorado) gaininchloride.)
Correlations - elevated flows from Gila
0
100
200
300
400
500
600
700
9/19/91 4/6/92 10/23/92 5/11/93 11/27/93 6/15/94 1/1/95 7/20/95
date
units
SULFATE, TOTAL (MG/L AS SO4)
CALCIU x 4.48 + -99.12
MAGNES x 12.49 + -86.67
SODIUM x 1.96 + 8.37
POTASS x 75.57 + -86.88
BORON, x 1182.90 + 63.40
ARSENI x 41684.85 + 185.38
MANGAN x 4930.23 + 233.11
COPPER x 44421.93 + 218.25
BARIUM x 4337.11 + -98.62
12/92 to 12/933-6/92
12/94-8/95
8. More significantly,relationshipsbetweenthe majorionschange withelevationasthe Gila proceeds.
The Gila doesnotusuallyhave surface flow betweenGillespie andDome,butthe chemistryatDome is
much closertothat of Gillespie thanitisto that of the Coloradoonlysome eighttofifteen milesaway.
The presumptionisthatthe Gilaexistsif notinactual undergroundflowsatleastinconnectedaquifers
betweenGillespieandDome.
At Safford the majorionconcentrations(activities) are highlycorrelatedwitheachotherwiththe
exceptionof bicarbonate. Inthe following ‘correlation matrix’thatcoversthe entire periodof record,
highcorrelation(R^2
>.90) is inlightmagentawhile some correlation(R^2
>.75<.89) isinlightblue.
Safford
concentration Ca Mg Na Cl SO4 HCO3
Ca 1 0.953973 0.881617 0.879023 0.833019 0.298355
Mg 0.953973 1 0.934212 0.930191 0.919909 0.163743
Na 0.881617 0.934212 1 0.996687 0.959978 0.215696
Cl 0.879023 0.930191 0.996687 1 0.95163 0.182205
SO4 0.833019 0.919909 0.959978 0.95163 1 0.164268
HCO3 0.298355 0.163743 0.215696 0.182205 0.164268 1
The highcorrelation isimmediatelyapparentin graphsof majorionconcentrations.
This‘dance of the ions’seemstobe relatedtoseasonal flow.The GilaatSafford usually hastwohigh
flowperiodsperyear,correspondingtothe so-calledwinterandsummermonsoonseasons. A typical
yearin termsof flowand concentrations(conductivity) isshownbelow aswell asmonthlyaveragesfor
flowandevaporation (Eref in1/10 mm H20, here multipliedby10).
9. The pattern of conductivityonthe lefthandgraph is apparentlythe resultof interplaybetween seasonal
floweventsandperiodsof highevapo(transpi)ration.The eventsmaybe termed ‘dilution’and
‘concentration.’ The followingtwographsshow typical dilution(left)andconcentrationpatterns(right)
interms of flowandconductivity.Inadilutionevent,flow goesupwhile conductivity(standinginfor
TDS/concentration) goesdown,andinaconcentrationeventflow goesdownwhileconductivitygoes
up.
Notall flow/concentrationeventscanbe labelleddilutionorconcentration.Instancesof flow and
conductivitybothrisingare dubbed‘influx’whilebothdroppingare called ‘outflux.’ Of the 160 samples
at Safford, 79 were concentrationand61 were dilution(49and38% respectively). Only9were labelled
‘influx’and12 ‘outflux’(6& 8%).
‘Influx’couldbe aninflowof higherconcentrationwatersuchasmightoccur withan inflow of
groundwaterorag returns. ‘Outflux’mightbe aneventsimilartoinfiltration,waterpercolatingthrough
soil andlosingsome of itssolidscontent. ‘Outflux’ishard tovisualizeas a physical phenomenon and
may insome casesactuallybe an error indesignation.
As a simple check, conductivitymaybe comparedtoTDS and ADEQ flows(grabs) toUSGS flows(means).
If the twodo not agree indirection,thenthe designation maybe erroneousdue toa badconductivityor
flowread. Or the flowand/orconductivityreads,typicallyamonth apart,may be correct but justnot
representative of the periodasawhole. Ingeneral,the simple dilution/concentrationmodel seems
10. appropriate about90-95% of the time at Safford.Of the influx andoutflux designationsmost atSafford
were foundtobe problematic,so ratherthan 14%, 5-10% isa betterestimate of possible actual ‘influx’
or ‘outflux’eventsthere.
The concentration response atSafford todilutionandconcentrationevents inthe same time framesas
the graphs immediately aboveisclearinthe pattern of the major ions.
All the majorion concentrations,withthe possible exceptionof bicarbonate,godownin a dilutionevent
and up ina concentrationevent(period).The dropinsodiumandchloride isproportionallygreaterthan
that of calcium(or bicarbonate whenitdrops). The resultisthatcharge%, a functionof concentration
but as a percentsensitive to relativechange, goesdown forsodiumandchloride andupforcalciumand
bicarbonate.
The major charge carriers,therefore,canchange fromsodiumandchloride tocalciumand bicarbonate.
Thisis termeda‘matrix inversion’andisclearlyseeninthe graph of charge on the left(dilution event-
same year as above dilutiongraph). The significance of the matrix inversionisnot knownbutone
suspectsitmightprovide anenvironmentthatfacilitateschangesinspeciationandsolubilityfrom than
those seenduringbase flowconditions.
(Varioustypesof charge %calculationscanbe used.Charge%,asusedinthe USGS programs,divides
molesof plusor minus speciesbythe total plusorminusmoles,molese (molesof electrons) multiplies
molesby charge,ionicitymultiplies moles bycharge squared. Charge% emphasizesthe effectof relative
concentrations,molese,whichisusedhere,isclosesttothe contributiontoconductivity,whileionicity
emphasizesthe charge.Graphsof all three show onlyslight,expectedvariations–whichisused
dependsonfocusandinterest.)
11. Several more graphsshow variationsin the depictionof how charge respondstodilutionevents. The
flow/conductivitycontextisonthe left,the change incharge relationstothe right.
Charge response dependsonthe extentof flow/concentrationdroporrise and the numberof data
pointsoverwhichthe eventisspread.Single pointeventsappearsharplydefinedwhile multiplepoint
eventsare flattenedoutregardlessof relative drop/rise magnitudes.
The dynamicbetweensodium-chloride andcalcium-bicarbonate charge isstrikinglyrevealedinthe
followingmatrix.Sodiumandchloride are stronglycorrelatedtoeachotherand negativelycorrelatedto
calciumand bicarbonate.
Safford
molse Ca Mg Na Cl SO4 HCO3
Ca 1 0.869854 -0.93593 -0.8688 0.241483 0.852654
Mg 0.869854 1 -0.89957 -0.83721 0.437799 0.813541
Na -0.93593 -0.89957 1 0.930656 -0.29567 -0.90326
Cl -0.8688 -0.83721 0.930656 1 -0.35323 -0.97398
SO4 0.241483 0.437799 -0.29567 -0.35323 1 0.283348
HCO3 0.852654 0.813541 -0.90326 -0.97398 0.283348 1
The hypothesis hereisthatprecipitationbringsdilute water,definitelylowerinsodiumandchloride
(associatedmore withthe base flow),andvariable inbicarbonate. Hemsandotherothershave
12. suggestedthathigherbicarbonate contentinsurface runoff isdue to increasedcontactwithair(CO2)
and vegetation. While bicarbonatecontentmayormay notbe higher,calciumandbicarbonate changes
inconcentrationare invariablyrelativelylowerthanthose of sodiumandchloride.
The mixingof differentwatersinthe course of flowingfromhighertolowerelevations withthe
accompanyingshiftfrompotential tokineticenergy hasapparently createdapatternwhichmaybe
viewedasa ‘structure’intermsof entropy.Sothe questionsbecomes,inwhatwaysisthis‘structure’
maintained.
Note that inthe area of charge,sulfate isnotcorrelatedwiththe otherions,asinconcentration,
bicarbonate isnot. The ionnot correlatedmaybe suspected tobe the one that ‘tipsthe balance’and
determineswhatis‘goingon.’ Tosee how sulfate maybe involvedinthe responsetodilution/
concentrationeventsrequiresadigressiononsulfate chemistry.
Sulfate, like bicarbonate butunlike chloride, hasatendencytoform ionpairswithcationssuchas
calcium,magnesiumandsodium.Formationof sulfate ionpairscanbe seenonspeciationgraphssuch
as that for BoulderCreek.The graphtothe leftshowsthat ’SO4as (free) SO4’,‘CaasCa’, and ‘Mg as Mg’
percentswentdownsteadilyforabout6 months. The graphto the rightplotsconcentrationsof CaSO4,
MgSO4 andNaSO4 concentrationsona reverse x-axisof SO4/SO4speciation.Inotherwords,asCaSO4,
MgSO4, and NaSO4 concentrationsgo up,SO4/SO4 speciationgoesdown(reversingthe usual
independent/dependentvariable relation)
Growth isgenerallyexponential,though appearinglinearorlogarithmicattimes,andthe orderof
magnitudesisusually CaSO4, MgSO4,NaSO4. CaSO4 andMgSO4 are unchargedwhile NaSO4hasa
minus1 charge as opposedtoSO4 itself whichhasa charge of -2. Formationof ionpairstherefore
involves notonlycompetitionforCa,Mg and, to a lesserextent, Nabutalsoremoves theircharge %
fromthe system.
Thoughthe percentage of sulfate assulfate isdecreasing,sulfateconcentrationsactuallyhave tobe
risingbecause that’swhatispushingformationof the ionpairs.Ionpairformationisself-regulatingin
accord withthe law of mass action (sulfate inputinanopensystemwith steadystate approximation).
13. The above graph showssulfate concentrationinbluewith‘sulfate backcalc’(sulfateplussulfate ionpairs
as sulfate) inred.Sulfate ‘backcalc’isanalytical,‘total’sulfate. The divergenceof redand blue lines
showsthe accelerating growthof ionpairconcentrations. Ionpairformationcontinues aslongas
sulfate concentrationsare risingand,initself,servesasabreak forsulfate concentration.Thisistermed
a ‘deceleration.’ SimilardecelerationsoccurforCa and Mg but verylittle if atall forNa. HCO3 ionpairs
seemtofunctionsimilarlybutwithmore variabilityandatlowermagnitudesinmostwaters. The blue
square showswhere CaSO4precipitationisexpected.
(Thispart of the discussion isalittle tenuous. Iam usingthe law of mass actionto describe the relation
betweenreactantsand‘ionpairs’withoutknowingwhetherthere isalso equilibriumbetweenionpairs
and products(CaSO4etc precipitates).InfactI am treatingionpairsas if theywere precipitateswhich,
of course,theyare not. Such argumentscan be,accordingto Hems,“misleading”buthe doesnotgo
intoany more detail.)
ReturningtoSaffordwe can see that,in the original Gilamatrix,sulfateandbicarbonate ion pair
formationdrop indilutioneventsandgrow to a peakduringconcentrationevents. The graphsbelow
(same yearsas earliergraphs (topof p. 10)) show % molese with ionpairconcentrationsinmg/L(SO4IP
= SO4 IonPairs = SO4 backcalc mg/L– SO4 as SO4 mg/L)
14. The suppositionhere isthatthe ionpairformationcompetingforcalciumandmagnesiumcombines
withdecreasing(dilute) surface runoff andre-increasingbase flowtoallow sodiumandchloride toonce
againbecome dominant.The endresultis mostclearlyseenbyplottingthe majorionconcentrations
and charge againstconductivity. Here the ‘mediatingeffect’of bicarbonate isclearlyseen,thatof sulfate
ismore indirect,throughionpairformation.
Thispicture isthe Gilamatrix at itsmost clearand the patternsnotedabove show the ‘self-regulating’
mechanismsinvolved. Thislevel of orderamongthe majorionsraisesthe question‘how fardowninthe
structure isorder apparent?’
Unfortunately,minorconstituentmetal andnutrientconcentrationsare nothighly correlatedwiththe
majorion patterns at Safford.There isnogeneral sine curve,asseenonthe Colorado,forthe metalsto
follow. Metal concentrationsare infactrelatedto eachother – that isthe whole pointof the USGS
programs.But highcorrelationstendtobe betweendifferentcompoundsof the same metal. The
furtherwe go downinthe electronic‘structure,’the lesscompleteourpicture is,the more the situation
isdeterminedbythe ‘local’environment. The ‘local’ environmentmaybe aproduct of everythingabove
it,but tyingthe causesand effectsbecomesincreasinglycomplex anddifficult.Whetherthere are any
correlationsorpatternswithmajorionsdependsonthe picture we canconstruct.
Comparingmetalsconcentrationswiththe dominantanioncharge % indifferentmatricesyieldssome
suggestive plots.Here HCO3and SO4 charge percent at a numberof differentsitesare plottedagainst
arsenicconcentrations. Higherarsenicconcentrationsseemtoclusterincertainportionsof the graphs.
15. If the appropriate charge%forthe Verde andColoradoare labelled,itisclearthatthe Verde isina high
concentrationclusterwhilethe Coloradoisnot. Doesthisindicate ahigher‘carryingcapacity’for
arsenicinthe Verde as opposedto Colorado?
Probablynot. It couldjustbe coincidental. The Verde ishigherinarsenicdue togeological formations
and there isno obviouscausal connectionwiththe matrix. A streamdoesnothave a choice inaccepting
or rejectingmaterialsinitspath,insteadithastoadjustto them. If there isanythingtothe ‘carrying
capacity’ideaitprobablyliesinspeciation. Thisargumentdoesnotdomuch forarsenic,which
invariablyexistsasAsO4. But itcouldsalvage the theorybypositingthatcertainspeciesmightmigrate
more readilyintothe suspendedsedimentportioninsome matrices. Itmightbe of interesttodesign3
dimensional PiperPlotswithmetalsconcentrationsasthe Z axis. Butit wouldbe a lotof workand
mightnot leadtoany significantfindings.
A majorproblemfindingpatternsandcorrelationswithminorconstituentmetalsisthattheyhave a
variable ‘presence.’ (Imaginethe charge % graphs above (topof p 10) witheverysecondorthirdpoint
missing) There isalarge element of chance inwhetherminormetalswillbe presentandinwhat
concentrations. Base-flow metalsconcentrationscanbe comparedtohighflow butthistellsusnothing
aboutrelations.
Returningtothe Gila matrix at Safford,however,one cansee thatmetalsdo seemto respondtomajor
ionpatterns ina verygeneral way.If all bicarbonate andsulfate species are plotted togetheron
separate chartsand theirmovementrelatedwithflow andconductivity,trace metal bicarbonate and
sulfate compoundsseemtolargely move inoppositedirectiontothose of majorions.
V V
16. The major ioncompounds at the top of the graph, thoughratherflattenedbythe logscale, dipdown at
the dilutionevent,while underneathmany trace metal –(H)CO3and -SO4compounds are trendingup,
thoughnot all inunison. Metal hydroxide compounds followthe upwardmotion of bicarbonatesand
sulfateswhilephosphates,whichare mostlymajorcationcompounds(exception, iron),seemtobe
variable inresponse.
There are a couple more interestingpointsaboutthe above graphs. The firstisthatthe large dilution
flowpeakandconductivitydropof 8/16 isaccompaniedbya droppingpH. The secondis thatthe
response of several trace metals occursona small side peak(7/19) to the mainpeak(an ‘upswing’side
peak). Eleven dilutioneventsshowedupsidepeaks.(Only22% of all eventsbut that isheavily
dependenton (chance) spacingof samples).Tenhadmatrix inversions,nineshowedsome metals
response,andfourshowedsignsof acorrelated metal response.
In caseswithresponse atthe side peak, adrop inpH anda switchof OH and CO3 specieswere usually
alsoobserved.Differentmetalsrespondatthe side peakorat the mainpeak (presumablybychance).
Free metal speciationandcharge percent (inblackbelow)oftengoupwitha dropin pH as expected.
The followinggraphsshowspeciation,concentration,andcharge% (lefttoright) forthe same time
periodasthe graphsabove.
17. These pictures suggestthat‘firstflush’maybe amore extendedphenomenonthancommonlythought.
Meteorologists dosometimessay thatthe earlymonsoonseasonmaypresentwithspottyprecipitation.
As isolatedtributariesbegintorun,if they chance to pickup higherconcentrationsof metalsalongthe
way,they‘hit’the mainstreamwiththe full force. Inotherwords,the contrast betweenincomingand
receivingwaterconcentrations islikelytobe greaterthanlaterinthe seasonwhenmore tributariesare
runningandconcentrationstendtocancel each otherout.
How differentthe Gilaisat Gillespie thanitisat Saffordcan be seenbycomparingthe concentration
and charge vs conductivityforGillespiewiththose forSafford above.
The plot upto about 1500 uS/cmis exactlythe same asSafford. Athigherconductivity,sulfate becomes
an increasingfactorwhile bicarbonatehaslessof a‘mediating’role thanithasat Safford.Infact, sulfate
increasesandbicarbonate decreases asthe Gilaprogressesasseeninthe PiperPlotsbelow (Saffordleft,
Gillespie right,bicarbonateaxis lowerrightside of diamondincreasinggoingdown,spring- yellow)
18. While the same dilution/concentrationresponsesevidentatSaffordare still,ingeneral, seenat
Gillespie,theyare lessfrequentand/orlessclear. The correlationof charge betweenNaandCl has
weakenedandthe oppositionwithcalciumandbicarbonate is alittle lessclear.
molese Ca Mg Na Cl SO4 HCO3
Ca 1 0.057617 -0.94184 -0.84481 -0.25469 0.854752
Mg 0.057617 1 -0.35518 0.017606 -0.07962 0.007393
Na -0.94184 -0.35518 1 0.794772 0.324235 -0.83363
Cl -0.84481 0.017606 0.794772 1 0.079984 -0.92585
SO4 -0.25469 -0.07962 0.324235 0.079984 1 -0.44067
HCO3 0.854752 0.007393 -0.83363 -0.92585 -0.44067 1
In itsplace there isan eventightercorrelationbetweenmajorionconcentrationsthanseenatSafford
with,again,bicarbonate beingthe exception.Itwouldbe interestingtoattempttoquantifywhatsucha
change meansinterms of entropydifferencesandwhatthe energyimplicationsare.
Concentration Ca Mg Na Cl SO4 HCO3
Ca 1 0.957677 0.970109 0.970231 0.963923 0.448994
Mg 0.957677 1 0.960178 0.960932 0.950435 0.408477
Na 0.970109 0.960178 1 0.990563 0.983885 0.395387
Cl 0.970231 0.960932 0.990563 1 0.972332 0.389997
SO4 0.963923 0.950435 0.983885 0.972332 1 0.348298
HCO3 0.448994 0.408477 0.395387 0.389997 0.348298 1
There appearsto be lesscontrastbetweenincomingandreceivingwatersatGillespie thanatSafford.
(HighTDS groundwaterorag returnsflowingintoagenerallyhigherTDSwaterrather thana dilute
meetingamore concentratedreceivingwater(particularlyinsodiumandchloride)).The lackof contrast
makesresponse hardertogauge.
One corollaryof this newsituation maybe that so called‘influx’ and‘outflux’situationsare more
commonat lowerelevations. Gillespiecertainlyhasagand municipal returnswhichmaybe of generally
highTDS waterand the Gila exists undergroundincertainspotswhichmight(somehow) make
inflltrationapossibility. While some‘influx’and‘outflux’designationsmaybe erroneous,asatSafford,
the ratiosof the differenttypesof eventschangesdramaticallyatGillespie andDome where influx and
outflux are 16 and19-20% for a combinedtotal of about35-36% of all events(asopposedto5-10% at
Safford).
Under similarcircumstancesasSafford,one ismore likelytosee ‘partial’than‘full’matrix inversions at
Gillespie. The majorionsmerelytake aslightmove toward or awayfrom eachother.These are not,
19. strictlyspeaking,matrix ‘inversions’buttheydo bearthe same relationtodilution/concentrationevents
and pointtoward the same mechanismasat Safford withthe same drop andrise in ionpairformation.
Note that bicarbonate isstill uncorrelatedforconcentrationandsulfate isstill uncorrelatedforcharge.It
may be that, as the dynamicbetweenNa/ClandCa/HCO3weakens,the rolesof bicarbonate andsulfate
ionpairs in maintainingthe highsodiumchloridematrix maychange butwhethermore orless
importantisnot clear.
Withmajor iondynamicslessclear,itisnot surprisingthatminorconstituent responseto
dilution/concentrationare mutedand/or confused. Evenwithfairlylarge dipsinconductivityandhigh
peaksinflow, one ismore likelytosee flatlinesora confusedjumble.
But while responsetodilution/concentrationeventsisless clearthere are a numberof new
relationshipsemergingatGillespie.pHchangesunaccompaniedby change in flow orconductivity,are
20. associatedwith concentrationchanges more often thanatSafford.There mayalsobe different
responsesinvolvingbicarbonate,iron,andsilicabutthese have notbeenfullyworkedout.
Some responsesseenatGillespie are particularlysuggestive. Incertainyears,the phosphatesoscillate
ina sine pattern. The regularityandtightnessof the responsesuggestssomesortof fine-tuningisgoing
on butno relationtoflow/concentrationorothermetal trendshave beenfound.(Anotherwaysucha
regularpatterncan be producediswith a steadyconcentration nearthe detectionlimit alternatingwith
‘lessthanthe detectionlimit’values (usingone half the detectionlimitisatypical wayof bridging
‘datagaps’inenvironmental monitoring) Inotherwords,apositedregulatingmechanismmayjustbe an
artifactof analysis!).
Thiskindof tightmovementisreminiscentof ironspeciationchanges exceptthatthe latteriseasily
explained. Everytime the pHapproachesorcrossesthe pH = 8 line there isashiftinspeciationfrom
Fe(OH)4to Fe(OH)2orvice versadependingonthe direction of change.Plottingironspeciationvs.pH
showswhy.
21. The significance of the ‘braidiing’patternseenin blue andgreenlines(Fe(OH)4andFe(OH)2) of the
above,rightgraph isnot known.One mightsuspect thatironhasa role infine-tuningcharge
relationships. Fe(OH)4isminuscharged,whileFe(OH)2ispluschargedandFe(OH)3isuncharged.
Whichspeciespredominate maynotbe directlyrelatedtothe magnitude of flow but tothe total charge
structure of the incomingflow.
Iron hasseveral strongcorrelationsthatare veryinterestingaswell. Atmostsitesexaminedthere isa
strongcorrelation betweenFe(OH)4speciationand H3SiO4concentration(>0.9).H3SiO4, witha minus
charge andoftenexistingatintermediateconcentrations,canbe a major charge carrier. Fe(OH)4-
speciation alsohasa pretty faircorrelation withHCO3speciation whichmaybe relevanttowhatone
seesat LeesFerry(below)
While the chemistryhasmanyunansweredquestions,the overall solids distributionpicture isfairly
clear.As the Gilaflowsfromeastto westitgainsin TDS . Many parametersshow asimilarstraightline
trendfromSaffordto Dome but some show the middle, Gillespie,asbeing‘unique.’ Gillespieseemsto
be a sinkforTDS, possiblydue to(ormerelyresultingin) higherdensity.Averagesformanyparameters
are higheratGillespie thaneitherSaffordorDome,though maximumvaluesare oftenhigheratDome
for some reason or possiblyjustcoincidentally.
On the otherhand,TSS drops steadilyasthe Gilaprogresses. Thatthe Gilamayonlyexistunderground
betweenGillespieandDome rathercomplicatesthe situation. Ingeneral,though, TSSisonlyan
importantfactorat Safford,unlesshigherflowscarryitalongdownto Gillespieand/orDome.
22. The changesseeninthe Gila as itprogresses canbe relatedto the Coloradoat LeesFerrybefore and
afterthe mid-1960s. The high contrast betweenincomingandbase flow,particularlyintermsof
bicarbonate concentrations,seen atSafford butnotat Gillespieiscomparable to higherbicarbonate
concentrationsinthe spring atLeesFerry before the mid-1960s.The Piperplotsbelow show LeesFerry
majorion chemistry,left:1926-1965, right:1966-2008, spring– green, bicarbonate axisisthe lower
rightside of the diamond,goingfrom0 (high) to100(low) downthe page).Thisisanother,evenmore
striking,view of the change in majorion variabilitybefore andafterthe mid-1960s.
In the earlierperiod,the matrix response to thisscenarioissimilartothatof the Gila, complete with
matrix inversion, inspite of the factthat the Coloradoisnot a particularly highsodiumchloridematrix.
Afterthe mid-1960s, however, the 5-7sine curve setsinand chemistry looksalotmore like the Gilaat
Gillespie thanthe Gilaat Safford. Whateverthe exactflow/concentrationrelationmaybe,the lessening
contrast betweeninflowingandreceivingwaters,seemstooperate similarlywhethercausedbychange
inelevationordamconstruction.Withregulatedflows,the chemistrybecomesverydull(!)
23. The existence of matrix inversionsonthe Coloradosimilartothose seenonthe Gilasuggeststhatsimilar
patternsmay have existed. Correlationsshow thatthere isdynamicbetweenNa/Cl andCa/HCO3at
LeesFerrybefore butnotafter the mid-1960s.
LEES FERRY
1947 1964
molse Ca Mg Na Cl SO4 HCO3
Ca 1 -0.40573 -0.94925 -0.89028 -0.64347 0.850363
Mg -0.40573 1 0.100641
0.18
9917 -0.04384 -0.04691
Na -0.94925 0.100641 1 0.905448 0.71796 -0.91212
Cl -0.89028 0.189917 0.905448 1 0.488477 -0.79756
SO4 -0.64347 -0.04384 0.71796 0.488477 1 -0.91546
HCO3 0.850363 -0.04691 -0.91212 -0.79756 -0.91546 1
1965 2006
molse Ca Mg Na Cl SO4 HCO3
Ca 1 -0.14401 -0.71956 -0.52467 -0.41035 0.589472
Mg -0.14401 1 -0.542 -0.37188 -0.28283 0.400297
Na -0.71956 -0.542 1 0.66897 0.613963 -0.80739
Cl -0.52467 -0.37188 0.66897 1 0.267296 -0.74255
SO4 -0.41035 -0.28283 0.613963 0.267296 1 -0.83879
HCO3 0.589472 0.400297 -0.80739 -0.74255 -0.83879 1
Metals otherthaniron were notanalyzedatLeesFerrybefore 1964, soit isnot possible to compare
before andafter..Iron,however, showsamarkedchange inspeciation atLeesFerry around1964 as
well.
24. The connectionbetweenbicarbonate andironhasbeenstudiedingroundwaterbut whetherthe same
connection existsinsurface waterandwhatitmightmeanare notknown.The correlationbetween
Fe(OH)4- speciationandHCO3/CO3speciation atLeesFerry is -.54 before 1964, butjumpsto -.94 after.
On the Gila,the correlationis -.5 at Saffordandmovesupto -.79 at Gillespie.
The same dynamicseenatLeesFerryare apparentat Morelasas well.
1961 1963
molse Ca Mg Na Cl SO4 HCO3
Ca 1 0.181372 -0.89389 -0.7665 0.708599 0.836269
Mg 0.181372 1 -0.60292 -0.19981 0.16666 0.263912
Na -0.89389 -0.60292 1 0.710665 -0.64784 -0.79814
Cl -0.7665 -0.19981 0.710665 1 -0.98879 -0.94914
SO4 0.708599 0.16666 -0.64784 -0.98879 1 0.891651
HCO3 0.836269 0.263912 -0.79814 -0.94914 0.891651 1
1964 2006
Mols e Ca Mg Na Cl SO4 HCO3
Ca 1 -0.41798 0.134442 -0.24957 0.586402 0.71817
Mg -0.41798 1 -0.95317 -0.59209 0.301907 0.176618
Na 0.134442 -0.95317 1 0.73992 -0.63879 -0.71494
Cl -0.24957 -0.59209 0.73992 1 -0.95912 -0.87269
SO4 0.586402 0.301907 -0.63879 -0.95912 1 0.699257
HCO3 0.71817 0.176618 -0.71494 -0 .87269 0.699257 1
What we have to thispointthenare twosystemswithbasicsimilarities(presentorpast) and some basic
differences.The Coloradohas general seasonalityandregulatedflowswhile the Gilahasaseasonality
heavilypunctuatedbyflow patternsandevaporationrates. The followinggraphsshow the flow,
conductivityandmassflux relationsandmajorionresponse atMorelos in1993 to increasedflow from
the Gila.
25. The massive dilutioneventwasnotaccompaniedbya verylarge drop inconductivityorTDS. There was
howeveralarge negative massflux (apointtopointconcentrationtimesvolume calculation usingpoints
a monthapparent– not reallyaverygoodidea).Asthe nextgraphsshow,there wasa sulfate
(concentration) dipbelowbicarbonate butnocharge inversion.
As mightbe expected,whilemajorion carbonate andsulfate compounds dodip,there isnotsvery
convincingcorrelatedupwardmovementamongtrace metal compounds..
Individual metalswere graphedandthe response foundtobe quite variablebothintermsof magnitude
and timingwithmanyshowingnoresponse atall. A few examples of individual metal concentration
responsesover1993:
26. Giventhese results,itishardto see howthe initial graph(p.7),made froma randomgroupof metals,
was evenproduced. Rerunningthe graphingprogramwiththe original concentrationdata(thatis,not
activitiesderivedfromthe USGSprograms) revealedthatmostof the parameterswere dissolved
species. Scalingthe datato sulfate withlineartransformationsstretchesthe amplitudeandpositions
the resultsinthe same general areaas sulfate.Thistechniquemakesrelationshipseasiertosee but
magnitudesmore difficulttogauge.Anothertechnique thatmaybe usedisto divide sulfatevaluesto
plotinthe same general areaas the metals.The followinggraphsshow the twotechniquesusedwith
sulfate andarseniconly. Onthe left,arsenicisscaledtosulfate,onthe right,sulfate valuesdividedand
arsenicmultipliedtoplotinthe same area.
Both techniquesshow the same,roughlyinverse,relationshipbetweensulfate andarsenic. The
correlationbetweenAsandSO4is -0.68 overthe main ‘node’shown (12/92-10/93), or -0.79 overthe
entire time spanof the graph (9/91 - 1/95) whichincludes3‘nodes’,butonly -0.46 overthe entire
periodof record. In thisstudycorrelationswere usuallyrunoverthe entire ‘periodof record’(unless
otherwise stated)tosee if there wasanygeneral validityto‘eyeball’correlationsmade ongraphswith
varyingtime spans.
27. The problemwiththe differentgraphingtechniques,however, isthatwhenanumberof differentions
are scaledsimilarly,the overallresultmaybe eitherrevealingormisleading dependingonhow youlook
at it(!) Here are tworeconstructionsof the original correlatedmetals movementgraphof p.7 usingthe
same techniques,lefttoright,asabove withAsand SO4 only.
The ‘correlated’movementseentothe leftisalmostentirelymissingonthe rightdue to the fact that
the metalswere notall scaledto sulfate. Withthe exceptionof boronandbarium, the upsand downs
of the variousmetalsobscure the general pattern. The magnitudes,however, are more clearlyrevealed
on the righthand plot to have beenverysmall.
On the otherhand,plotsof ‘total’metalsdone inthe same manner tell adifferent,more consistent,
story.Nowboth depictionsseemtobe sayingthe same thing,acorrelatedupwardresponse of mostof
the metals,and,inaddition,the some of the magnitudesare significant.
The highmetalsconcentrationsnoted were aresult, notof changesinany ‘electronicstructure’,but
simplydue tothe typical ‘dilution’ scenarioof dippingTDSandrisingTSS. The cause of the highmetals
concentrationsatMorelasin 1992-93 was a massive influx of suspendedsolidscomingfrom the Gila
28. flow. Andhavingarrivedbackwhere we started,havingraisedfarmore questionsthanprovided
answers.. . thisseemslike agoodplace toend.
Appendix A
Coverage,Approachand“Deliverables”Summary
The projectdevelopedinseveral stages. The firstwascreatingthe tools foran integratedapproach.
The secondwas to produce ‘profiles’of site chemistryusingaverage valuesforanumberof Arizona
streamsfrompublicwaterqualityrecords.The thirdwasto add the capabilitiesof USGSgeochemical
modellingprograms. Fourth,the modellingprogramswere usedtogenerate more detailedviewsof
some of the same sitesforwhichprofileshadbeenmade.Finally,toolswere createdthatallow forthe
rapidcharacterizationanddepictionof streamchemistry.
An integratedapproach tostreamchemistryinvolvestryingtoachieve a‘complete’pictureof the
systembeingconsidered. The massand charge balance are the basictools. The advantagesof an
integratedapproachare that resultscaneasilybe checkedanddifferencesraisequestionsthatleadto
furtherinvestigation.The discoveryprocessis,asitwere,self-perpetuating.
The massbalance,forexample,canbe checkedagainstaphysical measurement -- total dissolvedsolids
results. The difference betweenthe twoisa measure of the completenessof the ‘picture’of the
system.The charge balance can use a numberof tests(sevenare usedhere). How manyteststhe
charge balance passesorfailsgivessome indicationof how wellthe numbersinthe individual analyses
‘fittogether.’ A poorcharge balance indicatesonlythatthere isaproblemsomewhere inthe ‘complete’
picture beingproducedandgiveslittle ornoindicationwhere thatmayproblemmightbe.
Implicitinthe approachisthat all available dataisused.There are some pitfallsaswell asadvantagesto
thisaspect. The profilesproducedare overthe entire periodof recordbutthatmay range from
hundredsof samplesover40 to 50 yearsto five totensamplesovera yearor two.In general,siteswith
manysamples overlongperiodsof time were favored.
A fewsiteswithlessernumberof samples,however,were alsoused,typicallythose withahistoryof
exceedingwaterqualitystandardsand/ortofill gapsinlongstretchesalongastream.Obviously,some
care has to be usedingeneralizingfromresultsthatwere generatedfromonlyafew samplesovera
short spanof time.Withsuchsites,comparisonwithothermore adequatelycoveredsiteseither
upstreamor downstream,if available,canaidinevaluation.
Some siteshave manysamplesbutnotall the sampleswere ‘complete’analyzes.Inthisstudy,generally
onlysampleswithall the majorions(Na,Ca,Mg, Cl,SO4, HCO3) and at leastsome metalswere used.
These restrictionshave todobothwiththe methodsandwiththe purpose of the study. The ideaisthat
there isan electronicstructure createdbythe majorions(the ‘matrix’) andthatminorconstituentssuch
as metalshave tofit intothisstructure incertainways. Some attemptswere made toextrapolate major
ionconcentrationsfrombasicchemical measurementsbutthese were notfoundsatisfactoryandwere
discontinued.
29. To date,about 100 ‘average’value profileshave beencompleted.Theseprofilesincludemassand
charge balance resultsandPiperPlot(software courtesyof UtahUSGS) depictionsof the majorions.As
an aide to navigation,profilesare alwayssavedatthe same place (the PiperPlotonthe ‘results’sheet)
and followasetlayout(describedin‘Intro-howto-metadata’file)
PiperPlotsare particularlygoodat depictingnotonlythe relativepositionof the particular‘mix’of ions
but alsothe variability. Some siteshave mostof the individual sample pointsclusteredtightlyintoa
small area,othershave themina wide swathacrossthe diagram. The firstrepresentswhatmightbe
calledinsome sensesa‘stable’matrix while the secondisamore ‘diffuse’or‘more highlyvariable’
matrix. Some sites,like the ColoradoatLeesFerry,show both – a verydiffuse matrix before 1964 and a
very tightmatrix afterwards.Forthe mostpart, however,the average value profilesare static,
representing a‘snapshot’of the systemoverthe entire periodof record.
The resultsof these profilesare depictedinaseriesof about35 GIS mapsand associatedfiles. Thirteen
of the mapsare statewide depictionsof the variouswatermatrix compositionsandgroupingsof
interest. The mainmap,labelledAZwatermatrix,unfortunatelyhadtobe dividedinto4partsdue to size
limitations.The ‘composition’mapsshow the matrix compositionsatabout16 sites,representing9of
the major streamsaroundthe state (1-3 samplesalongthe Colorado,Bill Williams,AguaFria,Verde,
Gila,Salt,Santa Cruz,San Pedroand Little Colorado)
‘Composition1”usesapie chart depictionof the charge percentsof the majorionswhile ‘Composition2’
usessymbolsproportionaltosize.‘Confidence’and‘variability’mapsgive chartdepictionsof the mass
and charge balance resultsandsome measurementsof the variabilityshownin the PiperPlot.Ideally,
confidence andvariabilityinformationshouldbe presentedalongside composition.
Othermaps inthe statewide sectiondepictadditional,associatedinformation.Three mapstermed
‘AZhotspots’showthe locationsof waterqualityexceedancesatprofiledsitesintermsof numberof
parametersexceeding,magnitude of exceedances,andmaximumvalues(regardlessof exceedance
status).There are also twomaps showingareasof highor low solidsproduction. One mapand an Excel
file categorize matrix compositionsintermsof dominantanionsandcations(alkalinityandhardness
types).
Finallytwofiles,one mapandone Excel file,are the resultof alargelyabortive attempttofindevidence
of ‘transition’or‘mixing’zonesatthe variousexceedance ‘hotspots’aroundthe state.Many‘hotspots’
do occur at the junctionof differentwatermatricesbutactuallyseeingthe resultsof mixingdemands
that justthe right flowsandconcentrationsexistandlastlongenoughtogatherenoughdatato see
them.
The rest of the 35 mapsare locatedina subfoldercalled‘MajorStreams’. Here the 9 streamsplusthe
Hassayampaare shownonindividual mapswithcomposition,confidence andvariabilityall shownon
the same map. Sitesare labellednotonlywiththe name butalsowiththe numberof samplesandyears
coveredincludedinparentheses. ‘GilaatGillespieDam(385/42)’indicatesthe site has385 (complete)
analysesoveraperiodof 42 years,while ‘GilaatBuckeye Canal(6/1)’,thrownintohelp coverthe long
stretchbetweenGillespieandKelvin,hasonly6complete analysesover1year(Fortunatelythe results
30. are perfectlyconsistentwithKelvinandGillespie.) Some of the tributariestothe Gila,QueenCreekand
the San Carlos,however,have few samplesbuthave widelydifferentcompositionsfromthe Gila. Both
showlowervariance thanthe Gilabut have poor charge balance results. How muchtheycontribute to
the Gila woulddependonflowsandrelative concentrations.
As the profilesapproachedcompletion,workbeganinvestigatingthe use of USGSgeochemical
modellingprograms. Twoprograms,WATEQ4F and PHREEQC,were used. WATEQ4F isan older
program,somewhatlimitedinoutputandusingdifferentassumptionsthanPHREEQC. Both programs
dependonan underlyingdatabase of thermodynamicdata (standardenthalpies). Whatthe programs
offerisa quickway of doingdifficult,iterative ‘bestfit’calculationstogetspeciation,activity,and
solubilityfrompHand redox data.While handy,these programscome withassumptionsandthere is
some riskintheiruse (see theoretical considerationsbelow)
To date,twentythree profilescoveringfourteenstreamshave beenredoneusingthe programs. The
filesare labelledwith‘grab’atthe endof the file name andthe elementsexaminedindetail in
parentheses(usuallyFe andCu). The analysisinthese profilesislimitedtoaverage valuesandplaced
nextto the earliervalues(PiperPlot) forcomparison.Inadditiontothe charge percentcompositionpie
charts, however,are cationandanionspeciation,activityandsolubilitychartsaswell asall metal s and
predominantmetalsactivitiesandsolubilities.Resultsare linedupbyprogramfromleftto right,
WATEQ4F, PHREEQC withitsowndatabase,and PHREEQC withthe more extensive LawrenceLivermore
database. Resultswere generallyfairlysimilarforall three programsandall were usuallywithin1-4%of
earliercalculations.
Once some confidence hadbeenbuiltupwiththe average values,workbeganongettingamore
detailedviewof the variousmatrices. Toolswere developedtogenerate graphsandcorrelation
matricesfromdata on the ‘output2’sheetof the ‘grab’profiles. The ‘output2’sheethasdatagrouped
and organizedinsetlocationsmakingitveryeasytopickout data byelement,analysistype (speciation,
concentration(activity) orsolubility),andanindependent(x) variablesuchasdate,pH or conductivity(or
anotherelement).Virtuallyanythingcanbe plottedorcorrelatedwithanything else(thoughthe
programshave not beencheckedforeverypossible combinationsothere are occasional hangupsand
snafus)
The ideahere isto give as manyperspectivesaspossible onthe system. Several graphtemplateswere
developedcomparingmatrix parametersagainstbasicmeasurementandeachother. The most used
template haspH,flowandconductivityand‘massflux’chartsacross the topof the sheetwithdifferent
matrix parametersfollowingbelow. The ideaistolookat conductivity,flow,andpH‘events’andthen
checkthe chemistryatthe same pointsto see if there appearstobe any response. Matrix parameters
are alsoexaminedagainsteachothertosee if there are anypatterns.
Because correlationscanbe chance,one-time events(coincidental) andpatternsmayneeddifferent
time spansto become visible,mapsandcorrelationscanbe generatedusingdifferenttime frames.
Maps were usuallygeneratedwith‘all’data,whichare mostlyuselessforanalysisdue totoomany
pointstosee anything,butoccasionallyshow patternsnotseeninfinerdetail,andyearlyincrements.
31. Correlationswere usuallydoneoverthe periodof record,largelytoverifyif seemingcorrelations
spottedongraphs hadany general validity,butcanalsobe done forany time frame of interest. One
program runscorrelationsof one parameteragainstanynumberof otherparametersona yearlybasis
and itis interestingtosee thatcorrelationscancome and go overtime (thoughhardto judge what
significance thismayhave)
To date,14 ‘matrix’studieshave beencompletedonfourstreams(Gila,Salt,ColoradoandSantaCruz).
Whenfirstbegun,the studiestookseveral daysbutrefinementshave reducedthe time to2-3hours.
One sheetof mapsis producedusinggraphingprograms,thenthe entire sheetiscopiedandanother
program usedtochange the dateson all the graphsof the new sheet. IN thisway,annual graphs
covering20-30 yearscan be producedveryquickly. Correlationmatriceswere developedandrowand
columnheaderscopiedtoproduce the nextfilescorrelations.
THEORETICAL CONSIDERATIONS
The USGS programstake the ‘total’analysesof the database andworkout the variouscompoundsthat
are mostlikelytoexistata givenpHand redox potential.The majorions,particularlyNa,Cl andSO4, are
predominantlyintheirionicform.NaasNa and Cl as Cl, forexample,are almostalwaysnearly100%
(Na/Na,Cl/Cl ~100%, SO4/SO4 istypically60-80%) Ca, Mg, andHCO3 oftenexistincompoundssuchas
CaHCO3, CaSO4 etc.
PO4 existsinsmall amountsasPO4,is mostcommonlyfoundasHPO4 and formscompoundsprimarily
withothermajorionsand iron.What thismeansisthat, if PO4 has anyeffectonfree metal
concentrations,ithasto be an indirectone,possiblythroughalowerlevelcompetitionwithOHand
CO3, and to a lesserextentSandSO4,for major cations.
Ultimately,the wholeanalysisdependsonLaChateliersprinciple (asystemunderastresswill move to
relieve thatstress) anditsparticularformappropriate togeochemicalsystems,the law of massaction.
These principlespositthatif two reactantscome intocontact in a closedsystemthere isatendencyfor
themto forma product(time notspecified). Eachsetof reactantsform productup to a setamount
specifictothe system,atwhichtime the ‘stress’onthe systemreversesdirection towarddissolutionof
the product back intoreactants. At thispointthe systemhasreachedwhatistermed‘equilibrium’
whichisdefinedasthe reactiontowardcreationof productbeingequal tothat towarddissolution. The
equilibriumistermeddynamicinthatthe concentrations,while alwaysfluctuatingslightly,appear
unchangingbecause there isnooverall movementineitherdirection.
Equilibriumsituationsare mosteasilyanalyzedinlabbeakers. Saysmall amountsof soluble CaandSO4
compounds (CaNO3andNaSO4 wouldprobablydo) are placedina beakerof DI wateron a lab bench
(thatis,withno analyzable inputsof massorheat). The compoundswill dissolvealmostinstantlyand
veryquicklyCaSO4will begintoform. Firstthere wouldbe a tendencyforCaand SO4 ionsto associate,
thensome pairswouldbegintoformmolecularbonds,finallyif conditionsare right,CaSO4wouldbegin
to precipitate outof solution.
Ca + SO4 [CaSO4] CaSO4 aq
32. Here a couple of potential problemscropup. What the programsfind,asfar as I know,are the
associatedionsorso called‘ionpairs’notactual molecularspecies. Ionpairsare describedasgroupings
of ionsthatare heldtogetherbyveryweakforces(coulombicinteractions)asopposedtothe stronger
bondsof actual molecules. Whethertheyare,ingeneral,strongenoughtowithstandthe forcesof
filtrationisnotknown(atleastbyme) so whethertheywouldbe inthe dissolvedorthe total analysis
portionisnot clear. In thiswork dissolveddatawasusedwheneverpossible unlesstotal wasspecified
(WATEQ4F specifiestotal Fe).The rationalehere isthatthe suspendedsolidportion,whichincludes
largelyunchargedparticles,doesnotfigure directlyintothe posited‘electronicstructure’.
Evenmore significant,however,isthatequilibriumis,Ibelieve,generallyconsideredasbetween
reactantsand (molecular) products.There mayalsobe anequilibriumbetweenreactantsandionpairs
but itmightbe verydifficulttoanalyze. IFthere isnomolecularproductthere maybe no equilibrium
and resultsmaybe “misleading,’accordingtoone authority(Hems).
Of course,the whole conceptof equilibriumisnotquite appropriateforreal worldsystemseither.
Natural systemsare usuallynot‘closed’toinputsof massand/orheat. The CaSO4 reactionthatoccurs
insecondsina beaker,apparentlylastedoveraperiodof eightmonthsonBoulderCreek(atleastif
increasedionpairformation andpredictedprecipitateare anyindication). The term ‘steadystate’is
usedto describe opensystemsinwhichinputsof massandheatare assimilatedinafashionthatmimics
equilibrium.
But while mostof usare happyenoughtoset aside the whole notionof ‘equilibrium’as‘theoretical’and
use the resultinginformationbasedonitsassumptiontosolve problems,there are otherdifficulties.
Evenin the case of Ca and SO4 ina beaker,the resultsmightbe verydifferentif acompetingionwere
present. We relyonthe programto sort out these competingrelationshipsbutthe programscan only
use the informationwe give themandthe informationinthe underlyingdatabase.Typically‘modelling’
meansthat a givensystemisanalyzedtoinclude all the parametersthatare involvedand the underlying
database ischeckedforboth internal consistencyandrelevance tothe system. Where appropriate,the
informationinthe database mayneedtobe changedor addedto.None of thatwas done here.
Insteadthe programswere usedwithverylittle ‘tweaking’toinvestigatethe watersystemsnotbecause
thisisthe bestwayto do it butbecause of lack of knowledge onthe userspart(i.e.me!). Atfirst,the
inputswere limitedtoaverage valuesandcomparedtothe profilesgeneratedusingsimplermethods.
Usuallythe activitiesderivedfromthe programswere within1-4percentof the concentrations(even
thoughthe two are not the same). The redox potential wassettothat of the H20/O2 pair – that isfor
full saturation. This‘dominant’pair assumptionishotlydebatedingroundwaterstudiesbutaccepted
(Fraseretal.) and probablyo.k.forthe typicallymore homogeneoussurface watersample.
The underlyingdatabaseswerenotexaminedforconsistency,completenessorrelevance thoughthey
probablyshouldhave been. Instead,the resultswere evaluatedagainstgenerallyacceptedfindings. For
example,PHREEQChastwodatabasesthatcan be pluggedin,one comeswiththe programand the
otheris a compilationfromthe Lawrence Livermore Laboratories. The latterisa verycomplete setof
data but some valuesmayhave beenderivedinveryspecificcircumstances. Usingthe Lawrence
33. Livermore datasetonColoradoRiverwateryieldedthe findingthatCuCO3was the mostcommon form
of copper,while WATEQ4FandPHREEQC datasetsagree withthe more generallyacceptedfindingthat
Cu(OH)2,ismore common. The Lawrence Livermore datasetwasusedbutmore fora ‘whatif’
comparison.
In some cases,however,the problemsresultingfromnottweakingthe underlyingdatasettomatchthe
systembeinganalyzedmayhave andprobablydidmake the analysesmeaningless. The SantaCruz in
particularseemsalmost‘unanalyzable’,showingverylittle correlationorpatternsamongthe majorions,
but that maybe because,historically,there hasbeenasignificantconcentrationof ammoniaandthe
programshave ammonia‘uncoupled’fromotherreactions.Thisisanarea where furtherworkis
definitelyneeded.
Thisarticle isa re-write of anearlierprojectbegunatADEQthat usespublicrecordwaterquality
data to examine patternsinsolidsdistributionsinnatural waters. There are no references
eitherstatedorimpliedtoADEQor ADEQ policyinthe article andthere wasno commenton the
subjectmatteronthe part of reviewersatADEQ. Thispostingseeksfeedbackonthe article as
part of an ‘improvement’plan. Sendcommentsandquestionstopcba2@dialup4less.com.