Magnetic resonance imaging artifacts and fixed orthodontic attachments
sj%2Fdmfr%2F4600626
1. Detection of simulated internal tooth resorption using conventional
radiography and subtraction imaging
JP Holmes1
, K Gulabivala*,1
and PF van der Stelt2
1
Department of Conservative Dentistry, Eastman Dental Institute for Oral Health Care Sciences, University College London,
London, UK; 2
Department of Oral Radiology, Academic Centre for Dentistry Amsterdam (ACTA), Amsterdam, The Netherlands
Objectives: To compare the diagnostic accuracy of conventional radiography with digital
subtraction imaging in the detection of simulated internal resorption.
Methods: Simulated resorption cavities were created by the sequential use of progressively
larger round burs (ISO size range 006 ± 016) in the labial wall of the coronal or apical thirds of
the pulp chamber of the maxillary incisors of two cadavers. Five viewers examined 120 pairs of
radiographs, one of each pair being baseline (no lesion) and the other with or without a lesion.
The process was then repeated with subtraction images of the pairs of radiographs. Receiver
Operating Characteristic (ROC) analysis was used to compare the diagnostic accuracy of the
two imaging modalities.
Results: Using conventional radiography, the minimum lesion size detectable coronally was in
the `medium' range (ISO size 010 and 012 round burs), but only `large' lesions (ISO size 014 and
016) could be detected in the apical region. The overall diagnostic accuracy of subtraction
imaging was superior to conventional radiography but only signi®cant (P50.05) for coronal
lesions.
Conclusion: Subtraction radiography may be a useful tool for detecting and monitoring the
progress of internal root resorption.
Keywords: tooth resorption; radiographic image interpretation, computer-assisted; subtraction
technique; cadaver
Introduction
Rabinowitch1
comprehensively reviewed the literature
on internal resorption since it was ®rst reported by Bell
in 1830. The prevalence, aetiology and natural history
is uncertain. It has been suggested that the process is
initiated by a variety of stimuli and perpetuated mainly
by bacterial factors.2,3
Internal resorption is clinically
well recognised with its early detection entirely
dependent on radiography. Although longitudinal
observations on progression are sparse, the accepted
view is that the presence of internal resorption merits
initiation of root canal treatment to arrest the
process.3,4
Early radiographic detection is therefore of
paramount importance.
The classical description of the radiographic appear-
ance of internal resorption was given by Gartner et al.5
as a clearly de®ned symmetrical radiolucency of
uniform density which balloons out of the pulp
chamber or root canal.
Subtraction imaging may o€er better detection of
internal resorption by eliminating anatomical noise and
by using image enhancement and manipulation.6
Two
studies have demonstrated its superiority in the
detection of simulated external resorption.7,8
The use
of radiographic or digital imaging in the assessment of
in vitro simulated internal resorption lesions has not
been reported.
The purpose of this study was therefore to compare
the diagnostic accuracy of conventional radiography
with subtraction imaging in the detection of simulated,
internal resorption lesions in cadavers. The investiga-
tion included the validation of the use of a simple stent
which would be appropriate for chairside use.
*Correspondence to: K Gulabivala, Department of Conservative Dentistry,
Eastman Dental Institute for Oral Health Care Sciences, University College
London, 256, Grays Inn Road, London WC1X 8LD, UK
Received 22 February 2000; accepted 25 April 2001
Dentomaxillofacial Radiology (2001) 30, 249 ±254
ã 2001 Nature Publishing Group. All rights reserved 0250 ± 832X/01 $15.00
www.nature.com/dmfr
2. Materials and methods
Two cadavers were selected, each with intact central
incisors and sucient posterior teeth to allow
predictable relocation of a stent. The upper right
central incisors were extracted from each specimen and
split in the coronal plane using an osteotome guided by
a 0.5 mm deep groove cut with a diamond disc (X927-
7, Premier Dental Products, Norristown, Canada). The
halves were relocated with superglue (Loctite, Loctite
UK, Welwyn Garden City, UK) and replaced in the
sockets.
The study relied on sequential radiographs taken
using a modi®ed beam-aiming device (Figure 1) that
allowed accurate repositioning after each modi®cation
of the simulated lesion. The beam-aiming device
incorporating a stent was constructed by attaching an
anterior X-ray holder (Rinn XCP Kit, Rinn Corpora-
tion, Elgin, IL, USA) to a modi®ed disposable
impression tray, containing a polyether (Impregum F,
ESPE, Seefeld, Germany) impression of the maxillary
teeth, to permit unimpeded passage of the X-ray beam.
The teeth were exposed at 65 kV and 7.5 mA (Oralix
65S, Phillips Medical Systems, London, UK) using E
speed ®lm (Ektaspeed Plus, Eastman-Kodak, Roche-
ster, NY, USA) together with a stepwedge consisting of
four steps of 1, 2.5, 6 and 11 mm, approximating to an
exponential increase, and made from 99% aluminium
(ACTA, Amsterdam, The Netherlands).
Initial radiographic calibration con®rmed that the
optical density of the stepwedge was within the useful
range of 0.3 to 2.0.9
Baseline radiographs were taken of
both specimens with a target-®lm distance of 6 cm. The
teeth were then re-extracted, re-split and lesions cut to
half the depth of an ISO 006 (0.6 mm diameter) round
bur in the labial wall of the coronal third of one
specimen and in the apical third of the other specimen.
The halves were relocated as before and radiographed.
The process was repeated, enlarging the lesions
sequentially up to ISO size 016 (1.6 mm diameter)
round bur and radiographing of each size of lesion as
indicated in Table 1.
Processing was carried out using manual developer
(LX24, Kodak-Pathe, Paris, France) and ®xer
(Industrex, Kodak-Pathe, Paris, France) in thermo-
statically-controlled tanks using freshly mixed chemi-
cals at 218C. All ®lms were developed on the day of
exposure with 5 min development and 10 min ®xation.
One hundred and twenty pairs of radiographs were
prepared for presentation to viewers, 60 pairs from
each specimen. The reference radiograph was the
baseline view with no lesion present and was always
on the left. The second radiograph had either no lesion
or a lesion in the range of 0.6 mm to 1.6 mm. Sixty
pairs (50%) were no lesion/no lesion combinations,
while the other 60 were no lesion/lesion combinations.
Pairs were presented in a random sequence.
Five viewers with a range of interests and experience
were given written instructions for the study. Viewing
was performed in a darkened room with radiographs
mounted on a masked light box with 64 magni®cation
(Rinn, Elgin, IL, USA), with minimum rests of 15 min
after each set of 30 pairs. Viewers were invited to
complete a Receiver Operating Characteristic (ROC)
Figure 1 Stent located on cadaver specimen. (a) Head of cadaver;
(b) impression tray forming part of the stent; (c) X-ray ®lm; (d)
beam-aiming device
Table 1 Pairs of radiographs by lesion site and size
Lesion dimensions in second tooth of pair
(round bur ISO size)
006 008 010 012 014 016
Specimen 0 (0.6 mm) (0.8 mm) (1.0 mm) (1.2 mm) (1.4 mm) (1.6 mm) Totals
1 (apical) 30 5 5 5 5 5 5 60
Pairs of radiographs
2 (coronal) 30 6 6 6 4 4 4 60
Pairs of radiographs
Totals 60 11 11 11 9 9 9 120
Detection of tooth resorption
JP Holmes et al
250
Dentomaxillofacial Radiology
3. questionnaire and were given access to reference
radiographs illustrating a range of lesion sizes.
The pairs of radiographs were then converted into
subtraction images. In the registration process, the
baseline radiograph was placed in the centre of a
movable stage mounted on a masked overhead
projector. The image was captured by a monochrome
CCD video camera (XC-77, Sony Corp., New York,
NY, USA) mounted perpendicular to the ®lm and the
image viewed on an adjacent television monitor. After
this reference image was saved on disk, the ®lm was
replaced with the second of the pair. By reversing the
grey scale of the reference image and showing both
images simultaneously, real time subtraction was
performed. The second image was brought into super-
imposition by executing rotational and translational
movements and then captured in this position. The
frame grabber had a 5126512 matrix resolution (Vision
EV-681, Everex Systems, Freemont, VA, USA) and the
images were captured into a personal computer running
Vision Image Processing System software (ACTA-Oral
Radiology, Amsterdam, The Netherlands). The regis-
tration was repeated for all 120 pairs of radiographs.
The subtraction process was performed using the
EMAGO software (Oral Diagnostic Systems, Amster-
dam, The Netherlands). The images were manipulated
in an identical manner by gamma correction of the
radiograph pair to ensure standardisation of contrast10
and geometrical reconstruction to correct for any
alignment errors.11
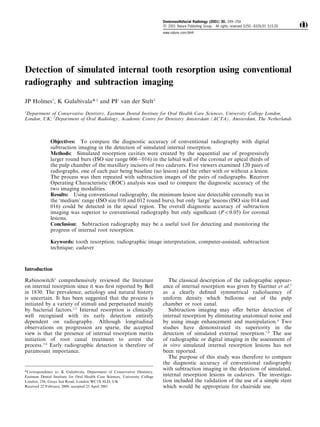
A typical pair of radiographs with a 1.6 mm lesion
in the apical third of the upper right central incisor
with its resultant subtraction image is illustrated in
Figure 2. Before second stage viewing, the readers
were given an orientation demonstration, explaining
the subtraction process and displaying examples of
images with and without lesions. The 120 images were
then viewed in the same sequence as their radio-
graphic pairs and the ROC questionnaire completed
as before.
Individual data were input in to the CORROC2
program12
which plots the `best ®t' curves and
calculates statistical signi®cance by an univariate Z-
score test of the di€erence between the areas under two
ROC curves. The null hypothesis was that the data sets
generated ROC curves with equal areas beneath them.
P40.05 was taken as being signi®cant. Operating plots
were used to generate ROC curves in an Excel
spreadsheet (Microsoft, Redmond, WA, USA) for
visual assessment.
Figure 2 A radiograph pair with the resultant subtraction image. An apical lesion was created with a size 5 round bur. (a) First radiograph; (b)
second radiograph; (c) digital subtraction image (arrow shows the resorption defect)
Figure 3 Example of a typical ROC curve
Dentomaxillofacial Radiology
Detection of tooth resorption
JP Holmes et al
251
4. Results
The CORROC2 program permitted only the prepara-
tion of curves for individual viewers and these were
plotted for apical, coronal and both lesions combined.
For two of the viewers the limited range of responses
for the coronal lesions rendered the data degenerate.
An example of the ROC curve for one viewer is shown
in Figure 3.
Tables 2, 3, 4 and 5 illustrate the total percentage
ROC responses for each site by lesion size, grouping
bur ISO sizes 006 and 008 as `small', 010 and 012 as
`medium' and 014 and 016 as `large'. The results for
the individual ROC curves for all lesion sizes are
presented in Table 6 together with the statistical
di€erences. The average AZ values are presented in
the histogram in Figure 4. It can be seen that although
the diagnostic accuracy of the subtraction images was
superior to conventional radiography, it was only
signi®cant for coronal lesions for three of the ®ve
viewers.
Discussion
The main objective of this study was to assess the
feasibility of subtraction radiography for the evalua-
tion of internal root resorption. It also permitted the
validation of an appropriate stent for the potential
monitoring of lesions. The system developed was
cheap, with a good shelf-life and o€ered acceptable
geometrical reproducibility, only minor geometrical
alignment of the images being necessary during
subtraction imaging. The polyether impression mater-
ial had adequate rigidity and elasticity, with the
advantages of dimensional stability and radiolucency.
Vaseline applied to the teeth eased stent removal and
relocation. It is likely, however, that in the clinical
Table 2 ROC responses (per cent) for apical lesions using conventional radiographs
ROC response (per cent)
Definitely Probably Probably Definitely
present present Uncertain absent absent
Apical lesions No lesion 8.67 17.33 14.67 53.33 6
Small lesion 8.33 26.67 16.67 40 8.33
Medium lesion 10 24 14 44 8
Large lesion 62.5 35 2.5
Table 3 ROC responses (per cent) for coronal lesions using conventional radiographs
ROC response (per cent)
Definitely Probably Probably Definitely
present present Uncertain absent absent
Coronal lesions No lesion 0.67 12 8 62.67 16.67
Small lesion 0 14 10 62 14
Medium lesion 14 26 0 50 10
Large lesion 30 38 14 18
Table 4 ROC responses (per cent) for apical lesions using subtraction images
ROC response (per cent)
Definitely Probably Probably Definitely
present present Uncertain absent absent
Apical lesions No lesion 7.33 18 14 29.33 31.33
Small lesion 11.67 23.33 20 26.67 18.33
Medium lesion 14 36 10 26 14
Large lesion 90 10
Table 5 ROC responses (per cent) for coronal lesions using conventional subtraction images
ROC response (per cent)
Definitely Probably Probably Definitely
present present Uncertain absent absent
Coronal lesions No lesion 4 10 8 27.33 50.67
Small lesion 14 30 12 14 30
Medium lesion 88 12
Large lesion 98 2
Dentomaxillofacial Radiology
Detection of tooth resorption
JP Holmes et al
252
5. situation, the reproducibility may not be as good and
greater reliance would need to be placed on geometric
correction. The strict selection criteria used for cadaver
maxillae (a model considered more representative than
dry skulls), made it dicult to ®nd suitable specimens.
Twenty were examined to select the two used, limiting
the sample size and therefore variability. The technique
of splitting and reassembling teeth was rehearsed and
re®ned on other extracted teeth. This method gave
predictable results, although it may only be of value in
single-rooted teeth with one root canal. Sequential use
of round burs produced representative `lesions', a
mechanical method being preferred over chemical
dissolution that would have resulted in subsurface
demineralisation. Clinically however lesions may be
more irregular in outline and scalloped microscopi-
cally.13
We considered it adequate for qualitative
assessment and quanti®cation was eventually in the
broad terms of small, medium and large. We found
that subtraction imaging outperformed conventional
radiography as a diagnostic tool, in particular for
coronal lesions (Table 6). The statistical signi®cance in
the reading of `all lesions' was due to skewing of the
results by the very high success rate when viewing
coronal lesions.
Strictly speaking, the ROC analysis does not permit
the assessment of overall sensitivity and speci®city for
the diagnostic tool. Some researchers have arti®cially
overcome this by totalling the `de®nitely present' and
`probably present' responses to calculate sensitivity and
the `de®nitely absent' and `probably present' responses
for speci®city but a change in the level of con®dence
would appear to be the only interpretation that is
valid. Tables 2, 3, 4 and 5 show the pooled degree of
con®dence in decision-making of our viewers. Subtrac-
tion images of apical lesions produced a true increase
in con®dence of lesion presence (e.g. `probable'
responses become `de®nite'), but also a false increase
in con®dence of absence. A very marked and true
increase in con®dence for both presence and absence
was seen for coronal lesions, which was also found for
all lesions, as explained above.
It is interesting to consider the suitability of the
ROC questionnaire from our results. Two of the
viewers, doubtless aware of the limitations of radio-
graphic diagnosis, did not score any of the 120 pairs of
radiographs as `lesion de®nitely absent'. Perhaps if this
response had been amended to `lesion de®nitely or
almost de®nitely absent', a better range may have been
obtained. We also noted a strong unwillingness to
record `uncertain', irrespective of age or experience.
This has been observed in a previous ROC study14
where such lack of indecision in students and dentists
was attributed to a combination of self-selection and
training, an incorrect diagnosis being preferable to no
diagnosis. Whilst this may be a valid observation, it is
also possible that in this in vitro study the responses
would have been di€erent if the diagnoses had been
linked to real treatment decisions. Speci®cally, the
`lesion present' response would have been used with
less conviction if it would have led to pulp extirpation.
Application of ROC analysis imposed certain
limitations. Ideally, only one lesion should be
prepared per tooth, limiting the number of sites that
can be examined. Also, the method is not well suited to
examining a range of sizes; an all or nothing response
being preferred. Notwithstanding we felt that the use of
a range of lesion sizes was justi®ed to de®ne the lower
limits of sensitivity. In Tables 2 ± 5, the percentage of
ROC responses to the presence of no lesion acts as a
Figure 4 Histogram comparing AZ values for apical, coronal and all
lesions with conventional radiography and subtraction images
Table 6 Difference between the individual ROC curves for all lesion
sizes and each individual observer
Viewer Lesion site Significance
Viewer 1 Apical#
0.217
Coronal Data degenerate
All sites 0.127
Viewer 2 Apical 0.076
Coronal 0.000
All sites 0.000
Viewer 3 Apical 0.095
Coronal 0.004
All sites 0.000
Viewer 4 Apical 0.434
Coronal 0.002
All sites 0.007
Viewer 5 Apical 0.086
Coronal Data degenerate
All sites 0.1895
In all cases except one (indicated by #
) the Az values for the
subtraction images were larger than for the original radiographs.
Signi®cant di€erences (P50.05) are shown in bold
Dentomaxillofacial Radiology
Detection of tooth resorption
JP Holmes et al
253
6. control for the remaining three rows. Table 2 reveals
that radiographs of lesions smaller than large attracted
a similar range of responses to specimens with no
lesion present. However Table 3 indicates that medium
and larger coronal lesions were detectable. Tables 4
and 5 show that in subtraction images all sizes were
more detectable than no lesion with coronal lesions
being again the most clearly visible.
There have been no previous published studies of
simulated internal resorption. However, it is useful to
compare our ®ndings with those of Kravitz et al.7
and
Hintze et al.8
on simulated external resorption. The
former study resembled our work in that numbers of
teeth and viewers were similar and the technique of
sequential enlargement of bur cavities was used. On the
other hand, real time subtraction was employed with
di€erent software and cavities prepared in mandibular
molars of dry skulls. Their claim that the imaging
method left no discernible anatomical structures is not
borne out by their illustrations. As in this study, it was
found that diagnostic accuracy was site-speci®c with
proximal lesions being more readily detectable than
buccal. The lower limit of detectability was found in a
lesion prepared to the full depth of 008 bur which is
larger than we used.
Hintze et al.8
used mandibular premolars in
cadavers, but signi®cantly, a di€erent method of
image generation. Rather than using a registration
process, they superimposed common reference points
on the pairs of radiographs. The quality of their images
seems to be poorer than ours, perhaps explaining why
they found that subtraction was no better than
radiography.
It could be argued that our technique would have
little clinical value in the investigation of internal
resorption as it would be rare for there to be baseline
radiographs. However, if early resorption is detected as
an incidental ®nding, the radiograph could act as the
baseline for monitoring by subtraction. This could be a
valid approach, as even quite large lesions have been
reported to progress very slowly, arrest or heal.15,16
Therefore, although the currently accepted approach to
treatment of internal resorption is pulpectomy, the
method tested in this study could lead to a more
rationale approach.
In conclusion, subtraction imaging is better than
conventional radiography for the detection of simu-
lated internal resorption, in particular coronal lesions.
It could be a valuable tool for monitoring the progress
of internal resorption to establish clearer guidelines for
intervention.
Acknowledgements
Lt Col Holmes would like to thank Dr S Dunn and Mrs J
Brown for their advice and assistance at the outset of this
study. He would also like to thank his viewers, Mr C
Smith, Mr AE Hoskinson, Lt Col R McCormick, Sqn Ldr
J McDavitt and Major E McColl. The ®nancial support of
the Defence Dental Agency for the MSc course in
Endodontics at the Eastman Dental Institute is gratefully
acknowledged.
References
1. Rabinowitch BZ. Internal resorption. Oral Surg Oral Med Oral
Path 1972; 33: 263 ± 282.
2. Wedenberg C, Kindskog S. Experimental internal resorption in
monkey teeth. Endod Dent Traumatol 1985; 1: 221 ± 227.
3. Tronstad L. Root resorption ± etiology, terminology and
clinical manifestations. Endod Dent Traumatol 1988; 4: 241 ± 252.
4. Trope M, Chivian N. Chapter 7 ± Root resorption. In: Cohen S
and Burns R (Eds). Pathways of the Pulp, 6th ed. St. Louis:
Mosby; 1994; pp 503 ± 505.
5. Gartner AH, Mark T, Somerlott RG, Walsh LC. Di€erential
diagnosis of internal and external root resorption. J Endod 1976;
2: 329 ± 334.
6. Versteeg CH, Sanderink GCH, van der Stelt PF. Ecacy of
digital intraoral radiography in clinical dentistry. J Dent 1997;
25: 215 ± 224.
7. Kravitz LH, Tyndall DA, Bagnell CP, Dove SB. Assessment of
external root resorption using digital subtraction radiography. J
Endod 1992; 18: 275 ± 284.
8. Hintze H, Wenzel A, Andreasen FM, Sewerin I. Digital
subtraction radiography for assessment of simulated root
resorption cavities. Performance of conventional and reverse
contrast modes. Endod Dent Traumatol 1992; 8: 149 ± 154.
9. Goaz PW, White SC. Oral Radiology. Principles and interpreta-
tion 3rd ed. Mosby, St. Louis. 1994; pp 86 ± 87.
10. Ruttiman UE, Webber RL, Schmidt E. A robust method for ®lm
contrast correction in subtraction radiography. J Period Res
1986; 21: 486 ± 495.
11. Dunn SM, van der Stelt PF, Ponce A, Fenesy K, Shah S. A
comparison of two registration techniques for digital subtraction
radiography. Dentomaxillofac Radiol 1993; 22: 77 ± 80.
12. Metz CE. ROCFIT2. Dept of Radiology, University of Chicago,
Chicago, Illinois IL60637. Software can be downloaded from:
http://www-radiology.uchicago.edu/krl/toppage11.htm.
13. Gulabivala K, Searson LJ. Clinical diagnosis of internal
resorption: an exception to the rule. Int Endod J 1995; 28:
255 ± 260.
14. Price C, Ergul N. A comparison of a ®lm-based and a direct
digital dental radiographic system using a proximal caries
model. Dentomaxillofac Radiol 1997; 26: 45 ± 52.
15. Hartness DJ. Fractured root with internal resorption repair and
formation of callus. J Endod 1975; 1: 73 ± 75.
16. Caliskan MK, Piskin B. Internal resorption occurring after
accidental extrusion of iodoform paste into the mandibular
canal. Endod Dent Traumol 1993; 9: 81 ± 84.
Dentomaxillofacial Radiology
Detection of tooth resorption
JP Holmes et al
254