Downloaded 1,867 times


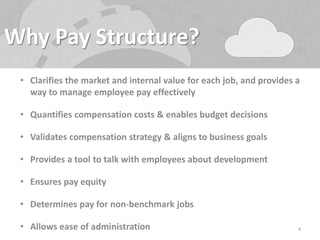

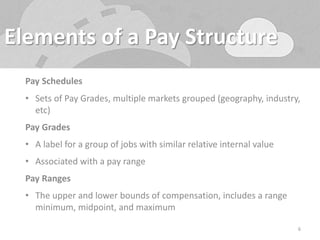
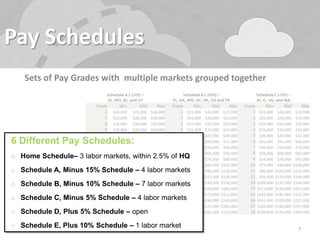
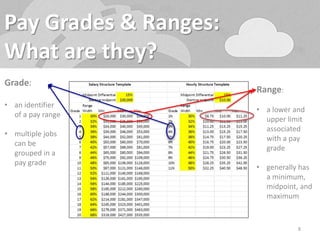

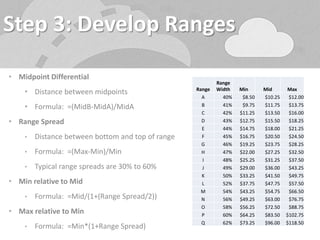
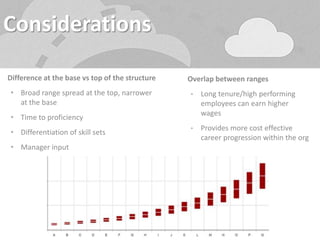
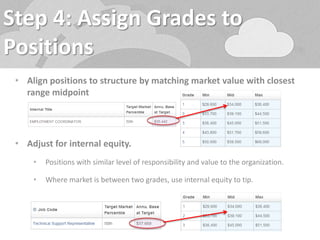
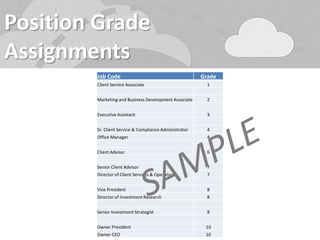


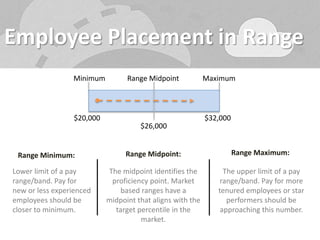
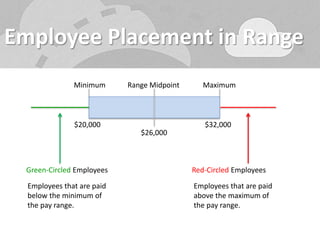
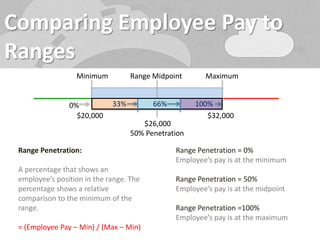


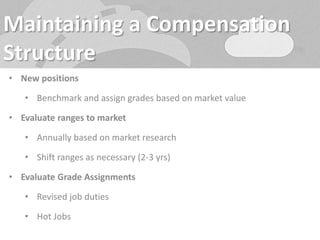
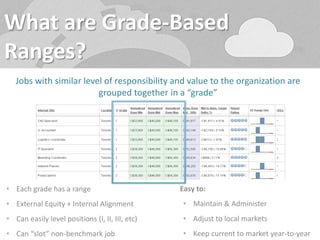
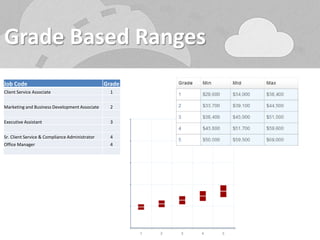
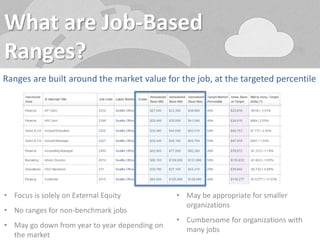

The document discusses building and maintaining a pay structure with grades and ranges. It provides guidance on key steps: 1) Identify multiple pay schedules to group labor markets and streamline the structure. 2) Determine pay grades by deciding the number of grades and job levels within each grade. 3) Develop pay ranges by setting the minimum, midpoint, and maximum for each grade using common differentials and spreads. 4) Assign positions to grades based on market pay and internal alignment. Maintain the structure by annually benchmarking grades and hot jobs against the market.