Oz Paper Help
WhatsApp:+91-9519066910
Email:ozpaperhelp@gmail.com
www.ozpaperhelp.com
www.cheapassignmenthelp.co.uk
www.freeassignmenthelp.com
https://www.ozpaperhelp.com/
2. Journal of Cleaner Production 322 (2021) 129048
2
Water reuse and recovery of energy and nutrients are still not
commonly addressed in most of the large-scale WWTPs (Diaz-Elsayed
et al., 2020). Recent years have witnessed the rise of microalgae-based
technologies and its strategies for sustainable and low-cost treatment
of wastewater (Goswami et al., 2021) together with biogas, biofuel and
biofertilizer production (Hussain et al., 2021). In addition, the recovery
of value-added materials such as cellulose (Da Ros et al., 2020; Palmieri
et al., 2019), biopolymers in the form of polyhydroxyalkanoate (PHA)
(Conca et al., 2020) or extracellular polymeric substances (Karakas
et al., 2020), volatile fatty acids (Longo et al., 2015) and others (e.g.,
single cell protein, vivianite) (Kehrein et al., 2020) has received a
growing attention by demonstrating high potential in real environment;
bringing the concept to standard practice (Pikaar et al., 2020).
A systematic assessment approach should be applied to fully estimate
the sustainability and viability of the investments and businesses on
technologies for resource recovery and reuse, not only from a techno
logical point of view but also considering social benefits and environ
mental impacts (Velenturf and Jopson, 2019). Thus, an ever-growing
interest among researches was detected in delivering Cost Benefit
Analysis (CBA) as a monetization method for quantifying both direct and
indirect impacts on social and environmental aspects (Carolus et al.,
2018). CBA can be used for providing the economic value (€) of social or
environmental goods or services provided by a certain practice. How
ever, it should be noted that there is a huge difference in the assessment
of resource recovery in wastewater and waste sectors as the CBA
assessment is not widely applied to the wastewater sector, while it is
more consolidated in the waste sector (e.g., waste of electrical and
electronic equipment, end-of-life vehicles) (Gigli et al., 2019; González
et al., 2017; Shaikh et al., 2020). In the wastewater sector, most of the
proven methodologies for values monetization include the evaluation of
hedonic prices and avoided/replacements costs associated to water
reuse for irrigation purposes (Arborea et al., 2017; Garcia and Parga
ment, 2015).
Although CBA is considered as a well-established tool in the water
reuse, there are only a few studies on CBA and socio-economic assess
ment of materials recovery and safe reuse (Lazurko, 2018). Social life
cycle assessment (S-LCA) is an impact assessment method that evaluates
the social and socio-economic aspects of products and their potential
positive and negative impacts along their life cycle (Petti et al., 2018).
S-LCA has been mainly applied to the manufacturing sector and its
application to wastewater sector for resource recovery (Zarei, 2020) is
limited, since it is not standardized and there are still uncertainties in the
selection of social impact indicators (Archimidis et al., 2020; Iofrida
et al., 2018). Social acceptance is perceived as one of the main bottle
necks in the successful integration of resource recovery technologies at
large scale (Kehrein et al., 2020). Furthermore, differences are expected
between developed countries and developing countries where the in
dustry treats workers and local community differently (Archimidis et al.,
2020). This highlights how resource recovery in the wastewater sector is
still a research field where knowledge gaps should be filled by innova
tion actions.
The Horizon 2020 (H2020) Innovation Action SMART-Plant (Smart
Plant, 2021) delivered innovative solutions for resource recovery and
reuse in the urban water sector. The project validated eco-innovative
solutions which upgraded the existing municipal wastewater treat
ment plants (WWTPs) to water resource recovery facilities (WRRFs)
through nine innovative technologies (hereafter SMARTechs) and paved
the way to deliver circular economy by demonstrating sustainable
inter-sectorial value chains. In the next step and in the context of this
paper, the sustainability of the SMARTechs were assessed following a
holistic approach through economic, environmental and social in
dicators. CBA was conducted on different bottom-up scenarios, consid
ering relevant combinations of SMARTechs in existing WWTPs. On one
hand, for the determination of internal costs to be included in the CBA, a
financial life cycle costing (fLCC) assessment was carried out for each
SMARTech and main cost results are reported in this paper
(SMART-Plant, 2020a). On the other hand, significant environmental
impacts from the environmental LCA (eLCA) (SMART-Plant, 2020b)
were monetized for the calculation of the total economic value of the
CBA.
Moreover, S-LCA was applied to determine the Social Readiness
Level (SRL) of each SMARTech and related SMART-products. To the best
of our knowledge, these are the first results to report socio-economic
impacts of wastewater-based resource recovery technologies. The find
ings of this study can provide basis and support to corporate social re
sponsibility of wastewater utilities, willingness to pay of water users and
adopt policies for CE.
2. Materials and methods
2.1. The SMART-Techs validated in real WWTPs
An overall overview of the SMARTechs together with the main final
products recovered/produced from the technologies and side stream
benefits are reported in Table 1 and illustrated in Fig. 1, respectively.
2.2. Scenario definition
Different scenarios were developed according to the SMARTech po
tential implementation in real WWTP sites. Several plants with different
capacities, expressed in people equivalent (PE), were taken into
consideration to develop representative and replicable scenarios at
different scales. The implementation of SMARTechs at full scale was
assessed in sixteen scenarios (seven scenarios with additional sub-
scenario(s) applied to different plant capacity) to understand the
possible benefits of resource recovery technologies in different repre
sentative local contexts. The scenarios are defined in Table 2.
In each scenario, a “bottom-up” analysis approach was followed as
the real data from the treatment plants were used to estimate economic
and social benefits of the SMARTechs. In this strategy, main system
variables were individually specified, analysed and interconnected to
evaluate the overall benefits of the technology. Specifically, following
this approach, the data coming from the baseline scenario (without any
SMARTech implementation) and SMARTechs were used for the valida
tion of a larger system that is the existing WWTPs with the SMARTechs
applied.
2.3. Definition and estimation of indicators
As a starting point for the replicability analysis, the scenarios were
analysed using both the fLCC and the eLCA results to carry out the CBA.
Moreover, for non-monetizable social indicators the S-LCA was devel
oped to evaluate positive or negative impacts of SMARTechs on stake
holders. Given the high complexity of the performance metrics for
assessing SMARTech circularity, the adaptation of the methods for
resource recovery was applied. Specifically, the following indicators
were used to reveal the potential benefits of SMARTechs:
• Economic Indicators. Four main categories were identified to
develop the fLCC: i-project initiation and construction (CAPEX), ii-
operation and maintenance (OPEX), iii- end-life costs and iv- reve
nues from recovered resources (Abdallah et al., 2020; Corominas
et al., 2020). The analysis was performed considering only these
economic parameters that allow understanding the differences be
tween existing and WWTPs retrofitted with SMARTechs.
• Environmental Indicators. eLCA impacts categories such as global
warming potential and eutrophication (emissions of N and P in
water) were considered within the SMART-Plant project (SMART-
Plant, 2020b). However, in this study only carbon footprint (CF)
quantification (Delre et al., 2019) was considered to quantify the
environmental impacts of SMART-Plant solutions as the technologies
were mainly designed to recover resources in an energy-efficient way
A. Foglia et al.
3. Journal of Cleaner Production 322 (2021) 129048
3
with low greenhouse gases (GHG) emissions. Eutrophication was not
considered since the quality of the effluent in different SMARTechs
scenarios do not change significantly compared to the baseline sce
nario. In addition, mineral depletion reduction (MDred) (Pradel et al.,
2021) was taken into account since N–P recovered resources due to
SMARTechs considerably reduce the impacts of mineral resources
extraction.
• Social Indicators. For the social assessment, the methodology pro
posed within the UNEP Guidelines for S-LCA of Products (Andrews
et al., 2009) was adapted to consider all relevant categories. Since
many of the suggested sub-categories were not relevant or assessable
in the context of this study (e.g. discrimination, consumer privacy,
cultural heritage, delocalization, corruption etc.), a modified list of
indicator for the subcategories was proposed.
2.4. Cost Benefit Analysis
The identified parameters for the analysis quantify both direct and
indirect impacts of the technology in different aspects (e.g. economic,
social and environmental) (McLiesh, 2017). Monetization methods were
used to transform both environmental and social impacts into values
expressed in euro (Molinos-Senante et al., 2012). Main internal costs (C)
and monetized benefits (B) were identified and calculated for each
scenario.
For internal costs (C), the economic evaluation was addressed ac
cording to the ISO 15686 and the Report of the European Commission -
DG Regional and Urban Policy “GPP criteria wastewater infrastructure”
(European Commission, 2012). The system boundary of each scenario
included: 1) existing WWTP, 2) SMARTechs, 3) disposal of sewage
sludge, 4) downstream processing of the intermediate materials into
valuable end-products, 5) valorisation of end products in form of credits
accounted for the substitution of primary products and 6) electricity,
fuels, chemicals required for operation of the system. The cost calcula
tions in fLCC were taken from SMART-Plant (2020a), which is publicly
available. Specifically, considered costs categories were CAPEX (e.g.
investment for windrows construction, piping, equipment, engineering,
civil works), OPEX (e.g. personnel, insurance, energy, waste disposal,
chemicals, maintenance for consumables), divestment cost and revenues
from recovered resources. Therefore, “avoided costs” associated with
both resource recovery and waste production were considered.
The full life cycle costs for the target scenarios were thus calculated
using the equation (1).
LCCPLANT = CAPEXPLANT + Divestment + OPEXPLANT ∙ Lifetime =
CAPEXPLANT ∙ 110% + OPEXPLANT ∙ Lifetime (1)
The divestment costs were considered to account for 10% of the
capital expenditure. The total operational costs contribute to the plant
life cycle costing during the entire lifetime. Moreover, additional
Table 1
Overview of the SMARTechs, final products recovered/produced and side stream benefits.
SMARTech Description Advantages Recovery Features Location References
1 Dynamic rotating belt filter Reduction of sewage sludge
volume (up to 10%);
Reduction of WWTP energy
consumption (up to 20%);
400 kg/d of pure marketable
cellulose;
Geestmerambacht
WWTP (Netherlands)
Crutchik et al. (2018)
2a Innovative anaerobic biofilter Reduction of the organic
load to the biological stage;
Reduction of sludge
production (<20%) and
energy consumption (up to
5–6%);
Increase of the WWTP biogas
production (up to 15–25%);
Karmiel WWTP (Israel) Sabbah et al. (2019)
2b Mainstream SCEPPHAR (Short-Cut
Enhanced Phosphorus and
Polyhydroxyalkanoate Recovery)
Removal up to 86% of N; Recovery of phosphorus up to
45%;
Production of PHA-rich sludge
(up to 30% PHA in sludge);
Manresa WWTP
(Spain)
Larriba et al. (2020)
3 Ion Exchange tertiary treatment Removal and recovery of
nutrients (up to 85% of NH4
and 95% of P);
Reduction of energy
requirement (38%);
Reduction of GHGs
emissions up to 10–20%;
Recovery of calcium
phosphate salts up to 3.4 ton/
year;
Cranfield WWTP
(United Kingdom)
Guida et al. (2021)
4a SCENA (Short-Cut Enhanced Nutrients
Abatement)
Nutrients removals
(averagely equal to 78–80%
for both N and P);
Production of P-rich sludge
equal to 0.8–1 kg P/(PE⋅year);
Production of VFAs (0.9
kgCOD_VFA/(PE⋅year);
Carbonera WWTP
(Italy)
(Longo et al., 2017)(
Frison et al., 2013)
4b Thermal hydrolysis (THP) coupled with
SCENA
Removal of high fractions of
both N (>75%) and N–NH4
(>90%);
Psyttalia WWTP
(Greece)
Noutsopoulos et al.
(2018)
5 Sidestream SCEPPHAR Removal of nutrients via
nitritation up 80–90%,
NO2–N/NOx-N ratio >99%;
Reduction of energy
requirements for sidestream
treatment;
Production of PHA-rich sludge
(40–45 PHA%DM, and
recovery of 1.0–1.2 kgPHA/
(PE⋅year);
Recovery of Struvite;
Carbonera WWTP
(Italy)
Conca et al. (2020)
Downstream
A
Bio-composites production - Bio-composites production
(220–280 kg/h) from
recovered cellulose or
bioplastic (PHA)
United Kingdom Zhou et al. (2021)
Downstream
B
Advanced biodrying and composting
process
Recovery of both energy and
nutrients;
Recovery of biomass fuels LCV
12 MJ/kg with average
moisture content of 23–40%;
Recovery of stabilized
biofertilizer with N and P
content up to 5% DM;
Spain (Guerra-gorostegi et al.,
2021)(González et al.,
2019)
A. Foglia et al.
4. Journal of Cleaner Production 322 (2021) 129048
4
operational costs (OPEXSMART), such as personnel, chemicals, utilities,
sludge treatment and maintenance due to the adoption of SMARTechs
were accounted and revenue streams from recovered resources (Rev
enueSMART) were considered and subtracted from the fLCC throughout
the entire lifetime. The final LCC calculation including SMARTech
implementation can be expressed as reported in equation (2).
LCCSMART = LCCPLANT + CAPEXSMART ∙ 110% - [RevenueSMART -
OPEXSMART] ∙ Lifetime (2)
Where:
RevenueSMART - OPEXSMART = BenefitsSMART (3)
Thus, the life cycle costing of SMART-Plants considered the fLCC of
the WWTP plus the capital expenditure to build and decommission the
SMARTech minus the economic benefits during lifetime of the plant. The
savings in life cycle costs were then calculated according to equation (4).
LCCSAVINGS = 1 – LCCSMART/LCCPLANT (4)
If LCCSAVINGS is a positive value, the SMARTech have a positive
economic impact in its lifetime.
On the other hand, main social and environmental monetized ben
efits (B) due to SMARTechs implementation included: B1) New Em
ployments, B2) Carbon footprint reduction and B3) Mineral depletion
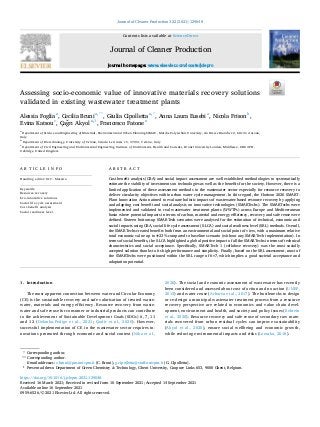
Fig. 1. SMARTechs layouts; developed and demonstrated within the SMART-Plant Project. : SMART-Product : Energy recovery/savings : Sludge pro
duction reduction : Nutrients recovery : GHGs emission reduction; SBR = Sequencing batch reactor.
A. Foglia et al.
5. Journal of Cleaner Production 322 (2021) 129048
5
reduction.
B1. New Employments, NE [€]
The quantification of the NE for each SMARTech was evaluated
considering the number of full-time equivalent (FTE) with the equation
(5) and with the monetization method reported in equation (6).
FTE = a⋅PEb
(5)
NE = FTE⋅
Market Wage
FTE
(6)
Where:
PE = people equivalent, [n◦
]
a, b = coefficients of the exponential correlation between the overall
capacity (PE)
Market Wage = cost for single FTE.
Specifically, data “a” and “b” used for the FTE calculation derive
from the business model analysis delivered within the H2020 Smart-
Plant project in relation with the capacity of the WWTP. The associ
ated data are summarized in Table 3.
Concerning the costs associated to NE, the “NATIONAL TOMs
Framework” of 2018 was used to evaluate the social value of a new
employment. According to the report, the market wage is equal to
28,213 £ corresponding to 32,893 € per single Full-Time Equivalent
(FTE) (“Social Value Portal, 2021). The personnel category includes not
only workers with technical expertise (e.g. engineers or technicians), but
also personnel working on sales, marketing and logistics.
B2. Carbon footprint reduction, CFred [€]
CFred was quantified using the calculated value of the avoided
emissions of CO2 equivalent (e.g. CH4, N2O and CO2) of the processes in
SMARTechs. The data were obtained from the eLCA analysis delivered
for each WWTP when a specific SMARTech is implemented and from
real measurements data (SMART-Plant, 2020b). The CFred in each sce
nario with SMARTech implementation in comparison to the baseline
scenario (without any SMARTech) are summarized in Table 4.
To express the CFred from an economic point of view, the emissions
were evaluated by using the shadow price of CO2 equivalent, as ac
cording to the “Guide to Cost-Benefit Analysis of Investment Projects”
(European Commission, 2014). Specifically, a value of 25 €/ton CO2eq
in 2010 was used as reference together with an annual increase of 1
€/ton CO2eq until 2030.
Since 25 years-period was considered staring in 2020, a total CO2eq
of up to 60 €/ton was used for the CBA, according to European Com
mission (2014). This value is in line with the “EU ETS Carbon market
price” which is expected to reach values up to 32–65 €/ton CO2eq in
2030 (Argus, 2020). Moreover, since no relevant differences between
GHG emissions in Europe were detected, the same unit cost was applied
to all countries in the scenarios. Thus, for the calculation of CFred, the
equation (7) was used.
CFred = PCO2
⋅GWP⋅PE (7)
Where:
PCO2
= price of the CO2, [ €
ton CO2
]
GWP = Global Warming Potential per PE and per year, [ton CO2
PE⋅y ]
B3. Mineral depletion reduction, MDred [€]
MDred was considered on the reduction of mineral resources
extraction (in terms of P and N) for each scenario with SMARTech
implementation in comparison to the baseline scenario. SMARTechs and
recovered mineral resources (containing N and P) are reported in
Table 5 (SMART-Plant, 2020c).
To express the MDred from a monetary point of view, the Hotelling
rules were used. This method provides a corrected “socially optimal”
price of depletion, that is higher than the market price. In particular, the
method allows to calculate the social cost of resource exhaustion, which
is applicable in CBA, starting from the market price (Huppertz et al.,
2019). The depletion time considered in the methodology are equal to
309 and 100 years for P and N, respectively. The monetization for this
specific study was calculated using a cost increment (%) for a depletion
time of 25 years, corresponding to the lifetime used in the whole
assessment. The resulting externality costs of depletion of N and P, that
should be added to the market prices of the resources, to obtain the
social prices, are reported in Table 6.
Since the market prices of N and P-rich recovered resources were
already considered in the LCC calculation (BenefitsSMART category), the
cost of depletion included only the social value of the avoided extraction
of minerals. Finally, all the monetized benefits considered in CBA (NE,
CFred and MDred) were considered equal to 0 in the baseline scenario.
As a result, Total Economic Value (TEV) of each SMARTech was deliv
ered and used to compare the effect of the innovative solutions imple
mentation in the scenarios. Therefore, TEV was quantified for each
Table 2
Scenario configurations based on the implementation of SMARTechs in different
countries and WWTPs with varying plant capacities.
Scenario SMARTech Country Plant capacity (PE)
S-1 1 Spain 1,612,800
G-1 1 Germany 1,000,000
I-2a 2a Israel 250,000
S-2b 2b Spain 196,167
S-3 3 Spain 1,612,800
G-3 3 Germany 1,000,000
It-4a/b 4a/b Italy 50,000
G-4a/b 4a/b Germany 1,000,000
It-5 5 Italy 50,000
G-5 5 Germany 1,000,000
1þDB1 1+DownstreamB - 50,000
1þDB2 1+DownstreamB - 100,000
1þDB3 1+DownstreamB - 250,000
4aþDB1 4a+DownstreamB - 50,000
4aþDB2 4a+DownstreamB - 100,000
4aþDB3 4a+DownstreamB - 250,000
Table 3
a and b parameters for NE calculation.
SMARTech 1 2a 2b 3 4a/b 5
A 1.70∙10− 03
8.00∙10 − 04
6.00∙10 − 04
3.00∙10 − 04
7.50∙10 − 03
3.70∙10 − 03
B 0.69 0.66 0.69 0.69 0.53 0.62
Table 4
Carbon footprint reduction for the different SMARTechs.
Location Spain case
1 (S-
1;1+DB)
Israel
(I-2a)
Spain
case 2
(S-2b)
Spain
case 1
(S-3)
Italy (It-
4a/
b;4a+DB)
Italy
(It-5)
SMARTech 1 2a 2b 3 4a/b 5
kg CO2eq/
PE.
y
− 3 − 8 − 2.7 − 18 +0.5 − 3.1
A. Foglia et al.
6. Journal of Cleaner Production 322 (2021) 129048
6
scenario using the equation (8).
TEV =
∑
t
0
B − C
(1 + r)t (8)
Where:
t = period of analysis, [years]
r = social discount rate, [%/100]
A social discount rate of 5% was applied as according to the Euro
pean Commission Guide (2014) for projects related to water sector.
Moreover, a period (t) of 25 years was used in accordance with the
European Commission (2019).
Finally, the TEV results with SMARTech implementations were
compared to the related TEV without SMARTechs (baseline scenario) to
highlight the potential benefits resulted from the proposed solutions.
The results are expressed as relative TEV increase/decrease (positive/
negative percentage) referred to SMARTech application, with respect to
the TEV of the baseline scenario.
2.5. Social-life cycle assessment
S-LCA was conducted to assess the potential impacts of SMARTechs
from the point of view of different stakeholders. This assessment aimed
at highlighting the social development outcomes (both positive and
negative) for the community (Benoît et al., 2010; Vanclay et al., 2015),
as the end user of the recovered products. A stakeholder analysis and
identification of social indicators was performed for the S-LCA of each
scenario. The approach used for S-LCA was based on the UNEP Guide
lines for Social Life Cycle Assessment of Products (Andrews et al., 2009).
The methodology takes into consideration the scope of the study and
five main stakeholders groups (i.e., workers, city/society, value chain
actors, consumers and water utilities). Furthermore, social indicator
subcategories were developed for each group (Table 7).
For each indicator, a value estimation from 1 to 5 was assigned,
where globally 1 represents the lowest score, while 5 the highest value.
However, it must be noted that some exceptions were made for the
workers. In fact for training, operative risks, working hours and exper
tise, it was considered that the more resource is required for managing
the SMARTech, the less social acceptance the solution could have, as it
could be seen as not so easy to handle.
Based on the social matrix co-created with relevant stakeholders and
accompanied with selected social indicators, questionnaires were
developed and sent to both SMART-Plant partners and SMARTech
technology providers (for a total number of 15 surveys) to provide a
value estimation of the innovative solutions. Specifically, questionnaires
were structured in two sections for social and technical indicators. In the
social section, 14 indicators were identified with a score ranging from 1
to 5.
Based on the study of Cornejo et al. (2019), a technical section was
developed to obtain data in terms of resilience, sustainability, scalabil
ity, and ease of SMARTechs implementation in order to evaluate the
marketability of the innovative technologies. This section included five
technical indicators and the related scores (from 1 to 5) to technically
evaluate the innovative solutions. The data collected from the survey
were summarized and displayed in radar graphs where average scores
were reported for each SMARTech. Moreover, a final evaluation for each
SMARTech was provided considering the sum of all the scores for each
SMARTech for all the stakeholder groups.
2.6. Social readiness level of SMARTechs
The results of the S-LCA were used to deliver the SRL of each
SMARTech and related SMART-Products. The methodology was devel
oped according to the Danish Innovation Funds to assess the level of
social adaptation of the innovative technologies (Danish Innovation
Fund, 2019).
Hence, the SRL was determined according to the following scale:
• 1≤SRL≤2: Possible changes definition for new technologies to solve
identified issues
• 2<SRL≤3: Recommendation of the solution to address the identified
issue and model validation
• 3<SRL≤4: Definition of the potential impact, expected SRL and main
stakeholders involved in the technology
Table 5
SMARTechs and related recovered mineral resources in kg/m3
.
SMARTech 1 2a 2b 3 4a/b 5 4a+B
Struvite - - 0.02 - - 7.2 -
Ammonium sulphate as N - - - 0.02 - - -
Calcium phosphate as P - - - 0.003 - - -
P-rich matrices - - - - 3 - 6
Table 6
Cost of mineral depletion (Huppertz et al., 2019).
Resources Deplention
time
Market
price
Cost
increment
Cost of depletion in
25 years
- Years € (2017)/
kg
% €/kg
Phosphorous 309 0.07 61% 0.003
Nitrogen 100 0.48 50% 0.06
Table 7
Stakeholders and social indicators for S-LCA.
Stakeholder Social indicators Definition
Workers Training Level of training required to accomplish a
particular job or activity
Operative risks Risk of new diseases
Working hours Time dedicated for a specific activity
Expertise Level of skills and/or practices required to
accomplish a particular job or activity
New jobs Expectation for new employments
City/society Public participation Interaction between government and
citizens
Sustainable
behaviour
Sustainable solutions for problems of the
society
Social acceptance Level of acceptance for innovative
technologies and products by society
Value chain
actors
Fair competition Competitive price, quality and customer
services for new products
Supplier
relationship
Level of interaction between companies
that supply your business
Promoting social
responsibility
Level of actions required to balance with
economy and ecosystems
Consumers Health and safety Level of prevention required to cope with
accident or injury
Demand satisfaction Level of customers satisfaction
Social acceptance Level of acceptance for innovative
technologies and products by citizens
Stakeholder Technical
indicators
Definition
Water
Utilities
Resilience Capacity of the innovative technologies to
meet country by country regulations
Replicability under a wide range of
climate conditions
Performance in response to stress tests
involving standardized shock or
intermittent load
Scalability Capacity to mitigate the effect of the scale
(laboratory, pilot and full scale)
Integration Level of readiness to interact or compete
with other technologies
A. Foglia et al.
7. Journal of Cleaner Production 322 (2021) 129048
7
• 4<SRL≤5: Preliminary tests of the solution with lab units analysing
technical and social aspects
• 5<SRL≤6: Validation through pilot experimental tests in relevant
environment and demonstration of positive change
• 6<SRL≤7: Validation of the solution in relevant environment and
societal context
• 7<SRL≤8: Identification of strategies for societal adaptation
• 8<SRL≤9: Solution validated in relevant environment within the
normal practice/life/society.
The evaluation of the SRL was carried out for each SMARTech by
proportionally scaling the total scores collected from the questionnaires
in relation to the SRL scale according to Equation (9) below.
SRL =
∑i
1OS
∑i
1MS
⋅MSRL (9)
Where:
i = 19, total number of social indicators considered in the
questionnaire
OS = total score from surveys, evaluation
MS = total maximum achievable score equal to 95
MSRL = SRL maximum value equal to 9
3. Results and discussion
3.1. Cost Benefit Analysis
The SMARTechs and recovered materials show a wide range of po
tential improvement, ranging from savings in the lower percentage
range for sidestream SMARTechs (e.g., SCENA and SCEPPHAR) up to
significant improvements for mainline SMARTech 1 and 2a addressing
cellulose and biogas recovery, respectively. For all SMARTechs, these
savings are related not only to the credits for recovered materials, but
also and often predominantly to operational savings at the WWTP such
as reduced aeration energy, less chemicals, or a lower sludge amount to
be disposed. Most SMARTechs are applicable to existing plants with a
very low CAPEX investment (2–35 €/PE) and with extremely short
payback time of 2–8 years. The investment cost corresponds to less than
10% of the total CAPEX of the plant. Although some CAPEX values (i.e.
SMARTech 1 and SMARTech 3) are higher than that of other SMAR
Techs, the CAPEX values are still quite relevant and the OPEX optimi
zation can have an immediate impact on the economic sustainability.
Specifically, the main OPEX savings (0.5–0.7 €/PE.
year) come from
sludge reduction (10–40% of the total OPEX) and reduction in energy
consumption (10–25% of the total OPEX). The contingent cost of sludge
disposal and energy is a strong driver for adopting SMARTechs due to
impact on OPEX savings realized through the technologies. Additional
revenues (in the range of 0.7–4 €/PE.
year) include the sale of recovered
resources, offsetting additional OPEX, and adding profitability for top
performers (SMART-Plant, 2020d).
Based on the real CAPEX and OPEX observed within the SMARTechs
validation, the impact on water tariff was also considered and consoli
dated, together with the benefit for the water utilities. From the simu
lation of the impact on tariff plans, the introduction of SMARTechs is
always positive and can be used to cover CAPEX. When the water utility
(municipal wastewater service operator) can sell the recovered re
sources derived from SMARTech, the internal rate of return of the in
vestment further increases from a minimum of 0.03% to a maximum of
13.04%. These results do not consider the additional advantages that the
water utilities could achieve as a result of sharing the reduction of
electrical energy consumption, which involve as awards and penalties
related to the achievement of technical quality standards.
The results showed that material recovery can lead to remarkable
environmental benefits for WWTP operation if assessed over the entire
value chain, such as the valorisation of valuable end-products. More
over, efforts for wastewater treatment in terms of primary energy de
mand and related GHG emissions can be reduced without compromising
the treatment quality of the plants. Depending on the SMARTech and
material recovered, up to 68% of primary energy demand and 71% of
GHG emissions could be mitigated by the integration of material re
covery at a municipal WWTP. Direct emission of GHGs at WWTPs such
as N2O and CH4 are a relevant contribution for the overall GHG footprint
and should not be increased at all by processes for material recovery.
Otherwise, potential life-cycle benefits from reduced energy consump
tion are easily off-set by increased direct emissions of GHGs and will
then lead to an overall increase in the impact of WWTPs on climate
change. This is especially important for short-cut nitrogen removal
processes prone to increased N2O emissions (SCENA, SCEPPHAR) and
anaerobic processes releasing CH4 to atmosphere (anaerobic biofilter).
The CBA results are given in Table 8. An overall increase in benefits
was obtained in all SMARTechs and in most majority of the scenarios.
Economic benefits increased along with the capacity of the plant (PE)
and with the number of applied SMARTechs. The best TEV (compared to
baseline scenario) was achieved when SMARTech 1 with Biodrying unit
(scenario 1+DB3) was applied. In this case, an increment up to +23% of
the TEV was estimated with SMARTech1 compared to TEV of the
baseline scenario. Specifically, in scenario 1+DB3, a CFred of 4838
CO2eq/y was estimated together with cost savings equal to 36,250,000
€. Scenario I-2a did not show any increase in TEV due to the higher
capital costs for the SMARTech in the Israelian WWTP. However, ben
efits were detected in terms of NE and CFred. Similarly, both scenarios It-
4a/b and G-4a/b did not bring any affirmation in terms of TEV. This was
due to the high N2O emission factor of SMARTech 4a, which resulted in a
negative value (i.e. expenses) of B2 parameter (CFred) in CBA analysis. In
SMARTech 4a coupled with composting process (Scenario 4a+DB1,
4a+DB2 and 4a+DB3), it has to be noticed that when the capacity of the
plant increased, a slight increment in TEV (from 10 to 12%) was ob
tained compared to the baseline scenario. Same considerations can be
done for scenarios 1+DB1, 1+DB2 and 1+DB3 (SMARTech 1) as the
benefits were highlighted for both NE, CFred and LCC indicators.
Moreover, the impact of MDred on TEV was only apparent in scenarios S-
3 and It-5 due to high levels of nutrient recoveries in these SMARTech
applications (i.e. nutrient recovery via ion-exchange in SMARTech 3 and
struvite recovery in SMARTech 5). In the study of Lin et al. (2016), ion
exchange was also found to hold a great potential to achieve high N
removal efficiencies and deliver economically and environmentally
optimal performance when process design and optimization is achieved
due to its excess chemical consumption. In fact, in another study (Duan
et al., 2019), ion exchange contributed to over 50% of the total costs in P
removal pathways over a 20-year plant lifespan. Although nutrient re
covery makes limited contributions, recovery is needed for other aspects
considering that P is a critically limiting source (Hao et al., 2019).
Overall, the costs derived from fLCC represent the highest contribution
to the TEV determination. As a consequence, despite a remarkable
variation (±50%) of the considered main environmental categories (e.g.
CFred and MDred), TEV changes (from 0.1 to 6% for CF and from 0.1 to
1.8% for MD) were not relevant.
According to the survey of Coats and Wilson (2017) where front-line
principal actors (decision makers; advisors) were the main target audi
ence on a local-level, economics was viewed as the primary barrier to the
implementation of the wastewater-based resource recovery. In this re
gard, utilizing business case evaluations was proposed as a pathway to
the successful realization of resource recovery technologies at large
scale. A resource recovery-based assessment by Hao et al. (2019)
revealed that common reclaimed water reuse practise in WWTPs is
insufficient and resource/energy recovery is essential to achieve a
net-zero impact or even benefit on the total environment. In most cases,
greatest environmental and economic benefits are obtained via energy
recovery since carbon emissions are omitted from fossil fuel consump
tion. Although CBA is an established technique to assess such systems in
A. Foglia et al.
8. Journal of Cleaner Production 322 (2021) 129048
8
monetary terms, it may also biased toward decision makers since it ig
nores intangible social dynamics (Lazurko, 2018). At this point,
socio-ecological impacts and values of resource recovery and manage
ment should be well-defined and analysed together with environmental
and economic benefits in the framework of sustainable livelihoods.
3.2. Social-life cycle assessment
Mixed methods and participatory approaches such as focus groups
with local stakeholders are necessary to understand complex impacts of
wastewater-based resource recovery technologies and to identify local
conceptions, criteria, and indicators of living well (King et al., 2014).
The results of the S-LCA survey on SMARTechs, grouped by stakeholder
category, are shown in Fig. 2. Overall, all the SMARTechs had a score
higher than 1.5, and the maximum value of 4.5 was achieved in
SMARTech 1 and in SMARTech 4a. All the SMARTechs were positively
evaluated from the water utilities. Downstream A and SMARTech 4a
gained the highest scores, averagely equal to 4 ± 0.3 and 3.9 ± 0.5,
respectively, mainly thanks to the good scalability of the technologies.
Moreover, Downstream A was found to be applicable under a wide range
of climate conditions while SMARTech 4a can be easily integrated into
the existing WWTP. The lowest score was assigned to SMARTech 2b,
likely due to its low level of adaptability to shock operative conditions or
intermittent loads. Regarding the value chain actors, SMARTechs with
the highest scores were Downstream B, SMARTech 1 and Downstream A
with 3.8 ± 0.2, 3.8 ± 0.1 and 3.8 ± 0.4, respectively. For these cases,
strong relationships were identified between suppliers and end-users
when fertilizer, cellulose and biocomposites are recovered/produced.
Wastewater/sludge based recovered materials from SMARTechs may
contain potentially hazardous substances in organic or inorganic form.
Hence, a safe use of these products is a prerequisite for their public
acceptance as well as for their legal conformity. Therefore, a product
quality check is important in terms of contamination and a following
risk assessment to evaluate their safety to enable safe and sustainable
use of these products for both human health and ecosystems. This is
especially viable for nutrient products and fertilizers which are directly
applied into ecosystems and may affect the quality of produced food and
thus human health through food consumption. However, other materials
such as bioplastic or cellulose may also pose risks in their use due to
direct contact with human skin or leaching of contaminants (e.g., the
reluctance of operators may occur due to odour during manufacturing in
hands-on production lines).
From the workers/employees point of view, SMARTech 1 obtained
the highest score among all the technologies analysed, with an average
score of 3.4 ± 0.2 and a maximum value of 3.6 for both operative risks
and working hours. This was due to the perception that these stake
holders had on both the low risk for personnel and low necessary
working hours associated with the SMARTech 1. Moreover, SMARTech
4a and Downstream B were positively assessed achieving average scores
equal to 3.3 ± 0.4 and 3.3 ± 0.4, respectively. Specifically, the highest
score of 3.8 was gained thanks to the low operative risks, compared to
already marketed technologies. SMARTech 2b and SMARTech 5 ob
tained the lowest scores; averagely 2.4 ± 0.8 and 2.6 ± 0.6, respectively,
due to the evaluation of employees regarding expertise and trainings
required to operate the technologies. In terms of the creation of new
jobs, most of the SMARTechs had a score higher than 1.5 with a
maximum value of 3.4. Concerning the society criterion, SMARTech 1
and 2a obtained the highest values averagely 3.7 ± 0.8 and 3.7 ± 1,
respectively. This result was mainly due to the sustainability aspect in
solving society problems for SMARTech 1, while the social acceptance
was the main driver for the high score of SMARTech 2a. Finally,
regarding consumers, the highest scores were obtained for SMARTech
2a and Downstream A and B. For these technologies, the average scores
were 3.9 ± 0.3, 3.8 ± 0.4 and 3.8 ± 0.2, respectively. This can be
explained by the fact that SMARTech 2a obtained the maximum score
for social acceptance, while Downstream A and B reached the best score
Table 8
Results of CBA for the different scenario and comparison of CBA with and without SMARTech implementation in WWTPs.
Scenario SMARTech fLCC NE CFred MDred CBA comparison (Y and N SMARTech)
Y/N C (€) B1 (€) B2 (€) B3 (€) TEV (%)
S-1 SMARTech 1 - Spain N 415,134,720 0 0 0 21%
Y 338,059,008 1,177,979 7,257,600 0
G-1 SMARTech 1 - Germany N 762,000,000 0 0 0 11%
Y 684,050,000 844,418 4,500,000 0
I-2◦
Smartech 2a - Israel N 143,077,500 0 0 0 0%
Y 146,342,500 97,086 3,000,000 0
S-2b Smartech 2b - Spain N 45,687,294 0 0 0 16%
Y 39,417,797 95,846 794,476 45,499
S-3 SMARTech 3 - Spain N 415,134,720 0 0 0 20%
Y 383,265,792 207,879 43,545,600 5,856,226
G-3 SMARTech 3 - Germany N 762,000,000 0 0 0 18%
Y 655,050,000 149,015 27,000,000 3,631,092
It-4a/b SMARTech 4a/b - Italy N 15,992,500 0 0 0 0%
Y 16,071,500 79,263 − 37,500 0
G-4a/b SMARTech 4a/b - Germany N 762,000,000 0 0 0 − 1%
Y 765,680,000 391,895 − 750,000 75,658
It-5 SMARTech 5 - Italy N 15,992,500 0 0 0 10%
Y 14,814,000 98,622 232,500 9905
G-5 SMARTech 5 - Germany N 762,000,000 0 0 0 4%
Y 736,100,000 629,956 4,650,000 198,101
1+DB1 SMARTech 1+ Biodrying unit N 39,000,000 0 0 0 19%
Y 31,750,000 104,807 225,000 0
1+DB2 SMARTech 1+ Biodrying unit N 67,500,000 0 0 0 22%
Y 53,500,000 169,847 450,000 0
1+DB3 SMARTech 1+ Biodrying unit N 163,250,000 0 0 0 23%
Y 127,000,000 321,531 1,125,000 0
4a+DB1 SMARTech 4a+ Composting unit N 39,000,000 0 0 0 10%
Y 35,000,000 79,263 − 37,500 7566
4a+DB2 SMARTech 4a+ Composting unit N 67,500,000 0 0 0 11%
Y 60,000,000 114,728 − 75,000 15,132
4a+DB3 SMARTech 4a+ Composting unit N 163,250,000 0 0 0 12%
Y 143,750,000 187,056 − 187,500 37,829
A. Foglia et al.
9. Journal of Cleaner Production 322 (2021) 129048
9
Fig. 2. The results of the questionnaires for S-LCA on SMARTechs, clusterized for stakeholder category: a) Water utilities, b) Value chain actors, c) Workers d) City/
Society and e) Consumers.
Fig. 3. Final social evaluation of the SMARTech solutions.
A. Foglia et al.
10. Journal of Cleaner Production 322 (2021) 129048
10
in technology healthy and safety category. A summary of the overall
scores obtained for SMARTechs is given in Fig. 3, where the dark green
cells represent the highest score, the light green ones the second-best
score, the orange ones the third best score and finally the yellow cells
show the worst ranked SMARTech.
SMARTech 1 gained the best results thanks to its ease of operation
and sustainability performance. Downstream A and B obtained good
results in terms of scalability potential and capacity to balance the
economic growth with environmental preservation. Finally, SMARTech
2b achieved the worst evaluation mainly due to its complexity (e.g. 1.8
for training and 1.5 for expertise) and limited adaptability to different
operative conditions (e.g. 2.6 for both climate and load change resil
ience).Whereas the niche markets still represent the majority of appli
cations for recovered materials and products, these solutions can be
more competitive only by raising social awareness on the environmental
benefits (e.g., lower CF). Moreover, the suppliers and end-users might be
the same water utility in some cases (or anyway the public service
(multi)utility). In such cases, the loops will be closed optimally.
3.3. Social readiness level
The SRL ranking can help to understand whether the proposed
technology is adaptable to social innovation in the operating field. The
SRL results for SMARTechs are given in Table 9.
The majority of the SMARTechs fell within the SRL range 6–7, which
means that the proposed solutions were demonstrated in real environ
ment with no relevant societal barriers for transition towards societal
adaptation. This implies a good social acceptance and capacity of the
SMARTechs for environmental adaptation. However, relatively low SRL
results (class 5–6) were observed for SMARTech 2b and 5, despite their
validation in real environment. Social acceptance associated to em
ployees training and high expertise needed to manage the SMARTech
are the main factors for the low SRL scores.
Public acceptance is one of the main bottlenecks in wastewater-based
resource recovery (Kehrein et al., 2020), and the ease of communica
tion/perception of different technologies has a big impact on their social
acceptance. For instance, the acceptance of cellulose recovered was an
added value for SMARTech 1. The cellulosic sludge recovered from
Geestmerambacht WWTP (CirTec, The Netherlands) is used as a raw
material to replace the wood flour in wood plastic composites to develop
cellulose-based plastic composites. From an economic value perfor
mance, the production cost of cellulose-based plastic composite is
significantly lower than the respective one of wood-based (approxi
mately 15%) because of the lower price of the cellulosic sludge. This
application on one hand points to an innovative way to achieve valor
isation of the recovered resource from WWTPs. On the other hand, it
provides a promising solution to improve the sustainability of composite
industry by reducing its environmental impact and manufacturing costs,
alleviating resource competition with other industrial sectors.
Tsalidis et al., (2020) performed S-LCA of brine treatment and re
covery technology. Their site-specific results showed that the overall
social sustainability performance was good with the indicators of “Labor
rights and decent work” and “Health and safety” resulting in the largest
impacts due to imports of commodities from developing countries. In
another study, Prouty et al. (2018) proposed a theory-inspired, com
munity-informed system dynamics model to assess the adoption and
sustainability of wastewater-based resource recovery systems using
various methods, including surveys, interviews, participatory observa
tions, and a water constituents mass balance analysis. The authors
concluded that changing community behaviour represented by struc
tural change in the model was the most important factor to influence the
sustainable management of the wastewater resources. The wastewater
sector remains challenging to be considered for its social value, and
circular wastewater management is not perceived enough. At this point,
S-LCA is a useful tool for water companies to improve social sustain
ability. On the other hand, S-LCA still needs further development to
overcome limitations due to qualitative nature of the methodology.
4. Conclusion
Unknown social acceptance and market potentials are major barriers
for effective decision-making on the wider implementation of
wastewater-based resource recovery technologies. The current work
applied CBA and S-LCA to assess the economic and social aspects of
innovative resource recovery technologies built in sixteen bottom-up
scenarios, which included the implementation (single or combined) of
different SMARTechs that had been validated in real environment. The
CBA results highlighted the global benefits of the SMARTechs both from
an environmental and social point of view. Benefit drivers for the
adoption of SMARTechs are primarily sludge treatment savings,
secondarily energy and carbon efficiency and ultimately material re
covery and reuse. Specifically, SMARTech 1 with Biodrying unit (sce
nario 1+DB3) achieved the best TEV with an increment up to +23%
compared to baseline scenario. This result was achieved thanks to both
CFred of 4838 CO2eq/y and cost savings equal to 36,250,000 €.
Comparatively worse-performing scenarios such as I-2a, It-4a/b and G-
4a/b included the implementation of SMARTech 2a in Israel, SMARTech
4a/b in Italy and SMARTech 4a/b in Germany, respectively. In these
cases, any increase in TEV was not detected due to the higher capital
costs for the SMARTechs in the WWTPs. Moreover, for SMARTech 4a/b,
the increment in CF led to a decrease in the overall CBA results. This was
due to the high N2O emission factor of SMARTech 4a, which resulted in a
negative value (i.e. expenses) of B2 parameter (CFred) in CBA. However,
benefits were detected in terms of NE and CFred for the scenario I-2a. In
addition, the contribution derived from MDred to TEV was remarkable
only in scenarios S-3 and It-5 where nutrient recovery via ion-exchange
and struvite recovery were deployed, respectively. The S-LCA high
lighted a positive result of all the SMARTechs regarding both technical
performance and social acceptance. SMARTech 1 (cellulose recovery)
was found to be the most accepted solution thanks to its performance
and simplicity, while SMARTech 2b (SCEPPHAR process) obtained the
worst evaluation due to its complexity and adaptability to different
operative conditions. Moreover, most of the SMARTechs exhibited a
good societal acceptance and adaptation.
CRediT authorship contribution statement
Alessia Foglia: Investigation, Data curation, Methodology, Soft
ware, Formal analysis. Cecilia Bruni: Investigation, Data curation,
Methodology, Formal analysis, Software. Giulia Cipolletta: Investiga
tion, Methodology, Software, Formal analysis, Writing – original draft.
Anna Laura Eusebi: Conceptualization, Supervision. Nicola Frison:
Conceptualization, Methodology, Validation. Evina Katsou: Software,
Supervision, Writing – review & editing. Çağrı Akyol: Conceptualiza
tion, Writing – original draft. Francesco Fatone: Conceptualization,
Funding acquisition, Project administration, Resources, Supervision,
Writing – review & editing.
Table 9
SRL of SMARTech solutions.
SMARTech SRL SRL range
SMARTech 1 6.6 6–7
SMARTech 2a 6.4 6–7
SMARTech 2b 5.2 5–6
SMARTech 3 6.2 6–7
SMARTech 4a 6.3 6–7
SMARTech 4b 6.1 6–7
SMARTech 5 5.8 5–6
Downstream A 6.5 6–7
Downstream B 6.5 6–7
SMARTech 4a/b + B 6.4 6–7
SMARTech 5 + A 6.1 6–7
A. Foglia et al.
11. Journal of Cleaner Production 322 (2021) 129048
11
Declaration of competing interest
The authors declare that they have no known competing financial
interests or personal relationships that could have appeared to influence
the work reported in this paper.
Acknowledgments
This work was supported by the H2020 SMART-Plant Project, “Scale-
Up of Low Carbon Footprint Material Recovery Techniques in Existing
Wastewater Treatment Plants”, which has received funding from the
European Union Horizon 2020 research and innovation program under
grant agreement n◦
690323. The authors thank to the members of the
SMART-Plant Consortium (www.smart-plant.eu) for excellent collabo
ration within the project.
Moreover, Alessia Foglia kindly acknowledges the Fondazione Car
iverona for funding her Ph.D. scholarship.
References
Abdallah, M., Shanableh, A., Elshazly, D., Feroz, S., 2020. Techno-economic and
environmental assessment of wastewater management systems: life cycle approach.
Environ. Impact Assess. Rev. 82, 106378. https://doi.org/10.1016/j.
eiar.2020.106378.
Akyol, Ç., Foglia, A., Ozbayram, E.G., Frison, N., Katsou, E., Eusebi, A.L., Fatone, F.,
2020. Validated innovative approaches for energy-efficient resource recovery and re-
use from municipal wastewater: from anaerobic treatment systems to a biorefinery
concept. Crit. Rev. Environ. Sci. Technol. 50, 869–902. https://doi.org/10.1080/
10643389.2019.1634456.
Andrews, E., Barthel, L.-P., Beck, T., Benoît, C., Ciroth, A., Cucuzzella, C., Gensch, C.-O.,
Hébert, J., Lesage, P., Manhart, A., Mazeau, P., 2009. Guidelines for Social Life Cycle
Assessment of Products. Environment, UNEP.
Arborea, S., Giannoccaro, G., de Gennaro, B.C., Iacobellis, V., Piccinni, A.F., 2017. Cost-
benefit analysis ofwastewater reuse in Puglia. Southern Italy. Water (Switzerland) 9,
1–17. https://doi.org/10.3390/w9030175.
Archimidis, G., Jorge, J., Gallart, E., Berzosa, J., Clarens, F., Harris, S., Korevaar, G.,
2020. Social life cycle assessment of brine treatment and recovery technology : a
social hotspot and site-specific evaluation. Sustain. Prod. Consum. 22, 77–87.
https://doi.org/10.1016/j.spc.2020.02.003.
Argus, 2020. URL: https://www.argusmedia.com/en/news/2142240-eu-ets-price-
3265t-under-2030-scenarios (Accessed: 02 February 2021).
Benoît, C., Norris, G.A., Valdivia, S., Ciroth, A., Moberg, A., Bos, U., Prakash, S.,
Ugaya, C., Beck, T., 2010. The guidelines for social life cycle assessment of products:
just in time! Int. J. Life Cycle Assess. 15, 156–163. https://doi.org/10.1007/s11367-
009-0147-8.
Carolus, J.F., Hanley, N., Olsen, S.B., Pedersen, S.M., 2018. A bottom-up approach to
environmental cost-benefit analysis. Ecol. Econ. 152, 282–295. https://doi.org/
10.1016/j.ecolecon.2018.06.009.
Coats, E.R., Wilson, P.I., 2017. Toward nucleating the concept of the water resource
recovery facility (WRRF): perspective from the principal actors. Environ. Sci.
Technol. 51, 4158–4164. https://doi.org/10.1021/acs.est.7b00363.
Conca, V., Ros, C., Valentino, F., Eusebi, A.L., Frison, N., Fatone, F., 2020. Long-term
validation of polyhydroxyalkanoates production potential from the sidestream of
municipal wastewater treatment plant at pilot scale. Chem. Eng. J. 124627 https://
doi.org/10.1016/j.cej.2020.124627.
Cornejo, P.K., Becker, J., Pagilla, K., Mo, W., Zhang, Q., Mihelcic, J.R., Chandran, K.,
Sturm, B., Yeh, D., Rosso, D., 2019. Sustainability metrics for assessing water
resource recovery facilities of the future. Water Environ. Res. 91, 45–53. https://doi.
org/10.2175/106143017x15131012187980.
Corominas, L., Byrne, D.M., Guest, J.S., Hospido, A., Roux, P., Shaw, A., Short, M.D.,
2020. The application of life cycle assessment (LCA) to wastewater treatment: a best
practice guide and critical review. Water Res. 184 https://doi.org/10.1016/j.
watres.2020.116058.
Crutchik, D., Frison, N., Eusebi, A.L., Fatone, F., 2018. Biorefinery of cellulosic primary
sludge towards targeted Short Chain Fatty Acids, phosphorus and methane recovery.
Water Res. 112, 112–119. https://doi.org/10.1016/j.watres.2018.02.047.
Danish Innovation Fund, 2019. Societal Readiness Levels (SRL) defined according to
Innovation Fund Denmark. URL: https://www.google.it/url?sa=t&rct=j&q=&e
src=s&source=web&cd=&ved=2ahUKEwj-gZiGwrnuAhUCt6QKHYKUBoEQFjABe
gQIBRAC&url=https%3A%2F%2Finnovationsfonden.dk%2Fsites%2Fdefault%2Ffile
s%2F2019-03%2Fsocietal_readiness_levels_-_srl.pdf&usg=AOvVaw1NYYG6Ya
_Jb1_1_HXxEd-Q (Accessed: 26 January 2021).
Da Ros, C., Conca, V., Laura, A., Frison, N., Fatone, F., 2020. Sieving of municipal
wastewater and recovery of bio-based volatile fatty acids at pilot scale. Water Res.
174, 115633. https://doi.org/10.1016/j.watres.2020.115633.
Delanka-Pedige, H.M.K., Munasinghe-Arachchige, S.P., Abeysiriwardana-Arachchige, I.S.
A., Nirmalakhandan, N., 2021. Wastewater infrastructure for sustainable cities:
assessment based on UN sustainable development goals (SDGs). Int. J. Sustain. Dev.
World Ecol. 28, 203–209. https://doi.org/10.1080/13504509.2020.1795006.
Delre, A., ten Hoeve, M., Scheutz, C., 2019. Site-specific carbon footprints of
Scandinavian wastewater treatment plants, using the life cycle assessment approach.
J. Clean. Prod. 211, 1001–1014. https://doi.org/10.1016/j.jclepro.2018.11.200.
Diaz-Elsayed, N., Rezaei, N., Ndiaye, A., Zhang, Q., 2020. Trends in the environmental
and economic sustainability of wastewater-based resource recovery: a review.
J. Clean. Prod. 265, 121598. https://doi.org/10.1016/j.jclepro.2020.121598.
Duan, M., O’Dwyer, E., Stuckey, D.C., Guo, M., 2019. Wastewater to resource: design of a
sustainable phosphorus recovery system. ChemistryOpen 8, 1109–1120. https://doi.
org/10.1002/open.201900189.
European Commission, 2019. Evaluation of the Urban Waste Water Treatment Directive.
European Commission, 2014. Guide to Cost-Benefit Analysis of Investment Projects:
Economic Appraisal Tool for Cohesion Policy 2014-2020. Publications Office of the
European Union. https://doi.org/10.2776/97516.
European Commission, 2012. Gpp Criteria Waste Water Infrastructure.
Frison, N., Katsou, E., Malamis, S., Bolzonella, D., Fatone, F., 2013. Biological nutrients
removal via nitrite from the supernatant of anaerobic co-digestion using a pilot-scale
sequencing batch reactor operating under transient conditions. Chem. Eng. J. 230,
595–604. https://doi.org/10.1016/j.cej.2013.06.071.
Garcia, X., Pargament, D., 2015. Reusing wastewater to cope with water scarcity:
economic, social and environmental considerations for decision-making. Resour.
Conserv. Recycl. 101, 154–166. https://doi.org/10.1016/j.resconrec.2015.05.015.
Gigli, S., Landi, D., Germani, M., 2019. Cost-benefit analysis of a circular economy
project: a study on a recycling system for end-of-life tyres. J. Clean. Prod. 229,
680–694. https://doi.org/10.1016/j.jclepro.2019.03.223.
González, D., Colón, J., Gabriel, D., Sánchez, A., 2019. The effect of the composting time
on the gaseous emissions and the compost stability in a full-scale sewage sludge
composting plant. Sci. Total Environ. 654, 311–323. https://doi.org/10.1016/j.
scitotenv.2018.11.081.
González, X.M., Rodríguez, M., Pena-Boquete, Y., 2017. The social benefits of WEEE re-
use schemes. A cost benefit analysis for PCs in Spain. Waste Manag. 64, 202–213.
https://doi.org/10.1016/j.wasman.2017.03.009.
Goswami, R.K., Mehariya, S., Verma, P., Lavecchia, R., Zuorro, A., 2021. Microalgae-
based biorefineries for sustainable resource recovery from wastewater. J. Water
Process Eng. 40, 101747. https://doi.org/10.1016/j.jwpe.2020.101747.
Guerra-gorostegi, N., González, D., Puyuelo, B., Ovejero, J., Colón, J., Gabriel, D.,
Sánchez, A., Ponsá, S., 2021. Biomass fuel production from cellulosic sludge through
biodrying : aeration strategies , quality of end-products , gaseous emissions and
techno-economic assessment. Waste Manag. 126, 487–496. https://doi.org/
10.1016/j.wasman.2021.03.036.
Guida, S., Conzelmann, L., Remy, C., Vale, P., Jefferson, B., Soares, A., 2021. Science of
the Total Environment Resilience and life cycle assessment of ion exchange process
for ammonium removal from municipal wastewater. Sci. Total Environ. 783,
146834. https://doi.org/10.1016/j.scitotenv.2021.146834.
Hao, X., Wang, X., Liu, R., Li, S., van Loosdrecht, M.C.M., Jiang, H., 2019. Environmental
impacts of resource recovery from wastewater treatment plants. Water Res. 160,
268–277. https://doi.org/10.1016/j.watres.2019.05.068.
Huppertz, T., Weidema, B.P., Standaert, S., de Caevel, B., van Overbeke, E., 2019. The
social cost of sub-soil resource use. Resources 8. https://doi.org/10.3390/
resources8010019.
Hussain, F., Shah, S.Z., Ahmad, H., Abubshait, S.A., Abubshait, H.A., Laref, A.,
Manikandan, A., Kusuma, H.S., Iqbal, M., 2021. Microalgae an ecofriendly and
sustainable wastewater treatment option: biomass application in biofuel and bio-
fertilizer production. A review. Renew. Sustain. Energy Rev. 137, 110603. https://
doi.org/10.1016/j.rser.2020.110603.
Iofrida, N., Strano, A., Gulisano, G., De Luca, A.I., 2018. Why social life cycle assessment
is struggling in development? Int. J. Life Cycle Assess. 23, 201–203. https://doi.org/
10.1007/s11367-017-1381-0.
Karakas, I., Sam, S.B., Cetin, E., Dulekgurgen, E., Yilmaz, G., 2020. Resource recovery
from an aerobic granular sludge process treating domestic wastewater. J. Water
Process Eng. 34, 101148. https://doi.org/10.1016/j.jwpe.2020.101148.
Kehrein, P., Van Loosdrecht, M., Osseweijer, P., Garfí, M., Dewulf, J., Posada, J., 2020.
A critical review of resource recovery from municipal wastewater treatment plants-
market supply potentials, technologies and bottlenecks. Environ. Sci. Water Res.
Technol. 6, 877–910. https://doi.org/10.1039/c9ew00905a.
King, M.F., Renó, V.F., Novo, E.M.L.M., 2014. The concept, dimensions and methods of
assessment of human well-being within a socioecological context: a literature
review. Soc. Indicat. Res. 116, 681–698. https://doi.org/10.1007/s11205-013-0320-
0.
Larriba, O., Rovira-cal, E., Juznic-zonta, Z., Guisasola, A., Baeza, J.A., 2020. Evaluation
of the integration of P recovery , polyhydroxyalkanoate production and short cut
nitrogen removal in a mainstream wastewater treatment process. Water Res. 172,
115474. https://doi.org/10.1016/j.watres.2020.115474.
Lazurko, A., 2018. Assessing the value of resource recovery and reuse. In: Resource, R.
(Ed.), CGIAR Research Program on Water, Land and Ecosystems. International Water
Management Institute (IWMI).
Lin, Y., Guo, M., Shah, N., Stuckey, D.C., 2016. Economic and environmental evaluation
of nitrogen removal and recovery methods from wastewater. Bioresour. Technol.
215, 227–238. https://doi.org/10.1016/j.biortech.2016.03.064.
Longo, S., Frison, N., Renzi, D., Fatone, F., 2017. Is SCENA a good approach for side-
stream integrated treatment from an environmental and economic point of view ?
Water Res. 125, 478–489. https://doi.org/10.1016/j.watres.2017.09.006.
Longo, S., Katsou, E., Malamis, S., Frison, N., Renzi, D., Fatone, F., 2015. Recovery of
volatile fatty acids from fermentation of sewage sludge in municipal wastewater
treatment plants. Bioresour. Technol. 175, 436–444. https://doi.org/10.1016/j.
biortech.2014.09.107.
McLiesh, C., 2017. NSW Government Guide to Cost-Benefit. Analysis (TPP17-03).
A. Foglia et al.
12. Journal of Cleaner Production 322 (2021) 129048
12
Molinos-Senante, M., Garrido-Baserba, M., Reif, R., Hernández-Sancho, F., Poch, M.,
2012. Assessment of wastewater treatment plant design for small communities:
environmental and economic aspects. Sci. Total Environ. 427–428, 11–18. https://
doi.org/10.1016/j.scitotenv.2012.04.023.
Nika, C.E., Vasilaki, V., Expósito, A., Katsou, E., 2020. Water cycle and circular economy:
developing a circularity assessment framework for complex water systems. Water
Res. 187, 116423. https://doi.org/10.1016/j.watres.2020.116423.
Noutsopoulos, C., Mamais, D., Statiris, E., Lerias, E., Malamis, S., Andreadakis, A., 2018.
Reject water characterization and treatment through short-cut nitrification/
denitrification : assessing the effect of temperature and type of substrate. https://doi.
org/10.1002/jctb.5745.
Palmieri, S., Cipolletta, G., Pastore, C., Giosuè, C., Akyol, Ç., Eusebi, A.L., Frison, N.,
Tittarelli, F., Fatone, F., 2019. Pilot scale cellulose recovery from sewage sludge and
reuse in building and construction material. Waste Manag. 100 https://doi.org/
10.1016/j.wasman.2019.09.015.
Petti, L., Serreli, M., Di Cesare, S., 2018. Systematic literature review in social life cycle
assessment. Int. J. Life Cycle Assess. 23, 422–431. https://doi.org/10.1007/s11367-
016-1135-4.
Pikaar, I., Huang, X., Fatone, F., Guest, J.S., 2020. Resource recovery from water: from
concept to standard practice. Water Res. 178, 115856. https://doi.org/10.1016/j.
watres.2020.115856.
Pradel, M., Garcia, J., Vaija, M.S., 2021. A framework for good practices to assess abiotic
mineral resource depletion in Life Cycle Assessment. J. Clean. Prod. 279, 123296.
https://doi.org/10.1016/j.jclepro.2020.123296.
Prouty, C., Mohebbi, S., Zhang, Q., 2018. Socio-technical strategies and behavior change
to increase the adoption and sustainability of wastewater resource recovery systems.
Water Res. 137, 107–119. https://doi.org/10.1016/j.watres.2018.03.009.
Qadir, M., Drechsel, P., Jiménez Cisneros, B., Kim, Y., Pramanik, A., Mehta, P.,
Olaniyan, O., 2020. Global and regional potential of wastewater as a water, nutrient
and energy source. Nat. Resour. Forum 44, 40–51. https://doi.org/10.1111/1477-
8947.12187.
Sabbah, I., Dias, D.F.C., Ribeiro, J.M., Hassanin, M., Massalha, M., 2019. High Rate
Immobilized Anaerobic System Treating Wastewater- Evaluation and Simulation at a
Pilot-Scale System, vol. 1, pp. 1–3.
Shaikh, S., Thomas, K., Zuhair, S., Magalini, F., 2020. A cost-benefit analysis of the
downstream impacts of e-waste recycling in Pakistan. Waste Manag. 118, 302–312.
https://doi.org/10.1016/j.wasman.2020.08.039.
SMART-Plant, 2020a. D4.5 Socio-economic assessment including life cycle costing (LCC)
and cost benefit analysis (CBA) reports. URL: https://ec.europa.eu/research/par
ticipants/documents/downloadPublic?documentIds=080166e5cf44b308&appI
d=PPGMS.
SMART-Plant, 2020b. D4.4 environmental impact report, incl. LCA (life cycle
assessment). URL: https://ec.europa.eu/research/participants/documents/downloa
dPublic?documentIds=080166e5cfaec6f1&appId=PPGMS.
SMART-Plant, 2020c. D5.3 Scenarios for introduction of SMART-Plant technologies
(SMARTechs) and target SMART-Plant portfolio. URL: https://ec.europa.eu/r
esearch/participants/documents/downloadPublic?documentIds=080166e5cf
6140e7&appId=PPGMS.
SMART-Plant, 2020d. D5.4 Report on the consolidated SMART-plant scenarios, market
value of SMART-Product portfolio and finalized product applications. URL: https://
ec.europa.eu/research/participants/documents/downloadPublic?documentI
ds=080166e5cf630bcd&appId=PPGMS.
Smart Plant, 2021. URL. https://www.smart-plant.eu/.
Social Value Portal, 2021. URL. https://socialvalueportal.com/national-toms/. (Accessed
26 January 2021).
Tsalidis, G.A., Gallart, J.J.E., Corberá, J.B., Blanco, F.C., Harris, S., Korevaar, G., 2020.
Social life cycle assessment of brine treatment and recovery technology: A social
hotspot and site-specific evaluation. Sustain. Prod. Consum. 22, 77–87.
UNEP, 2015. Economic Valuation of Wastewater: the Cost of Action and the Cost of No
Action. United Nations Environment Programme.
Vanclay, F., Esteves, A.M., Aucamp, I., Franks, D.M., 2015. Social Impact Assessment:
guidance for assessing and managing the social impacts of projects. Int. Assoc.
Impact Assess. 1, 98.
Velenturf, A.P.M., Jopson, J.S., 2019. Making the business case for resource recovery.
Sci. Total Environ. 648, 1031–1041. https://doi.org/10.1016/j.
scitotenv.2018.08.224.
Zarei, M., 2020. Wastewater resources management for energy recovery from circular
economy perspective. Water-Energy Nexus 3, 170–185. https://doi.org/10.1016/j.
wen.2020.11.001.
Zhou, Y., Katsou, E., Fan, M., 2021. International Journal of Biological Macromolecules
Interfacial structure and property of eco-friendly carboxymethyl cellulose/poly ( 3-
hydroxybutyrate- co -3-hydroxyvalerate ) biocomposites. Int. J. Biol. Macromol. 179,
550–556. https://doi.org/10.1016/j.ijbiomac.2021.03.009.
A. Foglia et al.