Beginners Guide to TikTok for Search - Rachel Pearson - We are Tilt __ Bright...
February 2014 Housing Sales Statistics
1. Monthly Inventory AnalysisData from the The Oklahoma Association of REALTORS®
Area Delimited by Entire OK State MLS -
Single-Family Property Type
February 2014
Report Produced on: Mar 12, 2014
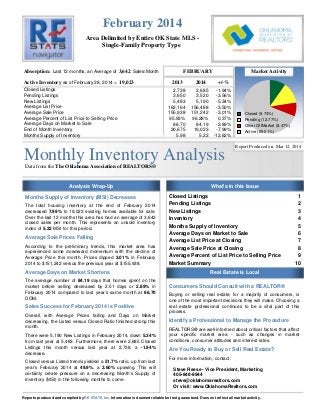
Absorption:
Active Inventory
3,642
19,023
FEBRUARY Market Activity
2013 2014 +/-%
Last 12 months, an Average of Sales/Month
as of February 28, 2014 =
Closed Listings
Pending Listings
New Listings
Average List Price
Average Sale Price
Average Percent of List Price to Selling Price
Average Days on Market to Sale
End of Month Inventory
Months Supply of Inventory
Closed Listings 1
Pending Listings 2
New Listings 3
Inventory 4
Months Supply of Inventory 5
Average Days on Market to Sale 6
Average List Price at Closing 7
Average Sale Price at Closing 8
Average Percent of List Price to Selling Price 9
Market Summary 10
2,738 2,685 -1.94%
3,650 3,520 -3.56%
5,483 5,190 -5.34%
162,164 156,488 -3.50%
155,938 151,242 -3.01%
95.93% 96.28% 0.37%
86.70 84.19 -2.89%
20,675 19,023 -7.99%
5.98 5.22 -12.62%
Analysis Wrap-Up What's in this Issue
Real Estate is Local
Closed (9.74%)
Pending (12.77%)
Other OffMarket (8.47%)
Active (69.01%)
Months Supply of Inventory (MSI) Decreases
The total housing inventory at the end of February 2014
decreased 7.99% to 19,023 existing homes available for sale.
Over the last 12 months this area has had an average of 3,642
closed sales per month. This represents an unsold inventory
index of 5.22 MSI for this period.
Average Sale Prices Falling
According to the preliminary trends, this market area has
experienced some downward momentum with the decline of
Average Price this month. Prices dipped 3.01% in February
2014 to $151,242 versus the previous year at $155,938.
Average Days on Market Shortens
The average number of 84.19 days that homes spent on the
market before selling decreased by 2.51 days or 2.89% in
February 2014 compared to last year’s same month at 86.70
DOM.
Sales Success for February 2014 is Positive
Overall, with Average Prices falling and Days on Market
decreasing, the Listed versus Closed Ratio finished strong this
month.
There were 5,190 New Listings in February 2014, down 5.34%
from last year at 5,483. Furthermore, there were 2,685 Closed
Listings this month versus last year at 2,738, a -1.94%
decrease.
Closed versus Listed trends yielded a 51.7% ratio, up from last
year’s February 2014 at 49.9%, a 3.60% upswing. This will
certainly create pressure on a decreasing Month’s Supply of
Inventory (MSI) in the following months to come.
Consumers Should Consult with a REALTOR®
Buying or selling real estate, for a majority of consumers, is
one of the most important decisions they will make. Choosing a
real estate professional continues to be a vital part of this
process.
Identify a Professional to Manage the Procedure
REALTORS® are well-informed about critical factors that affect
your specific market area - such as changes in market
conditions, consumer attitudes and interest rates.
Are You Ready to Buy or Sell Real Estate?
For more information, contact:
Steve Reese - Vice President, Marketing
405-848-9944
steve@oklahomarealtors.com
Or visit: www.OklahomaRealtors.com
Reports produced and compiled by Information is deemed reliable but not guaranteed. Does not reflect all market activity.RE STATS Inc.
2. Monthly Inventory Analysis
The Oklahoma Association of
REALTORS®
February 2014
ClosedListings
Closed Listings
ReadytoBuyorSellRealEstate?
ContactanexperiencedREALTOR
Data from the
Area Delimited by Entire OK State MLS - Single-Family Property Type
Closed Sales as of Mar 12, 2014
Report Produced on: Mar 12, 2014
FEBRUARY YEAR TO DATE (YTD)
5 YEAR MARKET ACTIVITY TRENDS 5yr FEB AVG = 2,425 3 MONTHS
CLOSED LISTINGS & BEDROOMS DISTRIBUTION BY PRICE
High
Low
Jul 2013 = 4,633
Jan 2010 = 1,720
Closed Listingsthis
month at
above the 5 yr FEB
average of
2,685,
2,425
D
E
C
J
A
N
F
E
B
Distribution of Closed Listings by Price Range % AVDOM 2 Beds 3 Beds 4 Beds 5 Beds+
2010
2,188
2011
2,090
2012
2,424
2013
2,738
2014
2,685
1 Year
2 Year
-1.94%
+10.77%
2010
3,908
2011
4,072
2012
4,732
2013
5,272
2014
5,193
1 Year
2 Year
-1.50%
+9.74%
3,161
2,508
-20.66%
2,685
7.06%
146 5.44% 105.5 83 54 8 1
$25,000
and less
263 9.80% 87.4 110 134 17 2
$25,001
$50,000
583 21.71% 89.1 146 376 58 3
$50,001
$100,000
655 24.39% 73.6 97 468 87 3
$100,001
$150,000
266 9.91% 71.5 28 171 63 4
$150,001
$175,000
507 18.88% 86.0 63 237 189 18
$175,001
$275,000
265 9.87% 93.8 24 75 133 33
$275,001
and up
5,000
4,000
3,000
2,000
1,000
0
Jun 2010 Dec 2010 Jun 2011 Dec 2011 Jun 2012 Dec 2012 Jun 2013 Dec 2013
Total Closed Units:
Total Closed Volume:
Average Closed Price:
2,685
406,085,723
$151,242
84.2 551
56.66M
$102,830
1515
201.54M
$133,030
555
123.31M
$222,179
64
24.58M
$384,002
pp. 1Reports produced and compiled by Information is deemed reliable but not guaranteed. Does not reflect all market activity.RE STATS Inc.
Steve Reese 405-848-9944 steve@oklahomarealtors.com
3. Monthly Inventory Analysis
The Oklahoma Association of
REALTORS®
February 2014
PendingListings
Pending Listings
ReadytoBuyorSellRealEstate?
ContactanexperiencedREALTOR
Data from the
Area Delimited by Entire OK State MLS - Single-Family Property Type
Pending Listings as of Mar 12, 2014
Report Produced on: Mar 12, 2014
FEBRUARY YEAR TO DATE (YTD)
5 YEAR MARKET ACTIVITY TRENDS 5yr FEB AVG = 3,140 3 MONTHS
PENDING LISTINGS & BEDROOMS DISTRIBUTION BY PRICE
High
Low
Apr 2010 = 4,937
Dec 2010 = 2,050
Pending Listingsthis
month at
above the 5 yr FEB
average of
3,520,
3,140
D
E
C
J
A
N
F
E
B
Distribution of Pending Listings by Price Range % AVDOM 2 Beds 3 Beds 4 Beds 5 Beds+
2010
2,965
2011
2,321
2012
3,242
2013
3,650
2014
3,520
1 Year
2 Year
-3.56%
+8.57%
2010
5,376
2011
4,895
2012
6,366
2013
7,077
2014
6,933
1 Year
2 Year
-2.03%
+8.91%
2,333
3,413
46.29%
3,520
3.14%
339 9.63% 83.5 151 171 16 1
$40,000
and less
361 10.26% 77.6 113 220 25 3
$40,001
$70,000
592 16.82% 79.5 132 397 57 6
$70,001
$110,000
845 24.01% 67.9 129 594 114 8
$110,001
$160,000
595 16.90% 76.4 76 320 193 6
$160,001
$210,000
431 12.24% 86.3 54 177 182 18
$210,001
$290,000
357 10.14% 87.9 29 88 195 45
$290,001
and up
5,000
4,000
3,000
2,000
1,000
0
Jun 2010 Dec 2010 Jun 2011 Dec 2011 Jun 2012 Dec 2012 Jun 2013 Dec 2013
Total Pending Units:
Total Pending Volume:
Average Listing Price:
3,520
573,762,474
$145,266
92.1 684
80.42M
$117,570
1967
272.57M
$138,573
782
185.09M
$236,691
87
35.68M
$410,103
pp. 2Reports produced and compiled by Information is deemed reliable but not guaranteed. Does not reflect all market activity.RE STATS Inc.
Steve Reese 405-848-9944 steve@oklahomarealtors.com
4. Monthly Inventory Analysis
The Oklahoma Association of
REALTORS®
February 2014
NewListings
New Listings
ReadytoBuyorSellRealEstate?
ContactanexperiencedREALTOR
Data from the
Area Delimited by Entire OK State MLS - Single-Family Property Type
New Listings as of Mar 12, 2014
Report Produced on: Mar 12, 2014
FEBRUARY YEAR TO DATE (YTD)
5 YEAR MARKET ACTIVITY TRENDS 5yr FEB AVG = 5,162 3 MONTHS
NEW LISTINGS & BEDROOMS DISTRIBUTION BY PRICE
High
Low
Apr 2010 = 7,795
Dec 2013 = 3,475
New Listings this
month at
above the 5 yr FEB
average of
5,190,
5,162
D
E
C
J
A
N
F
E
B
Distribution of New Listings by Price Range % 2 Beds 3 Beds 4 Beds 5 Beds+
2010
5,288
2011
4,376
2012
5,475
2013
5,483
2014
5,190
1 Year
2 Year
-5.34%
-5.21%
2010
10,396
2011
9,840
2012
11,587
2013
11,418
2014
11,074
1 Year
2 Year
-3.01%
-4.43%
3,475
5,884
69.32%
5,190
-11.79%
459 8.84% 213 210 34 2
$50,000
and less
516 9.94% 172 305 35 4
$50,001
$75,000
593 11.43% 162 372 56 3
$75,001
$100,000
1,672 32.22% 230 1,146 284 12
$100,001
$175,000
650 12.52% 80 346 207 17
$175,001
$225,000
773 14.89% 81 294 351 47
$225,001
$350,000
527 10.15% 43 126 260 98
$350,001
and up
8,000
7,000
6,000
5,000
4,000
3,000
2,000
1,000
0
Jun 2010 Dec 2010 Jun 2011 Dec 2011 Jun 2012 Dec 2012 Jun 2013 Dec 2013
Total New Listed Units:
Total New Listed Volume:
Average New Listed Listing Price:
5,190
990,931,913
$177,567
981
124.90M
$127,318
2799
434.16M
$155,112
1227
331.92M
$270,514
183
99.95M
$546,201
pp. 3Reports produced and compiled by Information is deemed reliable but not guaranteed. Does not reflect all market activity.RE STATS Inc.
Steve Reese 405-848-9944 steve@oklahomarealtors.com
5. Monthly Inventory Analysis
The Oklahoma Association of
REALTORS®
February 2014
ActiveInventory
Active Inventory
ReadytoBuyorSellRealEstate?
ContactanexperiencedREALTOR
Data from the
Area Delimited by Entire OK State MLS - Single-Family Property Type
Active Inventory as of Mar 12, 2014
Report Produced on: Mar 12, 2014
END OF FEBRUARY ACTIVE DURING FEBRUARY
5 YEAR MARKET ACTIVITY TRENDS 5yr FEB AVG = 21,254 3 MONTHS
INVENTORY & BEDROOMS DISTRIBUTION BY PRICE
High
Low
Jul 2011 = 26,773
Feb 2014 = 19,023
Inventory this
month at
below the 5 yr FEB
average of
19,023,
21,254
D
E
C
J
A
N
F
E
B
Distribution of Inventory by Price Range % AVDOM 2 Beds 3 Beds 4 Beds 5 Beds+
2010
20,219
2011
23,486
2012
22,880
2013
20,660
2014
19,023
1 Year
2 Year
-7.92%
-16.86%
2010
25,192
2011
28,331
2012
28,728
2013
26,414
2014
24,878
1 Year
2 Year
-5.82%
-13.40%
20,185
19,696
-2.42%
19,023
-3.42%
1,835 9.65% 130.6 935 787 105 8
$50,000
and less
2,071 10.89% 129.9 810 1,104 142 15
$50,001
$75,000
2,263 11.90% 116.5 635 1,397 213 18
$75,001
$100,000
5,303 27.88% 107.6 956 3,427 848 72
$100,001
$175,000
3,267 17.17% 112.1 514 1,617 1,030 106
$175,001
$250,000
2,305 12.12% 115.1 303 730 1,084 188
$250,001
$375,000
1,979 10.40% 124.4 208 409 944 418
$375,001
and up
30,000
20,000
10,000
0
Jun 2010 Dec 2010 Jun 2011 Dec 2011 Jun 2012 Dec 2012 Jun 2013 Dec 2013
Total Active Inventory by Units:
Total Active Inventory by Volume:
Average Active Inventory Listing Price:
19,023
3,869,939,687
$203,435
116.7 4,361
617.51M
$141,598
9,471
1.51B
$159,260
4,366
1.29B
$296,337
825
450.28M
$545,792
pp. 4Reports produced and compiled by Information is deemed reliable but not guaranteed. Does not reflect all market activity.RE STATS Inc.
Steve Reese 405-848-9944 steve@oklahomarealtors.com
6. Monthly Inventory Analysis
The Oklahoma Association of
REALTORS®
February 2014
MonthsSupply
Months Supply of Inventory
ReadytoBuyorSellRealEstate?
ContactanexperiencedREALTOR
Data from the
Area Delimited by Entire OK State MLS - Single-Family Property Type
Active Inventory as of Mar 12, 2014
Report Produced on: Mar 12, 2014
MSI FOR FEBRUARY INDICATORS FOR FEBRUARY 2014
5 YEAR MARKET ACTIVITY TRENDS 5yr FEB AVG = 6.7 3 MONTHS
MONTHS SUPPLY & BEDROOMS DISTRIBUTION BY PRICE
High
Low
Jun 2011 = 9.7
Feb 2014 = 5.2
Months Supply this
month at
below the 5 yr FEB
average of
5.2,
6.7
D
E
C
J
A
N
F
E
B
Distribution of Active Inventory by Price Range and MSI % MSI 2 Beds 3 Beds 4 Beds 5 Beds+
2010
6.4
2011
8.1
2012
7.6
2013
6.0
2014
5.2
1 Year
2 Year
-13.23%
-30.92%
Inventory
19,023
End of
Month
Active
Inventory
Closed
43,703
Closed
Last
12
Months
Absorption
3,642
Average
Closed per
Month over
12 Months
MSI
5.2
Months
Supply
of
Inventory
MSI %
19.145%
Percent
Months
Supply of
Inventory
5.5
5.4
-2.36%
5.2
-3.30%
1,835 9.65% 4.3 5.0 3.8 3.9 1.9
$50,000
and less
1,694 8.91% 6.8 8.7 6.0 5.6 5.7
$50,001
$70,000
3,235 17.01% 5.3 6.2 4.9 5.9 6.8
$70,001
$110,000
5,065 26.63% 4.1 4.6 4.0 4.2 6.6
$110,001
$180,000
2,910 15.30% 4.9 5.8 5.1 4.3 5.6
$180,001
$250,000
2,365 12.43% 6.4 8.5 6.7 5.7 7.4
$250,001
$380,000
1,919 10.09% 11.7 16.3 12.4 10.4 12.7
$380,001
and up
10
9
8
7
6
5
4
3
2
1
0
Jun 2010 Dec 2010 Jun 2011 Dec 2011 Jun 2012 Dec 2012 Jun 2013 Dec 2013
MSI:
Total Active Inventory: 19,023
5.2 6.0
4,361
4.7
9,471
5.4
4,366
8.4
825
pp. 5Reports produced and compiled by Information is deemed reliable but not guaranteed. Does not reflect all market activity.RE STATS Inc.
Steve Reese 405-848-9944 steve@oklahomarealtors.com
7. Monthly Inventory Analysis
The Oklahoma Association of
REALTORS®
February 2014
AverageDaysonMarket
Average Days on Market to Sale
ReadytoBuyorSellRealEstate?
ContactanexperiencedREALTOR
Data from the
Area Delimited by Entire OK State MLS - Single-Family Property Type
Closed Sales as of Mar 12, 2014
Report Produced on: Mar 12, 2014
FEBRUARY YEAR TO DATE (YTD)
5 YEAR MARKET ACTIVITY TRENDS 5yr FEB AVG = 89 3 MONTHS
AVERAGE DOM OF CLOSED SALES & BEDROOMS DISTRIBUTION BY PRICE
High
Low
Mar 2011 = 98
Jul 2013 = 69
Average DOM this
month at
below the 5 yr FEB
average of
84,
89
D
E
C
J
A
N
F
E
B
Distribution of Average Days on Market to Sale by Price Range % AVDOM 2 Beds 3 Beds 4 Beds 5 Beds+
2010
86
2011
98
2012
92
2013
87
2014
84
1 Year
2 Year
-2.89%
-8.51%
2010
83
2011
95
2012
92
2013
84
2014
83
1 Year
2 Year
-0.96%
-9.07%
83
83
-0.20%
84
1.81%
146 5.44% 105.5 122.2 78.4 120.8 55.0
$25,000
and less
263 9.80% 87.4 112.2 68.7 85.1 6.5
$25,001
$50,000
583 21.71% 89.1 96.9 85.7 87.5 160.3
$50,001
$100,000
655 24.39% 73.6 87.9 69.8 78.8 66.3
$100,001
$150,000
266 9.91% 71.5 103.5 66.0 72.8 65.0
$150,001
$175,000
507 18.88% 86.0 114.2 76.5 86.5 108.1
$175,001
$275,000
265 9.87% 93.8 115.0 83.1 94.0 101.8
$275,001
and up
100
90
80
70
60
50
40
30
20
10
0
Jun 2010 Dec 2010 Jun 2011 Dec 2011 Jun 2012 Dec 2012 Jun 2013 Dec 2013
Average Closed DOM:
Total Closed Units:
Total Closed Volume:
84.2
2,685
406,085,723
105.3
551
56.66M
75.2
1515
201.54M
86.1
555
123.31M
98.7
64
24.58M
pp. 6Reports produced and compiled by Information is deemed reliable but not guaranteed. Does not reflect all market activity.RE STATS Inc.
Steve Reese 405-848-9944 steve@oklahomarealtors.com
8. Monthly Inventory Analysis
The Oklahoma Association of
REALTORS®
February 2014
AverageListPrice
Average List Price at Closing
ReadytoBuyorSellRealEstate?
ContactanexperiencedREALTOR
Data from the
Area Delimited by Entire OK State MLS - Single-Family Property Type
Closed Sales as of Mar 12, 2014
Report Produced on: Mar 12, 2014
FEBRUARY YEAR TO DATE (YTD)
5 YEAR MARKET ACTIVITY TRENDS 5yr FEB AVG = 152K 3 MONTHS
AVERAGE LIST PRICE OF CLOSED SALES & BEDROOMS DISTRIBUTION BY PRICE
High
Low
Jul 2013 = 176,633
Jan 2010 = 139,091
Average LPrice this
month at
above the 5 yr FEB
average of
156,488,
152,065
D
E
C
J
A
N
F
E
B
Distribution of Average List Price at Closing by Price Range % AVL$ 2 Beds 3 Beds 4 Beds 5 Beds+
2010
145,909
2011
147,665
2012
148,099
2013
162,164
2014
156,488
1 Year
2 Year
-3.50%
+5.66%
2010
142,908
2011
148,904
2012
145,255
2013
158,504
2014
157,344
1 Year
2 Year
-0.73%
+8.32%
165,361
158,261
-4.29%
156,488
-1.12%
127 4.73% 17,792 20,133 19,785 23,075 19,900
$25,000
and less
255 9.50% 38,353 39,904 41,150 41,247 54,700
$25,001
$50,000
576 21.45% 79,109 80,605 82,144 81,700 97,900
$50,001
$100,000
641 23.87% 128,098 132,099 130,470 136,211 141,743
$100,001
$150,000
276 10.28% 163,548 167,948 165,834 169,082 169,200
$150,001
$175,000
530 19.74% 217,704 219,205 219,849 225,702 240,074
$175,001
$275,000
280 10.43% 428,325 445,442 377,297 422,641 611,983
$275,001
and up
200,000
100,000
0
Jun 2010 Dec 2010 Jun 2011 Dec 2011 Jun 2012 Dec 2012 Jun 2013 Dec 2013
Average List Price:
Total Closed Units:
Total List Volume:
$156,488
2,685
420,170,891
$108,613
551
59.85M
$136,824
1515
207.29M
$228,821
555
127.00M
$406,903
64
26.04M
pp. 7Reports produced and compiled by Information is deemed reliable but not guaranteed. Does not reflect all market activity.RE STATS Inc.
Steve Reese 405-848-9944 steve@oklahomarealtors.com
9. Monthly Inventory Analysis
The Oklahoma Association of
REALTORS®
February 2014
AverageSoldPrice
Average Sold Price at Closing
ReadytoBuyorSellRealEstate?
ContactanexperiencedREALTOR
Data from the
Area Delimited by Entire OK State MLS - Single-Family Property Type
Closed Sales as of Mar 12, 2014
Report Produced on: Mar 12, 2014
FEBRUARY YEAR TO DATE (YTD)
5 YEAR MARKET ACTIVITY TRENDS 5yr FEB AVG = 146K 3 MONTHS
AVERAGE SOLD PRICE OF CLOSED SALES & BEDROOMS DISTRIBUTION BY PRICE
High
Low
Jul 2013 = 171,586
Jan 2010 = 133,454
Average SPrice this
month at
above the 5 yr FEB
average of
151,242,
146,259
D
E
C
J
A
N
F
E
B
Distribution of Average Sold Price at Closing by Price Range % AVS$ 2 Beds 3 Beds 4 Beds 5 Beds+
2010
140,137
2011
141,587
2012
142,392
2013
155,938
2014
151,242
1 Year
2 Year
-3.01%
+6.22%
2010
137,196
2011
142,594
2012
139,430
2013
152,863
2014
151,774
1 Year
2 Year
-0.71%
+8.85%
160,021
152,343
-4.80%
151,242
-0.72%
146 5.44% 16,935 17,073 16,870 16,931 9,000
$25,000
and less
263 9.80% 37,255 36,592 37,873 36,502 38,750
$25,001
$50,000
583 21.71% 78,328 76,082 79,119 78,411 86,967
$50,001
$100,000
655 24.39% 127,650 127,668 126,994 130,769 138,967
$100,001
$150,000
266 9.91% 163,067 163,968 162,421 164,486 162,050
$150,001
$175,000
507 18.88% 217,409 211,477 214,821 221,244 231,958
$175,001
$275,000
265 9.87% 418,630 408,805 369,154 409,404 575,406
$275,001
and up
200,000
100,000
0
Jun 2010 Dec 2010 Jun 2011 Dec 2011 Jun 2012 Dec 2012 Jun 2013 Dec 2013
Average Closed Price:
Total Closed Units:
Total Closed Volume:
$151,242
2,685
406,085,723
$102,830
551
56.66M
$133,030
1515
201.54M
$222,179
555
123.31M
$384,002
64
24.58M
pp. 8Reports produced and compiled by Information is deemed reliable but not guaranteed. Does not reflect all market activity.RE STATS Inc.
Steve Reese 405-848-9944 steve@oklahomarealtors.com
10. Monthly Inventory Analysis
The Oklahoma Association of
REALTORS®
February 2014
AverageList/SellPrice
Average Percent of List Price to Selling Price
ReadytoBuyorSellRealEstate?
ContactanexperiencedREALTOR
Data from the
Area Delimited by Entire OK State MLS - Single-Family Property Type
Closed Sales as of Mar 12, 2014
Report Produced on: Mar 12, 2014
FEBRUARY YEAR TO DATE (YTD)
5 YEAR MARKET ACTIVITY TRENDS 5yr FEB AVG=95.78% 3 MONTHS
AVERAGE L/S% OF CLOSED SALES & BEDROOMS DISTRIBUTION BY PRICE
High
Low
Dec 2013 = 97.04%
Jan 2011 = 95.22%
Average List/Sell this
month at
above the 5 yr FEB
average of
96.28%,
95.78%
D
E
C
J
A
N
F
E
B
Distribution of $avgmed L/S % by Price Range % AVL/S% 2 Beds 3 Beds 4 Beds 5 Beds+
2010
95.78%
2011
95.43%
2012
95.49%
2013
95.93%
2014
96.28%
1 Year
2 Year
+0.37%
+0.83%
2010
95.64%
2011
95.32%
2012
95.40%
2013
96.13%
2014
96.12%
1 Year
2 Year
+0.76%
97.04%
95.95%
-1.12%
96.28%
0.34%
146 5.44% 86.19% 86.39% 87.54% 80.02% 45.23%
$25,000
and less
263 9.80% 93.07% 93.22% 93.44% 91.95% 69.38%
$25,001
$50,000
583 21.71% 96.38% 94.74% 97.10% 96.26% 88.86%
$50,001
$100,000
655 24.39% 97.25% 96.81% 97.52% 96.30% 98.30%
$100,001
$150,000
266 9.91% 97.92% 97.79% 98.19% 97.36% 95.82%
$150,001
$175,000
507 18.88% 97.97% 96.80% 98.23% 98.13% 96.92%
$175,001
$275,000
265 9.87% 97.56% 96.29% 98.48% 97.57% 96.39%
$275,001
and up
98
97
96
95
Jun 2010 Dec 2010 Jun 2011 Dec 2011 Jun 2012 Dec 2012 Jun 2013 Dec 2013
Average List/Sell Ratio:
Total Closed Units:
Total Closed Volume:
96.30%
2,685
406,085,723
94.00%
551
56.66M
96.93%
1515
201.54M
96.98%
555
123.31M
94.60%
64
24.58M
pp. 9Reports produced and compiled by Information is deemed reliable but not guaranteed. Does not reflect all market activity.RE STATS Inc.
Steve Reese 405-848-9944 steve@oklahomarealtors.com
11. Monthly Inventory Analysis
The Oklahoma Association of
REALTORS®
February 2014
Market Summary
Data from the
Area Delimited by Entire OK State MLS - Single-Family Property Type
Inventory as of Mar 12, 2014
Report Produced on: Mar 12, 2014
Inventory Inventory Market Activity Market Activity
New Listings Closed Sales
Pending Sales
Other Off Market
Active Inventory
Start Inventory
Total Inventory
Units
Volume
5,190 = 20.86%
19,696
24,886
$4,897,328,635
2,685 = 9.74%
3,520 = 12.77%
2,336 = 8.47%
19,023 = 69.01%
Absorption:
Active Inventory
3,642
19,023
FEBRUARY Year To Date
2013 2014 +/-% 2013 2014 +/-%
Last 12 months, an Average of Sales/Month
as of February 28, 2014 =
Closed Sales
Pending Sales
New Listings
Average List Price
Average Sale Price
Average Percent of List Price to Selling Price
Average Days on Market to Sale
Monthly Inventory
Months Supply of Inventory
2,738 2,685 -1.94%
3,650 3,520 -3.56%
5,483 5,190 -5.34%
162,164 156,488 -3.50%
155,938 151,242 -3.01%
95.93% 96.28% 0.37%
86.70 84.19 -2.89%
20,675 19,023 -7.99%
5.98 5.22 -12.62%
5,272 5,193 -1.50%
7,077 6,933 -2.03%
11,418 11,074 -3.01%
158,504 157,344 -0.73%
152,863 151,774 -0.71%
96.13% 96.12% -0.00%
84.28 83.47 -0.96%
20,675 19,023 -7.99%
5.98 5.22 -12.62%
New Listings Pending Listings List Price Sale Price
Active Inventory Monthly Supply of Inventory % of List to Sale Price Days on Market to Sale
2013
2014
2013
2014
2013
2014
2013
2014
FEBRUARY MARKET AVERAGE PRICES
INVENTORY AVERAGE L/S% & DOM
5,483
3,650
5,190
-5.34%
3,520
-3.56%
162,164
155,938156,488
-3.50%
151,242
-3.01%
20,675 5.98
19,023
-7.99%
5.22
-12.62%
95.93%
86.7096.28%
+0.37%
84.19
-2.89%
pp. 10Reports produced and compiled by Information is deemed reliable but not guaranteed. Does not reflect all market activity.RE STATS Inc.
Steve Reese 405-848-9944 steve@oklahomarealtors.com