SlideShare a Scribd company logo
1 of 11
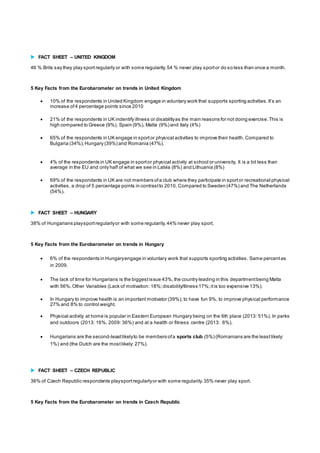
 FACT SHEET – UNITED KINGDOM 
46 % Brits say they play sport regularly or with some regularity. 54 % never play sport or do so less than once a month. 
5 Key Facts from the Eurobarometer on trends in United Kingdom 
 10% of the respondents in United Kingdom engage in voluntary work that supports s porting activities . It’s an 
increase of 4 percentage points since 2010 
 21% of the respondents in UK indentify illness or disability as the main reasons for not doing exercise. This is 
high compared to Greece (9%), Spain (9%), Malta (9%) and Italy (4%) 
 65% of the respondents in UK engage in sport or physical activities to improve their health. Compared to 
Bulgaria (34%), Hungary (39%) and Romania (47%). 
 4% of the respondents in UK engage in sport or physical activity at school or university. It is a bit less than 
average in the EU and only half of what we see in Latvia (8%) and Lithuania (8%) 
 69% of the respondents in UK are not members of a club where they participate in sport or recreational physical 
activities, a drop of 5 percentage points in contrast to 2010. Compared to Sweden (47%) and The Netherlands 
(54%). 
 FACT SHEET – HUNGARY 
38% of Hungarians play sport regularly or with some regularity. 44% never play sport. 
5 Key Facts from the Eurobarometer on trends in Hungary 
 6% of the respondents in Hungary engage in voluntary work that supports sporting activities. Same percent as 
in 2009. 
 The lack of time for Hungarians is the biggest issue 43%, the country leading in this department being Malta 
with 56%. Other Variables (Lack of motivation: 18%; disability/Illness 17%; it is too expensive 13%). 
 In Hungary to improve health is an important motivator (39%); to have fun 9%, to improve physical performance 
27% and 8% to control weight. 
 Physical activity at home is popular in Eastern European Hungary being on the 6th place (2013: 51%). In parks 
and outdoors (2013: 16%, 2009: 36%) and at a health or fitness centre (2013: 6%). 
 Hungarians are the second-least likely to be members of a sports club (5%) (Romanians are the least likely: 
1%) and (the Dutch are the most likely: 27%). 
 FACT SHEET – CZECH REPUBLIC 
36% of Czech Republic respondents play sport regularly or with some regularity. 35% never play sport. 
5 Key Facts from the Eurobarometer on trends in Czech Republic
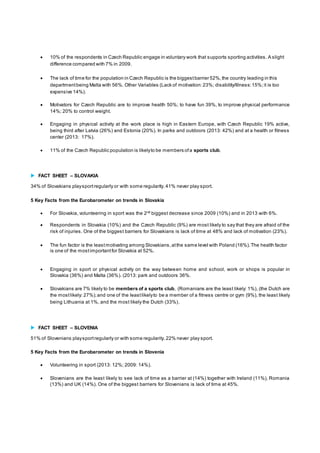
 10% of the respondents in Czech Republic engage in voluntary work that supports sporting activities. A slight 
difference compared with 7% in 2009. 
 The lack of time for the population in Czech Republic is the biggest barrier 52%, the country leading in this 
department being Malta with 56%. Other Variables (Lack of motivation: 23%; disability/Illness: 15%; it is too 
expensive 14%). 
 Motivators for Czech Republic are to improve health 50%; to have fun 39%, to improve physical performance 
14%; 20% to control weight. 
 Engaging in physical activity at the work place is high in Eastern Europe, with Czech Republic 19% active, 
being third after Latvia (26%) and Estonia (20%). In parks and outdoors (2013: 42%) and at a health or fitness 
center (2013: 17%). 
 11% of the Czech Republic population is likely to be members of a sports club. 
 FACT SHEET – SLOVAKIA 
34% of Slovakians play sport regularly or with some regularity. 41% never play sport. 
5 Key Facts from the Eurobarometer on trends in Slovakia 
 For Slovakia, volunteering in sport was the 2nd biggest decrease since 2009 (10%) and in 2013 with 6%. 
 Respondents in Slovakia (10%) and the Czech Republic (9%) are most likely to say that they are afraid of the 
risk of injuries. One of the biggest barriers for Slovakians is lack of time at 48% and lack of motivation (23%). 
 The fun factor is the least motivating among Slovakians, at the same level with Poland (16%). The health factor 
is one of the most important for Slovakia at 52%. 
 Engaging in sport or physical activity on the way between home and school, work or shops is popular in 
Slovakia (36%) and Malta (36%). (2013: park and outdoors 36%. 
 Slovakians are 7% likely to be members of a sports club, (Romanians are the least likely: 1%), (the Dutch are 
the most likely: 27%); and one of the least likely to be a member of a fitness centre or gym (9%), the least likely 
being Lithuania at 1%, and the most likely the Dutch (33%). 
 FACT SHEET – SLOVENIA 
51% of Slovenians play sport regularly or with some regularity. 22% never play sport. 
5 Key Facts from the Eurobarometer on trends in Slovenia 
 Volunteering in sport (2013: 12%; 2009: 14%). 
 Slovenians are the least likely to see lack of time as a barrier at (14%) together with Ireland (11%), Romania 
(13%) and UK (14%). One of the biggest barriers for Slovenians is lack of time at 45%.
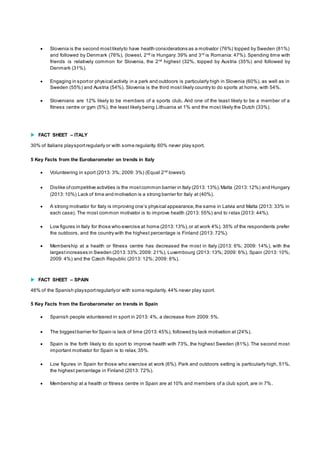
 Slovenia is the second most likely to have health considerations as a motivator (76%) topped by Sweden (81%) 
and followed by Denmark (76%), (lowest, 2nd is Hungary: 39% and 3rd is Romania: 47%). Spending time with 
friends is relatively common for Slovenia, the 2nd highest (32%, topped by Austria (35%) and followed by 
Denmark (31%). 
 Engaging in sport or physical activity in a park and outdoors is particularly high in Slovenia (60%), as well as in 
Sweden (55%) and Austria (54%). Slovenia is the third most likely country to do sports at home, with 54%. 
 Slovenians are 12% likely to be members of a sports club. And one of the least likely to be a member of a 
fitness centre or gym (5%), the least likely being Lithuania at 1% and the most likely the Dutch (33%). 
 FACT SHEET – ITALY 
30% of Italians play sport regularly or with some regularity. 60% never play sport. 
5 Key Facts from the Eurobarometer on trends in Italy 
 Volunteering in sport (2013: 3%; 2009: 3%) (Equal 2nd lowest). 
 Dislike of competitive activities is the most common barrier in Italy (2013: 13%), Malta (2013: 12%) and Hungary 
(2013: 10%) Lack of time and motivation is a strong barrier for Italy at (40%). 
 A s trong motivator for Italy is improving one’s phys ical appearance, the s ame in Latvia and Malta (2013: 33% in 
each case). The most common motivator is to improve health (2013: 55%) and to relax (2013: 44%). 
 Low figures in Italy for those who exercise at home (2013: 13%), or at work 4%). 35% of the respondents prefer 
the outdoors, and the country with the highest percentage is Finland (2013: 72%). 
 Membership at a health or fitness centre has decreased the most in Italy (2013: 6%; 2009: 14%), with the 
largest increases in Sweden (2013: 33%; 2009: 21%), Luxembourg (2013: 13%; 2009: 6%), Spain (2013: 10%; 
2009: 4%) and the Czech Republic (2013: 12%; 2009: 6%). 
 FACT SHEET – SPAIN 
46% of the Spanish play sport regularly or with some regularity. 44% never play sport. 
5 Key Facts from the Eurobarometer on trends in Spain 
 Spanish people volunteered in sport in 2013: 4%, a decrease from 2009: 5%. 
 The biggest barrier for Spain is lack of time (2013: 45%), followed by lack motivation at (24%). 
 Spain is the forth likely to do sport to improve health with 73%, the highest Sweden (81%). The second most 
important motivator for Spain is to relax, 35%. 
 Low figures in Spain for those who exercise at work (6%). Park and outdoors setting is particularly high, 51%, 
the highest percentage in Finland (2013: 72%). 
 Membership at a health or fitness centre in Spain are at 10% and members of a club sport, are in 7%.
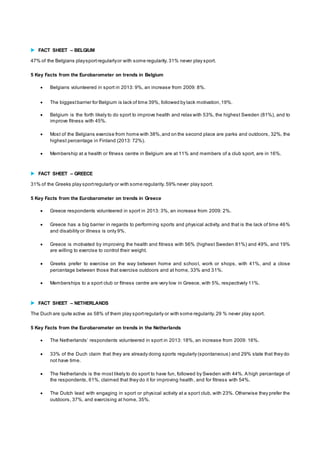
 FACT SHEET – BELGIUM 
47% of the Belgians play sport regularly or with some regularity. 31% never play sport. 
5 Key Facts from the Eurobarometer on trends in Belgium 
 Belgians volunteered in sport in 2013: 9%, an increase from 2009: 8%. 
 The biggest barrier for Belgium is lack of time 39%, followed by lack motivation, 19%. 
 Belgium is the forth likely to do sport to improve health and relax with 53%, the highest Sweden (81%), and to 
improve fitness with 45%. 
 Most of the Belgians exercise from home with 38%, and on the second place are parks and outdoors, 32%, the 
highest percentage in Finland (2013: 72%). 
 Membership at a health or fitness centre in Belgium are at 11% and members of a club sport, are in 16%. 
 FACT SHEET – GREECE 
31% of the Greeks play sport regularly or with some regularity. 59% never play sport. 
5 Key Facts from the Eurobarometer on trends in Greece 
 Greece respondents volunteered in sport in 2013: 3%, an increase from 2009: 2%. 
 Greece has a big barrier in regards to performing sports and physical activity, and that is the lack of time 46% 
and disability or illness is only 9%. 
 Greece is motivated by improving the health and fitness with 56% (highest Sweden 81%) and 49%, and 19% 
are willing to exercise to control their weight. 
 Greeks prefer to exercise on the way between home and school, work or shops, with 41%, and a close 
percentage between those that exercise outdoors and at home, 33% and 31%. 
 Memberships to a sport club or fitness centre are very low in Greece, with 5%, respectively 11%. 
 FACT SHEET – NETHERLANDS 
The Duch are quite active as 58% of them play sport regularly or with some regularity. 29 % never play sport. 
5 Key Facts from the Eurobarometer on trends in the Netherlands 
 The Netherlands ’ respondents volunteered in sport in 2013: 18%, an increase from 2009: 16%. 
 33% of the Duch claim that they are already doing sports regularly (spontaneous) and 29% state that they do 
not have time. 
 The Netherlands is the most likely to do sport to have fun, followed by Sweden with 44%. A high percentage of 
the respondents, 61%, claimed that they do it for improving health, and for fitness with 54%. 
 The Dutch lead with engaging in sport or physical activity at a spor t club, with 23%. Otherwise they prefer the 
outdoors, 37%, and exercising at home, 35%.
 As mentioned before, the Dutch are the most likely to be part of a sport club, with 27% and 19% members of a 
health or fitness centre. 
 FACT SHEET – LITHUANIA 
37% of Lithuanians are active and play sport regularly or with some regularity. 46% never play sport. 
5 Key Facts from the Eurobarometer on trends in Lithuania 
 Lithuanians volunteered in sport in 2013: 5%, a decrease from 2009: 7%. 
 Lithuanians are some of the most likely to have lack of time as a barrier, 42%. The next impediment for them is 
the lack of motivation or interest, with 20%.Lithuania ranks 3rd in stating that doing sport is too expensive, as a 
barrier (17%). 
 What motivates Lithuania when engaging in sport of physical activity is primarily the health improvement. 
Another important motivator is to have fun and 42% of the respondents have agreed on this and Lithuania is on 
the third place with this percentage, together with Denmark. 
 Lithuanians are leading with 63%, exercising at home, followed by Slovakia and Slovenia with 54% and on the 
third place Romania with 53%. On the way between home, school, work or shops is 29% and outdoors 28%. 
 Respondents in Lithuania are the least likely to be part of a health fitness of centre, with 1%, and only 8% are 
members of a sport club. 
 FACT SHEET – ESTONIA 
39% of Estonians are active and play sport regularly or with some regularity. 36% never play sport. 
5 Key Facts from the Eurobarometer on trends in Estonia 
 Estonians volunteered in sport in 2013: 12%, an increase from 2009: 11%. 
 For Estonia, the lack of time is one of the main barriers when it comes to exercising, with 48% and on the 
second place for Lithuania, is having an illness or disability (17%). 
 What motivates Estonians the most is engaging in sport of physical activity for improving the health (55%), 
followed by improving fitness (41%). 
 Two settings Estonians prefer the most, in a park or outdoors (47%) and exercising from home (41%), with a 
significant percentage of 34% of those that are active on the way between home and school, work or shops. 
 With 12%, Estonia’s res pondents likely to be part of a club sport, with the Netherlands ranking with 27%. The 
least likely to be members of sport clubs are Romanians with 1%. 
 FACT SHEET – LUXEMBOURG 
54% of Luxembourg’s respondents are active and play sport regularly or with some regularity. 29% never play sport. 
5 Key Facts from the Eurobarometer on trends in Luxembourg 
 In Luxembourg, the respondents volunteered in sport in 2013: 13%, a Decrease from 2009: 14%.
 For Luxembourgers , as for most of the countries, the lack of time is one of the main barriers when it comes to 
exercising, ranking 4th with 50%, on the same level Sweden. Lack of Motivation for Luxembourg is 23%. 
 What motivates Luxembourgers the most is engaging in sport of physical activity for improving the health, with a 
high percentage of 66%, followed by improving fitness by 49%. A significant part of the respondents, 32% chose 
weight control as one of the motivators. 
 Respondents in Luxembourg prefer to exercise, in a park or outdoors (36%) and exercising from home (35%). 
 With 21%, Luxembourg classifies among the countries that are likely to be part of a club sport (5th place), with 
the Netherlands ranking with 27%. The least likely to be members of sport clubs are Romanians with 1%. 
 FACT SHEET – AUSTRIA 
45% of Austrians are active and play sport regularly or with some regularity. 27% never play sport. 
5 Key Facts from the Eurobarometer on trends in Austria 
 Austrians volunteered in sport in 2013: 12%, a decrease from 2009: 15%. 
 In Aus tria, the percentage allocated to the bigges t barriers , s uch as lack of time and lack of motivation, aren’t 
staggering, with 31%, respectively 26%. 
 For Austrians, when doing sports, motivating is health improvement, with a significant percentage of 63%, 
followed by improving fitness, 40%, and having fun with 39%. Austria is also ranking first with 35% when it 
comes to engage in sport and physical activity to be with friends, the last one being Poland with 9%. 
 Austrians are third with 54% exercising outdoor, Finland being the one leading with 72% and on the second 
place, Slovenia with 60%. At home, 43% of Austrians prefer to exercise and at a fitness centre 19%. 
 Respondents in Austria are part of sport club with 13%, less than they are members of a health or fitness 
centre, with 16%, on the 5th place. 
 FACT SHEET –BULGARIA 
A shocking low percentage of11 % of Bulgarians say that they play sport regularly or with some regularity. 87% never 
play sport or do so less than once a month. 
5 Key Facts from the Eurobarometer on trends in Bulgaria 
 A very low percent, 3%, of the respondents in Bulgaria were engaged in voluntary work that supported sporting 
activities in 2013 and is the same percent as in 2009. 
 Bulgarians ’ main reason for not living an active life is that 39% of them do not have time and 26% lack 
motivation and interest. 
 A surprisingly low proportion of respondents cite improving fitness as their motivation in Bulgaria (12%), 
Romania (12%) and Portugal (14%). To improve their health, Bulgaria (34%), Hungary (39%) and Romania 
(47%). 
 Most of the respondents in Bulgaria prefer exercising at home, 52%. And the rest in parks and outdoors (25%) 
or between home and school, work or shops (21%).
 94% of Bulgarians are not part of any sport club and for those that are, the percentage is 2%, the same as 
those that are members of a health or fitness centre. They are on the second place from the bottom, Romania 
being the one with the smallest percentage of respondents that are members of a sport club (1%). 
 FACT SHEET –DENMARK 
A very high percentage (68 %) of Danish say that they play sport regularly or with some regularity. 14% never play sport 
or do so less than once a month. 
5 Key Facts from the Eurobarometer on trends in Denmark 
 18% of the respondents in Denmark were engaged in voluntary work that supported sporting activities in 2013, 
higher than in 2009 when it was 15%. 
 If Danes don’t engage in phys ical activities it is becaus e they lack motivation (29%) and they are leading i n this 
regards. Another reason is of course lack of time (48%). 
 In Denmark, improving one’s s elf-esteem is a fairly common motivating factor (29%), as well as controlling one’s 
weight (43%), the same as Sweden. 
 The proportion engaging in sport or physical activity in a park and outdoors is particularly high in Denmark 
(50%) and the highest in Finland (47%). 22% of the respondents go to a sports club in Denmark. 
 In Denmark, it is fairly common to be part of a socio-cultural club that includes sport in its activities with 9%, but 
the highest numbers are for those who join a sport club and health or fitness centre (25%). 
 FACT SHEET –POLAND 
Only 28 % of Polish say that they play sport regularly or with some regularity. 52% never play sport or do so less than 
once a month. 
5 Key Facts from the Eurobarometer on trends in Poland 
 3% of the respondents in Poland were engaged in voluntary work that supported sporting activities in 2013, 
higher than in 2009 when it was 2%. 
 In Poland, people don’t practice s port becaus e they lack time 46%, but also interest (14%). 
 In Poland it is common to relax by doing sports (16%) and the strongest motivation is to improve the health with 
59%. 
 The proportion engaging in sport or physical activity at home is the highest for Poland when talking about 
settings with 37%, followed by park and outdoors with 35%. The highest is in Finland (47%). 
 The percentages in Poland are pretty low when it comes to memberships, with only 3% going for sport clubs 
and 6% for health or fitness centre. 
 FACT SHEET –PORTUGAL 
Only 28 % of the Portuguese play sport regularly or with some regularity and 64 % never play sport or do so less than 
once a month.
5 Key Facts from the Eurobarometer on trends in Portugal 
 2% of the respondents in Portugal were engaged in voluntary work that supported sporting activities in 2013, 
the same as in 2009. 
 Portugal has the highest percentage among the European countries, when it comes to the price barrier when 
practicing sport regularly (it is too expensive), with 19%. Moreover, the main one is the lack of time, with 33% 
and lack of motivation with 26%. 
 In Portugal, the highest figure when it comes to motivators, is improving the health, with 67%, followed by the 
desire to relax (32%). 
 The Portuguese prefer to go out and exercise in parks or other outdoors settings with 44%, as well as on the 
way to school, home, work or shops (25%). 
 Most of the respondents in Portugal would be part of a health or fitness centre in proportion of 6% and 
memberships at the club are only 4%. 
 FACT SHEET – CROATIA 
35 % of the Croatians play sport regularly or with some regularity and only 29 % never play sport or do so less than once 
a month. 
5 Key Facts from the Eurobarometer on trends in Croatia 
 8% of the respondents in Croatia were engaged in voluntary work that supported sporting activities in 2013. 
 In Croatia 8% of the people see a lack of suitable or accessible sport infrastructure as a problem. 
 With 58 % of the population thinking that the local authorities does not do enough for its citizens in relation to 
physical activity Croatia are the most unsatisfied in the European Union. 
 Croatians prefer to go out and exercise on the way to school, home, work or shops with 44%, as well as in 
parks or other outdoors settings (30%) 
 Most of the respondents in Croatia would be part of a health or fitness centre in proportion of 7% and 
memberships at the club are 10%. 
 FACT SHEET – FRANCE 
With 56% France is among the European countries with the highest proportions of the population who do vigorous 
physical activity for more than an hour only, second only to Estonia (58%). 
5 Key Facts from the Eurobarometer on trends in France 
 A mere 5% of the French do their sport or physical activity in a health- or fitness centre 
 French people’s main reason for not living an active life is that 42% of them do not have time and 24% lack 
motivation and interest. 
 What motivates the French most is engaging in sport of physical activity for improving the health (55%), closely 
followed by improving fitness (54%).
 Respondents in France prefer to exercise, in a park or outdoors (42%) and exercising at home (27%). 
 With 16%, France’s active res pondents are most likely to be part of a s ports club, with the Netherlands ranking 
one with 27%. The least likely to be members of sport clubs are Romanians with 1%. 
 FACT SHEET – LATVIA 
31% of Latvians are active and play sport regularly or with some regularity. 39% never play sport. 
5 Key Facts from the Eurobarometer on trends in Latvia 
 Latvians volunteered in sport in 2013: 8%, a decrease from 2009: 13%. 
 Latvians are some of the most likely to have lack of time as a barrier, 47%. The next impediment for them is the 
lack of motivation or interest, with 19%.Latvia ranks 12th along with the UK in stating that doing sport is too 
expensive, as a barrier (11%). 
 What motivates Latvians when engaging in sport of physical activity is primarily the health improvement (62%). 
Another important motivator is to improve fitness with 38% of the respondents have agreed on this .. 
 With 26% Latvians are leading respondents exercising at work, followed by Estonia with 20% and on the shared 
third place Lithuania and the Czech Republic with 19%. 
 Respondents in Latvia are the 2nd least likely to be members of any club along with Hungary (89%). Only 
Bulgaria has fewer club members with 94% not being members of any club. 
 FACT SHEET – CYPRUS 
36% of Cypriots are active and play sport regularly or with some regularity. 54% never play sport. 
5 Key Facts from the Eurobarometer on trends in Cyprus 
 Cypriots volunteered in sport in 2013: 5%, a small increase from 2009 where it was 4%. 
 Cypriots are some of the most likely to have lack of time as a barrier for physical activity, 49%. The next 
impediment for them is the lack of motivation or interest, with 20%. Cyprus ranks 2nd, only surpassed by 
Portugal, in stating that doing sport is too expensive, as a barrier (18%). 
 What motivates Cypriots when engaging in sport of physical activity is primarily the health improvement (73%). 
Another important motivator is to improve fitness with 48% of the respondents have agreed on this . 
 Respondents in Cyprus prefer to exercise at home (36%) and to exercise in a park or outdoors (33%) 
 The percentages in Cyprus are pretty low when it comes to memberships, with only 6% going for sport clubs 
and 9% for health or fitness centre. 
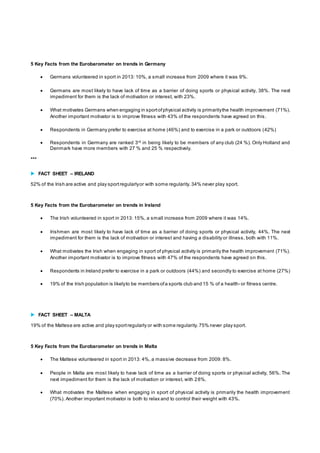
 FACT SHEET – GERMANY 
48% of Germans are active and play sport regularly or with some regularity. 29% never play sport.
5 Key Facts from the Eurobarometer on trends in Germany 
 Germans volunteered in sport in 2013: 10%, a small increase from 2009 where it was 9%. 
 Germans are most likely to have lack of time as a barrier of doing sports or physical activity, 38%. The next 
impediment for them is the lack of motivation or interest, with 23%. 
 What motivates Germans when engaging in sport of physical activity is primarily the health improvement (71%). 
Another important motivator is to improve fitness with 43% of the respondents have agreed on this . 
 Respondents in Germany prefer to exercise at home (46%) and to exercise in a park or outdoors (42%) 
 Respondents in Germany are ranked 3rd in being likely to be members of any club (24 %). Only Holland and 
Denmark have more members with 27 % and 25 % respectively. 
*** 
 FACT SHEET – IRELAND 
52% of the Irish are active and play sport regularly or with some regularity. 34% never play sport. 
5 Key Facts from the Eurobarometer on trends in Ireland 
 The Irish volunteered in sport in 2013: 15%, a small increase from 2009 where it was 14%. 
 Irishmen are most likely to have lack of time as a barrier of doing sports or physical activity, 44%. The next 
impediment for them is the lack of motivation or interest and having a disability or illness, both with 11%. 
 What motivates the Irish when engaging in sport of physical activity is primarily the health improvement (71%). 
Another important motivator is to improve fitness with 47% of the respondents have agreed on this. 
 Respondents in Ireland prefer to exercise in a park or outdoors (44%) and secondly to exercise at home (27%) 
 19% of the Irish population is likely to be members of a sports club and 15 % of a health- or fitness centre. 
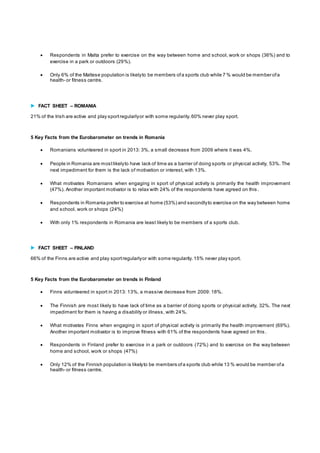
 FACT SHEET – MALTA 
19% of the Maltese are active and play sport regularly or with some regularity. 75% never play sport. 
5 Key Facts from the Eurobarometer on trends in Malta 
 The Maltese volunteered in sport in 2013: 4%, a massive decrease from 2009: 8%. 
 People in Malta are most likely to have lack of time as a barrier of doing sports or physical activity, 56%. The 
next impediment for them is the lack of motivation or interest, with 28%. 
 What motivates the Maltese when engaging in sport of physical activity is primarily the health improvement 
(70%). Another important motivator is both to relax and to control their weight with 43%.
 Respondents in Malta prefer to exercise on the way between home and school, work or shops (36%) and to 
exercise in a park or outdoors (29%). 
 Only 6% of the Maltese population is likely to be members of a sports club while 7 % would be member of a 
health- or fitness centre. 
 FACT SHEET – ROMANIA 
21% of the Irish are active and play sport regularly or with some regularity. 60% never play sport. 
5 Key Facts from the Eurobarometer on trends in Romania 
 Romanians volunteered in sport in 2013: 3%, a small decrease from 2009 where it was 4%. 
 People in Romania are most likely to have lack of time as a barrier of doing sports or physical activity, 53%. The 
next impediment for them is the lack of motivation or interest, with 13%. 
 What motivates Romanians when engaging in sport of physical activity is primarily the health improvement 
(47%). Another important motivator is to relax with 24% of the respondents have agreed on this . 
 Respondents in Romania prefer to exercise at home (53%) and secondly to exercise on the way between home 
and school, work or shops (24%) 
 With only 1% respondents in Romania are least likely to be members of a sports club. 
 FACT SHEET – FINLAND 
66% of the Finns are active and play sport regularly or with some regularity. 15% never play sport. 
5 Key Facts from the Eurobarometer on trends in Finland 
 Finns volunteered in sport in 2013: 13%, a massive decrease from 2009: 18%. 
 The Finnish are most likely to have lack of time as a barrier of doing sports or physical activity, 32%. The next 
impediment for them is having a disability or illness, with 24%. 
 What motivates Finns when engaging in sport of physical activity is primarily the health improvement (69%). 
Another important motivator is to improve fitness with 61% of the respondents have agreed on this . 
 Respondents in Finland prefer to exercise in a park or outdoors (72%) and to exercise on the way between 
home and school, work or shops (47%) 
 Only 12% of the Finnish population is likely to be members of a sports club while 13 % would be member of a 
health- or fitness centre.

More Related Content

Viewers also liked

Assignment%20#3 under armour internal and swot analysis
Assignment%20#3 under armour internal and swot analysisAssignment%20#3 under armour internal and swot analysis
Assignment%20#3 under armour internal and swot analysisBrian Teufel
 
Under Armour industry analysis
Under Armour industry analysisUnder Armour industry analysis
Under Armour industry analysisshayla khan shimu
 
Final ppt under armour
Final ppt under armourFinal ppt under armour
Final ppt under armourAriel Song
 
Under Armour Strategic Analysis & Recommendations
Under Armour Strategic Analysis & RecommendationsUnder Armour Strategic Analysis & Recommendations
Under Armour Strategic Analysis & RecommendationsJonathan Levitt
 
Strategic Management in a Global Context: Under Armour
Strategic Management in a Global Context: Under ArmourStrategic Management in a Global Context: Under Armour
Strategic Management in a Global Context: Under ArmourRonantonnoel
 
Under armour case analysis by Njinyah Ciro
Under armour case analysis by Njinyah CiroUnder armour case analysis by Njinyah Ciro
Under armour case analysis by Njinyah CiroCiro Njinyah
 
Annual Report Insights 2016 Planning your report
Annual Report Insights 2016 Planning your reportAnnual Report Insights 2016 Planning your report
Annual Report Insights 2016 Planning your reportDeloitte UK
 
Deloitte UK Annual Review of Football Finance infographic
Deloitte UK Annual Review of Football Finance infographicDeloitte UK Annual Review of Football Finance infographic
Deloitte UK Annual Review of Football Finance infographicDeloitte UK
 
Annual Review of Football Finance 2016
Annual Review of Football Finance 2016Annual Review of Football Finance 2016
Annual Review of Football Finance 2016Deloitte UK
 
Deloitte Football Money League - Top of the table
Deloitte Football Money League - Top of the tableDeloitte Football Money League - Top of the table
Deloitte Football Money League - Top of the tableDeloitte UK
 

Viewers also liked (11)

Assignment%20#3 under armour internal and swot analysis
Assignment%20#3 under armour internal and swot analysisAssignment%20#3 under armour internal and swot analysis
Assignment%20#3 under armour internal and swot analysis
 
Under Armour Presentation
Under Armour PresentationUnder Armour Presentation
Under Armour Presentation
 
Under Armour industry analysis
Under Armour industry analysisUnder Armour industry analysis
Under Armour industry analysis
 
Final ppt under armour
Final ppt under armourFinal ppt under armour
Final ppt under armour
 
Under Armour Strategic Analysis & Recommendations
Under Armour Strategic Analysis & RecommendationsUnder Armour Strategic Analysis & Recommendations
Under Armour Strategic Analysis & Recommendations
 
Strategic Management in a Global Context: Under Armour
Strategic Management in a Global Context: Under ArmourStrategic Management in a Global Context: Under Armour
Strategic Management in a Global Context: Under Armour
 
Under armour case analysis by Njinyah Ciro
Under armour case analysis by Njinyah CiroUnder armour case analysis by Njinyah Ciro
Under armour case analysis by Njinyah Ciro
 
Annual Report Insights 2016 Planning your report
Annual Report Insights 2016 Planning your reportAnnual Report Insights 2016 Planning your report
Annual Report Insights 2016 Planning your report
 
Deloitte UK Annual Review of Football Finance infographic
Deloitte UK Annual Review of Football Finance infographicDeloitte UK Annual Review of Football Finance infographic
Deloitte UK Annual Review of Football Finance infographic
 
Annual Review of Football Finance 2016
Annual Review of Football Finance 2016Annual Review of Football Finance 2016
Annual Review of Football Finance 2016
 
Deloitte Football Money League - Top of the table
Deloitte Football Money League - Top of the tableDeloitte Football Money League - Top of the table
Deloitte Football Money League - Top of the table
 

Similar to Fact Sheet on European Countries Physical Activity Level

Health & Society CSA-Europ Assistance Barometer 2013_press release
Health & Society CSA-Europ Assistance Barometer 2013_press releaseHealth & Society CSA-Europ Assistance Barometer 2013_press release
Health & Society CSA-Europ Assistance Barometer 2013_press releaseEurop Assistance Group
 
Alcohol misuse and older people- Conor Breen, CARDI
Alcohol misuse and older people- Conor Breen, CARDIAlcohol misuse and older people- Conor Breen, CARDI
Alcohol misuse and older people- Conor Breen, CARDIRoger O'Sullivan
 
The PPACTE survey on the economic aspects of smoking in Europe
The PPACTE survey on the economic aspects of smoking in EuropeThe PPACTE survey on the economic aspects of smoking in Europe
The PPACTE survey on the economic aspects of smoking in EuropeUCT ICO
 
Qualitative Research
Qualitative ResearchQualitative Research
Qualitative Researchclainno
 
Tobacco sofia 2011
Tobacco sofia 2011Tobacco sofia 2011
Tobacco sofia 2011pavlovajb
 
Ipsos European Pulse: Majority of Citizens in 12 EU Countries are Not Interes...
Ipsos European Pulse: Majority of Citizens in 12 EU Countries are Not Interes...Ipsos European Pulse: Majority of Citizens in 12 EU Countries are Not Interes...
Ipsos European Pulse: Majority of Citizens in 12 EU Countries are Not Interes...Ipsos Public Affairs
 
Disability in developing and developed countries.pptx
Disability in developing and developed countries.pptxDisability in developing and developed countries.pptx
Disability in developing and developed countries.pptxAkshayBadore2
 
Estudio “Monitor Global de Salud” de consultora Ipsos
Estudio “Monitor Global de Salud” de consultora IpsosEstudio “Monitor Global de Salud” de consultora Ipsos
Estudio “Monitor Global de Salud” de consultora IpsosAproximacionAlFuturo
 
Emigrants' political righst pt case in comparative 23 6-2015 london
Emigrants' political righst pt case in comparative 23 6-2015 londonEmigrants' political righst pt case in comparative 23 6-2015 london
Emigrants' political righst pt case in comparative 23 6-2015 londonPaulo Costa
 
What Europeans think about development aid
What Europeans think about development aidWhat Europeans think about development aid
What Europeans think about development aidDevex
 
The Philip Lee Sport Report
The Philip Lee Sport ReportThe Philip Lee Sport Report
The Philip Lee Sport ReportPLeeIT
 
The Shock of the New? Britain in 2015
The Shock of the New? Britain in 2015The Shock of the New? Britain in 2015
The Shock of the New? Britain in 2015Ipsos UK
 
The Philip Lee Sport Report
The Philip Lee Sport ReportThe Philip Lee Sport Report
The Philip Lee Sport ReportPhilip Lee
 
Addiction And Co Morbidity
Addiction And Co MorbidityAddiction And Co Morbidity
Addiction And Co MorbidityStephen Malloy
 

Similar to Fact Sheet on European Countries Physical Activity Level (17)

Health & Society CSA-Europ Assistance Barometer 2013_press release
Health & Society CSA-Europ Assistance Barometer 2013_press releaseHealth & Society CSA-Europ Assistance Barometer 2013_press release
Health & Society CSA-Europ Assistance Barometer 2013_press release
 
Alcohol misuse and older people- Conor Breen, CARDI
Alcohol misuse and older people- Conor Breen, CARDIAlcohol misuse and older people- Conor Breen, CARDI
Alcohol misuse and older people- Conor Breen, CARDI
 
The PPACTE survey on the economic aspects of smoking in Europe
The PPACTE survey on the economic aspects of smoking in EuropeThe PPACTE survey on the economic aspects of smoking in Europe
The PPACTE survey on the economic aspects of smoking in Europe
 
Qualitative Research
Qualitative ResearchQualitative Research
Qualitative Research
 
Tobacco sofia 2011
Tobacco sofia 2011Tobacco sofia 2011
Tobacco sofia 2011
 
Ipsos European Pulse: Majority of Citizens in 12 EU Countries are Not Interes...
Ipsos European Pulse: Majority of Citizens in 12 EU Countries are Not Interes...Ipsos European Pulse: Majority of Citizens in 12 EU Countries are Not Interes...
Ipsos European Pulse: Majority of Citizens in 12 EU Countries are Not Interes...
 
Disability in developing and developed countries.pptx
Disability in developing and developed countries.pptxDisability in developing and developed countries.pptx
Disability in developing and developed countries.pptx
 
HBSC Report 2010
HBSC Report 2010HBSC Report 2010
HBSC Report 2010
 
Estudio “Monitor Global de Salud” de consultora Ipsos
Estudio “Monitor Global de Salud” de consultora IpsosEstudio “Monitor Global de Salud” de consultora Ipsos
Estudio “Monitor Global de Salud” de consultora Ipsos
 
Emigrants' political righst pt case in comparative 23 6-2015 london
Emigrants' political righst pt case in comparative 23 6-2015 londonEmigrants' political righst pt case in comparative 23 6-2015 london
Emigrants' political righst pt case in comparative 23 6-2015 london
 
What Europeans think about development aid
What Europeans think about development aidWhat Europeans think about development aid
What Europeans think about development aid
 
The Philip Lee Sport Report
The Philip Lee Sport ReportThe Philip Lee Sport Report
The Philip Lee Sport Report
 
The Shock of the New? Britain in 2015
The Shock of the New? Britain in 2015The Shock of the New? Britain in 2015
The Shock of the New? Britain in 2015
 
Pew research-center
Pew research-centerPew research-center
Pew research-center
 
The Philip Lee Sport Report
The Philip Lee Sport ReportThe Philip Lee Sport Report
The Philip Lee Sport Report
 
Addiction And Co Morbidity
Addiction And Co MorbidityAddiction And Co Morbidity
Addiction And Co Morbidity
 
Tobacco atlas
Tobacco atlasTobacco atlas
Tobacco atlas
 

More from International Sport and Culture Association (ISCA)

More from International Sport and Culture Association (ISCA) (20)

No Elevators Day - Action Guide 2024 - #UseTheStairs
No Elevators Day - Action Guide 2024 - #UseTheStairsNo Elevators Day - Action Guide 2024 - #UseTheStairs
No Elevators Day - Action Guide 2024 - #UseTheStairs
 
No Elevators Day - Communications Guide 2024 - #UseTheStairs
No Elevators Day - Communications Guide 2024 - #UseTheStairsNo Elevators Day - Communications Guide 2024 - #UseTheStairs
No Elevators Day - Communications Guide 2024 - #UseTheStairs
 
ISCA Statutes
ISCA StatutesISCA Statutes
ISCA Statutes
 
No Elevators Day 2023 - Urban Intervention Toolkit for placemaking networks
No Elevators Day 2023 - Urban Intervention Toolkit for placemaking networksNo Elevators Day 2023 - Urban Intervention Toolkit for placemaking networks
No Elevators Day 2023 - Urban Intervention Toolkit for placemaking networks
 
No Elevators Day 2023 - Communications Guide
No Elevators Day 2023 - Communications GuideNo Elevators Day 2023 - Communications Guide
No Elevators Day 2023 - Communications Guide
 
No Elevators Day 2023 - Action Guide
No Elevators Day 2023 - Action GuideNo Elevators Day 2023 - Action Guide
No Elevators Day 2023 - Action Guide
 
2 Example PARK example from Romania
2 Example PARK example from Romania2 Example PARK example from Romania
2 Example PARK example from Romania
 
4 Example PARK example from Malta
4 Example PARK example from Malta4 Example PARK example from Malta
4 Example PARK example from Malta
 
3 Example PARK example from Spain
3 Example PARK example from Spain3 Example PARK example from Spain
3 Example PARK example from Spain
 
1 Example PARK example from Bulgaria
1 Example PARK example from Bulgaria1 Example PARK example from Bulgaria
1 Example PARK example from Bulgaria
 
Arabic Action guide NED 2022
Arabic Action guide NED 2022Arabic Action guide NED 2022
Arabic Action guide NED 2022
 
Arabic Communications guide NED 2022
Arabic Communications guide NED 2022Arabic Communications guide NED 2022
Arabic Communications guide NED 2022
 
No Elevators Day 2022 - Communications Guide
No Elevators Day 2022 - Communications GuideNo Elevators Day 2022 - Communications Guide
No Elevators Day 2022 - Communications Guide
 
No Elevators Day 2022 - Action Guide
No Elevators Day 2022 - Action GuideNo Elevators Day 2022 - Action Guide
No Elevators Day 2022 - Action Guide
 
No Elevators Day 2022 - Urban Intervention Toolkit for placemaking networks
No Elevators Day 2022 - Urban Intervention Toolkit for placemaking networksNo Elevators Day 2022 - Urban Intervention Toolkit for placemaking networks
No Elevators Day 2022 - Urban Intervention Toolkit for placemaking networks
 
MOVE Congress 2021: Jean-Baptiste Alliot 'Mastering the culture of innovation...
MOVE Congress 2021: Jean-Baptiste Alliot 'Mastering the culture of innovation...MOVE Congress 2021: Jean-Baptiste Alliot 'Mastering the culture of innovation...
MOVE Congress 2021: Jean-Baptiste Alliot 'Mastering the culture of innovation...
 
MOVE Congress 2021: Rebuilding mental wellbeing through physical activity (Yo...
MOVE Congress 2021: Rebuilding mental wellbeing through physical activity (Yo...MOVE Congress 2021: Rebuilding mental wellbeing through physical activity (Yo...
MOVE Congress 2021: Rebuilding mental wellbeing through physical activity (Yo...
 
MOVE Congress 2021: Mastering Partnerships with UNHCR, sportanddev, DGI, Novo...
MOVE Congress 2021: Mastering Partnerships with UNHCR, sportanddev, DGI, Novo...MOVE Congress 2021: Mastering Partnerships with UNHCR, sportanddev, DGI, Novo...
MOVE Congress 2021: Mastering Partnerships with UNHCR, sportanddev, DGI, Novo...
 
MOVE Congress 2021: Karine Teow (ITTF Foundation) 'Ping Pong Diplomacy - 50 y...
MOVE Congress 2021: Karine Teow (ITTF Foundation) 'Ping Pong Diplomacy - 50 y...MOVE Congress 2021: Karine Teow (ITTF Foundation) 'Ping Pong Diplomacy - 50 y...
MOVE Congress 2021: Karine Teow (ITTF Foundation) 'Ping Pong Diplomacy - 50 y...
 
MOVE Congress 2021: Bart Cardinaal (HUNC) 'The Flying Grass Carpet'
MOVE Congress 2021: Bart Cardinaal (HUNC) 'The Flying Grass Carpet'MOVE Congress 2021: Bart Cardinaal (HUNC) 'The Flying Grass Carpet'
MOVE Congress 2021: Bart Cardinaal (HUNC) 'The Flying Grass Carpet'
 

Recently uploaded

BPTP THE AMAARIO Luxury Project Invest Like Royalty in Sector 37D Gurgaon Dwa...
BPTP THE AMAARIO Luxury Project Invest Like Royalty in Sector 37D Gurgaon Dwa...BPTP THE AMAARIO Luxury Project Invest Like Royalty in Sector 37D Gurgaon Dwa...
BPTP THE AMAARIO Luxury Project Invest Like Royalty in Sector 37D Gurgaon Dwa...ApartmentWala1
 
2k Shot Call girls Aiims Delhi 9205541914
2k Shot Call girls Aiims Delhi 92055419142k Shot Call girls Aiims Delhi 9205541914
2k Shot Call girls Aiims Delhi 9205541914Delhi Call girls
 
2k Shot Call girls Karol Bagh Delhi 9205541914
2k Shot Call girls Karol Bagh Delhi 92055419142k Shot Call girls Karol Bagh Delhi 9205541914
2k Shot Call girls Karol Bagh Delhi 9205541914Delhi Call girls
 
TENANT SCREENING REPORT SERVICES​ How Tenant Screening Reports Work
TENANT SCREENING REPORT SERVICES​ How Tenant Screening Reports WorkTENANT SCREENING REPORT SERVICES​ How Tenant Screening Reports Work
TENANT SCREENING REPORT SERVICES​ How Tenant Screening Reports WorkTurbo Tenant
 
9990771857 Call Girls in Dwarka Sector 6 Delhi (Call Girls) Delhi
9990771857 Call Girls in Dwarka Sector 6 Delhi (Call Girls) Delhi9990771857 Call Girls in Dwarka Sector 6 Delhi (Call Girls) Delhi
9990771857 Call Girls in Dwarka Sector 6 Delhi (Call Girls) Delhidelhimodel235
 
SVN Live 5.6.24 Weekly Property Broadcast
SVN Live 5.6.24 Weekly Property BroadcastSVN Live 5.6.24 Weekly Property Broadcast
SVN Live 5.6.24 Weekly Property BroadcastSVN International Corp.
 
Kolte Patil Kharadi Pune E Brochure.pdf
Kolte Patil Kharadi Pune E  Brochure.pdfKolte Patil Kharadi Pune E  Brochure.pdf
Kolte Patil Kharadi Pune E Brochure.pdfabbu831446
 
9990771857 Call Girls in Dwarka Sector 08 Delhi (Call Girls) Delhi
9990771857 Call Girls in Dwarka Sector 08 Delhi (Call Girls) Delhi9990771857 Call Girls in Dwarka Sector 08 Delhi (Call Girls) Delhi
9990771857 Call Girls in Dwarka Sector 08 Delhi (Call Girls) Delhidelhimodel235
 
Vanam At Purva Soukhyam Guduvanchery.pdf.pdf
Vanam At Purva Soukhyam Guduvanchery.pdf.pdfVanam At Purva Soukhyam Guduvanchery.pdf.pdf
Vanam At Purva Soukhyam Guduvanchery.pdf.pdfkratirudram
 
9990771857 Call Girls in Dwarka Sector 6 Delhi (Call Girls) Delhi
9990771857 Call Girls in Dwarka Sector 6 Delhi (Call Girls) Delhi9990771857 Call Girls in Dwarka Sector 6 Delhi (Call Girls) Delhi
9990771857 Call Girls in Dwarka Sector 6 Delhi (Call Girls) Delhidelhimodel235
 
9990771857 Call Girls in Dwarka Sector 137 Noida (Call Girls) Delhi
9990771857 Call Girls in Dwarka Sector 137 Noida (Call Girls) Delhi9990771857 Call Girls in Dwarka Sector 137 Noida (Call Girls) Delhi
9990771857 Call Girls in Dwarka Sector 137 Noida (Call Girls) Delhidelhimodel235
 
ACE Terra Yamuna Expressway | 8929888700
ACE Terra Yamuna Expressway | 8929888700ACE Terra Yamuna Expressway | 8929888700
ACE Terra Yamuna Expressway | 8929888700Truhomes
 
Mahindra Happinest Tathawade Pune Brochure.pdf
Mahindra Happinest Tathawade Pune Brochure.pdfMahindra Happinest Tathawade Pune Brochure.pdf
Mahindra Happinest Tathawade Pune Brochure.pdfBabyrudram
 
Prestige Sancoale Goa Residneces Brochure.pdf
Prestige Sancoale Goa Residneces Brochure.pdfPrestige Sancoale Goa Residneces Brochure.pdf
Prestige Sancoale Goa Residneces Brochure.pdfkishor21012022
 
Cheap Rate ✨➥9711108085▻✨Call Girls In Malviya Nagar(Delhi)
Cheap Rate ✨➥9711108085▻✨Call Girls In Malviya Nagar(Delhi)Cheap Rate ✨➥9711108085▻✨Call Girls In Malviya Nagar(Delhi)
Cheap Rate ✨➥9711108085▻✨Call Girls In Malviya Nagar(Delhi)delhi24hrs1
 
Majestique Viman Nagar Pune Brochure.pdf
Majestique Viman Nagar Pune Brochure.pdfMajestique Viman Nagar Pune Brochure.pdf
Majestique Viman Nagar Pune Brochure.pdfBabyrudram
 
BDSM⚡Call Girls in Sector 57 Noida Escorts >༒8448380779 Escort Service
BDSM⚡Call Girls in Sector 57 Noida Escorts >༒8448380779 Escort ServiceBDSM⚡Call Girls in Sector 57 Noida Escorts >༒8448380779 Escort Service
BDSM⚡Call Girls in Sector 57 Noida Escorts >༒8448380779 Escort ServiceDelhi Call girls
 
MEQ Mainstreet Equity Corp Q2 2024 Investor Presentation
MEQ Mainstreet Equity Corp Q2 2024 Investor PresentationMEQ Mainstreet Equity Corp Q2 2024 Investor Presentation
MEQ Mainstreet Equity Corp Q2 2024 Investor PresentationMEQ - Mainstreet Equity Corp.
 
David Litt Foreclosure Specialist - Your Partner in Real Estate Success
David Litt Foreclosure Specialist - Your Partner in Real Estate SuccessDavid Litt Foreclosure Specialist - Your Partner in Real Estate Success
David Litt Foreclosure Specialist - Your Partner in Real Estate SuccessDavid Litt
 
Best Deal Virtual Space in Satya The Hive Tata Zudio 750 Sqft 1.89 Cr All inc...
Best Deal Virtual Space in Satya The Hive Tata Zudio 750 Sqft 1.89 Cr All inc...Best Deal Virtual Space in Satya The Hive Tata Zudio 750 Sqft 1.89 Cr All inc...
Best Deal Virtual Space in Satya The Hive Tata Zudio 750 Sqft 1.89 Cr All inc...ApartmentWala1
 

Recently uploaded (20)

BPTP THE AMAARIO Luxury Project Invest Like Royalty in Sector 37D Gurgaon Dwa...
BPTP THE AMAARIO Luxury Project Invest Like Royalty in Sector 37D Gurgaon Dwa...BPTP THE AMAARIO Luxury Project Invest Like Royalty in Sector 37D Gurgaon Dwa...
BPTP THE AMAARIO Luxury Project Invest Like Royalty in Sector 37D Gurgaon Dwa...
 
2k Shot Call girls Aiims Delhi 9205541914
2k Shot Call girls Aiims Delhi 92055419142k Shot Call girls Aiims Delhi 9205541914
2k Shot Call girls Aiims Delhi 9205541914
 
2k Shot Call girls Karol Bagh Delhi 9205541914
2k Shot Call girls Karol Bagh Delhi 92055419142k Shot Call girls Karol Bagh Delhi 9205541914
2k Shot Call girls Karol Bagh Delhi 9205541914
 
TENANT SCREENING REPORT SERVICES​ How Tenant Screening Reports Work
TENANT SCREENING REPORT SERVICES​ How Tenant Screening Reports WorkTENANT SCREENING REPORT SERVICES​ How Tenant Screening Reports Work
TENANT SCREENING REPORT SERVICES​ How Tenant Screening Reports Work
 
9990771857 Call Girls in Dwarka Sector 6 Delhi (Call Girls) Delhi
9990771857 Call Girls in Dwarka Sector 6 Delhi (Call Girls) Delhi9990771857 Call Girls in Dwarka Sector 6 Delhi (Call Girls) Delhi
9990771857 Call Girls in Dwarka Sector 6 Delhi (Call Girls) Delhi
 
SVN Live 5.6.24 Weekly Property Broadcast
SVN Live 5.6.24 Weekly Property BroadcastSVN Live 5.6.24 Weekly Property Broadcast
SVN Live 5.6.24 Weekly Property Broadcast
 
Kolte Patil Kharadi Pune E Brochure.pdf
Kolte Patil Kharadi Pune E  Brochure.pdfKolte Patil Kharadi Pune E  Brochure.pdf
Kolte Patil Kharadi Pune E Brochure.pdf
 
9990771857 Call Girls in Dwarka Sector 08 Delhi (Call Girls) Delhi
9990771857 Call Girls in Dwarka Sector 08 Delhi (Call Girls) Delhi9990771857 Call Girls in Dwarka Sector 08 Delhi (Call Girls) Delhi
9990771857 Call Girls in Dwarka Sector 08 Delhi (Call Girls) Delhi
 
Vanam At Purva Soukhyam Guduvanchery.pdf.pdf
Vanam At Purva Soukhyam Guduvanchery.pdf.pdfVanam At Purva Soukhyam Guduvanchery.pdf.pdf
Vanam At Purva Soukhyam Guduvanchery.pdf.pdf
 
9990771857 Call Girls in Dwarka Sector 6 Delhi (Call Girls) Delhi
9990771857 Call Girls in Dwarka Sector 6 Delhi (Call Girls) Delhi9990771857 Call Girls in Dwarka Sector 6 Delhi (Call Girls) Delhi
9990771857 Call Girls in Dwarka Sector 6 Delhi (Call Girls) Delhi
 
9990771857 Call Girls in Dwarka Sector 137 Noida (Call Girls) Delhi
9990771857 Call Girls in Dwarka Sector 137 Noida (Call Girls) Delhi9990771857 Call Girls in Dwarka Sector 137 Noida (Call Girls) Delhi
9990771857 Call Girls in Dwarka Sector 137 Noida (Call Girls) Delhi
 
ACE Terra Yamuna Expressway | 8929888700
ACE Terra Yamuna Expressway | 8929888700ACE Terra Yamuna Expressway | 8929888700
ACE Terra Yamuna Expressway | 8929888700
 
Mahindra Happinest Tathawade Pune Brochure.pdf
Mahindra Happinest Tathawade Pune Brochure.pdfMahindra Happinest Tathawade Pune Brochure.pdf
Mahindra Happinest Tathawade Pune Brochure.pdf
 
Prestige Sancoale Goa Residneces Brochure.pdf
Prestige Sancoale Goa Residneces Brochure.pdfPrestige Sancoale Goa Residneces Brochure.pdf
Prestige Sancoale Goa Residneces Brochure.pdf
 
Cheap Rate ✨➥9711108085▻✨Call Girls In Malviya Nagar(Delhi)
Cheap Rate ✨➥9711108085▻✨Call Girls In Malviya Nagar(Delhi)Cheap Rate ✨➥9711108085▻✨Call Girls In Malviya Nagar(Delhi)
Cheap Rate ✨➥9711108085▻✨Call Girls In Malviya Nagar(Delhi)
 
Majestique Viman Nagar Pune Brochure.pdf
Majestique Viman Nagar Pune Brochure.pdfMajestique Viman Nagar Pune Brochure.pdf
Majestique Viman Nagar Pune Brochure.pdf
 
BDSM⚡Call Girls in Sector 57 Noida Escorts >༒8448380779 Escort Service
BDSM⚡Call Girls in Sector 57 Noida Escorts >༒8448380779 Escort ServiceBDSM⚡Call Girls in Sector 57 Noida Escorts >༒8448380779 Escort Service
BDSM⚡Call Girls in Sector 57 Noida Escorts >༒8448380779 Escort Service
 
MEQ Mainstreet Equity Corp Q2 2024 Investor Presentation
MEQ Mainstreet Equity Corp Q2 2024 Investor PresentationMEQ Mainstreet Equity Corp Q2 2024 Investor Presentation
MEQ Mainstreet Equity Corp Q2 2024 Investor Presentation
 
David Litt Foreclosure Specialist - Your Partner in Real Estate Success
David Litt Foreclosure Specialist - Your Partner in Real Estate SuccessDavid Litt Foreclosure Specialist - Your Partner in Real Estate Success
David Litt Foreclosure Specialist - Your Partner in Real Estate Success
 
Best Deal Virtual Space in Satya The Hive Tata Zudio 750 Sqft 1.89 Cr All inc...
Best Deal Virtual Space in Satya The Hive Tata Zudio 750 Sqft 1.89 Cr All inc...Best Deal Virtual Space in Satya The Hive Tata Zudio 750 Sqft 1.89 Cr All inc...
Best Deal Virtual Space in Satya The Hive Tata Zudio 750 Sqft 1.89 Cr All inc...
 

Fact Sheet on European Countries Physical Activity Level

  • 1.  FACT SHEET – UNITED KINGDOM 46 % Brits say they play sport regularly or with some regularity. 54 % never play sport or do so less than once a month. 5 Key Facts from the Eurobarometer on trends in United Kingdom  10% of the respondents in United Kingdom engage in voluntary work that supports s porting activities . It’s an increase of 4 percentage points since 2010  21% of the respondents in UK indentify illness or disability as the main reasons for not doing exercise. This is high compared to Greece (9%), Spain (9%), Malta (9%) and Italy (4%)  65% of the respondents in UK engage in sport or physical activities to improve their health. Compared to Bulgaria (34%), Hungary (39%) and Romania (47%).  4% of the respondents in UK engage in sport or physical activity at school or university. It is a bit less than average in the EU and only half of what we see in Latvia (8%) and Lithuania (8%)  69% of the respondents in UK are not members of a club where they participate in sport or recreational physical activities, a drop of 5 percentage points in contrast to 2010. Compared to Sweden (47%) and The Netherlands (54%).  FACT SHEET – HUNGARY 38% of Hungarians play sport regularly or with some regularity. 44% never play sport. 5 Key Facts from the Eurobarometer on trends in Hungary  6% of the respondents in Hungary engage in voluntary work that supports sporting activities. Same percent as in 2009.  The lack of time for Hungarians is the biggest issue 43%, the country leading in this department being Malta with 56%. Other Variables (Lack of motivation: 18%; disability/Illness 17%; it is too expensive 13%).  In Hungary to improve health is an important motivator (39%); to have fun 9%, to improve physical performance 27% and 8% to control weight.  Physical activity at home is popular in Eastern European Hungary being on the 6th place (2013: 51%). In parks and outdoors (2013: 16%, 2009: 36%) and at a health or fitness centre (2013: 6%).  Hungarians are the second-least likely to be members of a sports club (5%) (Romanians are the least likely: 1%) and (the Dutch are the most likely: 27%).  FACT SHEET – CZECH REPUBLIC 36% of Czech Republic respondents play sport regularly or with some regularity. 35% never play sport. 5 Key Facts from the Eurobarometer on trends in Czech Republic
  • 2.  10% of the respondents in Czech Republic engage in voluntary work that supports sporting activities. A slight difference compared with 7% in 2009.  The lack of time for the population in Czech Republic is the biggest barrier 52%, the country leading in this department being Malta with 56%. Other Variables (Lack of motivation: 23%; disability/Illness: 15%; it is too expensive 14%).  Motivators for Czech Republic are to improve health 50%; to have fun 39%, to improve physical performance 14%; 20% to control weight.  Engaging in physical activity at the work place is high in Eastern Europe, with Czech Republic 19% active, being third after Latvia (26%) and Estonia (20%). In parks and outdoors (2013: 42%) and at a health or fitness center (2013: 17%).  11% of the Czech Republic population is likely to be members of a sports club.  FACT SHEET – SLOVAKIA 34% of Slovakians play sport regularly or with some regularity. 41% never play sport. 5 Key Facts from the Eurobarometer on trends in Slovakia  For Slovakia, volunteering in sport was the 2nd biggest decrease since 2009 (10%) and in 2013 with 6%.  Respondents in Slovakia (10%) and the Czech Republic (9%) are most likely to say that they are afraid of the risk of injuries. One of the biggest barriers for Slovakians is lack of time at 48% and lack of motivation (23%).  The fun factor is the least motivating among Slovakians, at the same level with Poland (16%). The health factor is one of the most important for Slovakia at 52%.  Engaging in sport or physical activity on the way between home and school, work or shops is popular in Slovakia (36%) and Malta (36%). (2013: park and outdoors 36%.  Slovakians are 7% likely to be members of a sports club, (Romanians are the least likely: 1%), (the Dutch are the most likely: 27%); and one of the least likely to be a member of a fitness centre or gym (9%), the least likely being Lithuania at 1%, and the most likely the Dutch (33%).  FACT SHEET – SLOVENIA 51% of Slovenians play sport regularly or with some regularity. 22% never play sport. 5 Key Facts from the Eurobarometer on trends in Slovenia  Volunteering in sport (2013: 12%; 2009: 14%).  Slovenians are the least likely to see lack of time as a barrier at (14%) together with Ireland (11%), Romania (13%) and UK (14%). One of the biggest barriers for Slovenians is lack of time at 45%.
  • 3.  Slovenia is the second most likely to have health considerations as a motivator (76%) topped by Sweden (81%) and followed by Denmark (76%), (lowest, 2nd is Hungary: 39% and 3rd is Romania: 47%). Spending time with friends is relatively common for Slovenia, the 2nd highest (32%, topped by Austria (35%) and followed by Denmark (31%).  Engaging in sport or physical activity in a park and outdoors is particularly high in Slovenia (60%), as well as in Sweden (55%) and Austria (54%). Slovenia is the third most likely country to do sports at home, with 54%.  Slovenians are 12% likely to be members of a sports club. And one of the least likely to be a member of a fitness centre or gym (5%), the least likely being Lithuania at 1% and the most likely the Dutch (33%).  FACT SHEET – ITALY 30% of Italians play sport regularly or with some regularity. 60% never play sport. 5 Key Facts from the Eurobarometer on trends in Italy  Volunteering in sport (2013: 3%; 2009: 3%) (Equal 2nd lowest).  Dislike of competitive activities is the most common barrier in Italy (2013: 13%), Malta (2013: 12%) and Hungary (2013: 10%) Lack of time and motivation is a strong barrier for Italy at (40%).  A s trong motivator for Italy is improving one’s phys ical appearance, the s ame in Latvia and Malta (2013: 33% in each case). The most common motivator is to improve health (2013: 55%) and to relax (2013: 44%).  Low figures in Italy for those who exercise at home (2013: 13%), or at work 4%). 35% of the respondents prefer the outdoors, and the country with the highest percentage is Finland (2013: 72%).  Membership at a health or fitness centre has decreased the most in Italy (2013: 6%; 2009: 14%), with the largest increases in Sweden (2013: 33%; 2009: 21%), Luxembourg (2013: 13%; 2009: 6%), Spain (2013: 10%; 2009: 4%) and the Czech Republic (2013: 12%; 2009: 6%).  FACT SHEET – SPAIN 46% of the Spanish play sport regularly or with some regularity. 44% never play sport. 5 Key Facts from the Eurobarometer on trends in Spain  Spanish people volunteered in sport in 2013: 4%, a decrease from 2009: 5%.  The biggest barrier for Spain is lack of time (2013: 45%), followed by lack motivation at (24%).  Spain is the forth likely to do sport to improve health with 73%, the highest Sweden (81%). The second most important motivator for Spain is to relax, 35%.  Low figures in Spain for those who exercise at work (6%). Park and outdoors setting is particularly high, 51%, the highest percentage in Finland (2013: 72%).  Membership at a health or fitness centre in Spain are at 10% and members of a club sport, are in 7%.
  • 4.  FACT SHEET – BELGIUM 47% of the Belgians play sport regularly or with some regularity. 31% never play sport. 5 Key Facts from the Eurobarometer on trends in Belgium  Belgians volunteered in sport in 2013: 9%, an increase from 2009: 8%.  The biggest barrier for Belgium is lack of time 39%, followed by lack motivation, 19%.  Belgium is the forth likely to do sport to improve health and relax with 53%, the highest Sweden (81%), and to improve fitness with 45%.  Most of the Belgians exercise from home with 38%, and on the second place are parks and outdoors, 32%, the highest percentage in Finland (2013: 72%).  Membership at a health or fitness centre in Belgium are at 11% and members of a club sport, are in 16%.  FACT SHEET – GREECE 31% of the Greeks play sport regularly or with some regularity. 59% never play sport. 5 Key Facts from the Eurobarometer on trends in Greece  Greece respondents volunteered in sport in 2013: 3%, an increase from 2009: 2%.  Greece has a big barrier in regards to performing sports and physical activity, and that is the lack of time 46% and disability or illness is only 9%.  Greece is motivated by improving the health and fitness with 56% (highest Sweden 81%) and 49%, and 19% are willing to exercise to control their weight.  Greeks prefer to exercise on the way between home and school, work or shops, with 41%, and a close percentage between those that exercise outdoors and at home, 33% and 31%.  Memberships to a sport club or fitness centre are very low in Greece, with 5%, respectively 11%.  FACT SHEET – NETHERLANDS The Duch are quite active as 58% of them play sport regularly or with some regularity. 29 % never play sport. 5 Key Facts from the Eurobarometer on trends in the Netherlands  The Netherlands ’ respondents volunteered in sport in 2013: 18%, an increase from 2009: 16%.  33% of the Duch claim that they are already doing sports regularly (spontaneous) and 29% state that they do not have time.  The Netherlands is the most likely to do sport to have fun, followed by Sweden with 44%. A high percentage of the respondents, 61%, claimed that they do it for improving health, and for fitness with 54%.  The Dutch lead with engaging in sport or physical activity at a spor t club, with 23%. Otherwise they prefer the outdoors, 37%, and exercising at home, 35%.
  • 5.  As mentioned before, the Dutch are the most likely to be part of a sport club, with 27% and 19% members of a health or fitness centre.  FACT SHEET – LITHUANIA 37% of Lithuanians are active and play sport regularly or with some regularity. 46% never play sport. 5 Key Facts from the Eurobarometer on trends in Lithuania  Lithuanians volunteered in sport in 2013: 5%, a decrease from 2009: 7%.  Lithuanians are some of the most likely to have lack of time as a barrier, 42%. The next impediment for them is the lack of motivation or interest, with 20%.Lithuania ranks 3rd in stating that doing sport is too expensive, as a barrier (17%).  What motivates Lithuania when engaging in sport of physical activity is primarily the health improvement. Another important motivator is to have fun and 42% of the respondents have agreed on this and Lithuania is on the third place with this percentage, together with Denmark.  Lithuanians are leading with 63%, exercising at home, followed by Slovakia and Slovenia with 54% and on the third place Romania with 53%. On the way between home, school, work or shops is 29% and outdoors 28%.  Respondents in Lithuania are the least likely to be part of a health fitness of centre, with 1%, and only 8% are members of a sport club.  FACT SHEET – ESTONIA 39% of Estonians are active and play sport regularly or with some regularity. 36% never play sport. 5 Key Facts from the Eurobarometer on trends in Estonia  Estonians volunteered in sport in 2013: 12%, an increase from 2009: 11%.  For Estonia, the lack of time is one of the main barriers when it comes to exercising, with 48% and on the second place for Lithuania, is having an illness or disability (17%).  What motivates Estonians the most is engaging in sport of physical activity for improving the health (55%), followed by improving fitness (41%).  Two settings Estonians prefer the most, in a park or outdoors (47%) and exercising from home (41%), with a significant percentage of 34% of those that are active on the way between home and school, work or shops.  With 12%, Estonia’s res pondents likely to be part of a club sport, with the Netherlands ranking with 27%. The least likely to be members of sport clubs are Romanians with 1%.  FACT SHEET – LUXEMBOURG 54% of Luxembourg’s respondents are active and play sport regularly or with some regularity. 29% never play sport. 5 Key Facts from the Eurobarometer on trends in Luxembourg  In Luxembourg, the respondents volunteered in sport in 2013: 13%, a Decrease from 2009: 14%.
  • 6.  For Luxembourgers , as for most of the countries, the lack of time is one of the main barriers when it comes to exercising, ranking 4th with 50%, on the same level Sweden. Lack of Motivation for Luxembourg is 23%.  What motivates Luxembourgers the most is engaging in sport of physical activity for improving the health, with a high percentage of 66%, followed by improving fitness by 49%. A significant part of the respondents, 32% chose weight control as one of the motivators.  Respondents in Luxembourg prefer to exercise, in a park or outdoors (36%) and exercising from home (35%).  With 21%, Luxembourg classifies among the countries that are likely to be part of a club sport (5th place), with the Netherlands ranking with 27%. The least likely to be members of sport clubs are Romanians with 1%.  FACT SHEET – AUSTRIA 45% of Austrians are active and play sport regularly or with some regularity. 27% never play sport. 5 Key Facts from the Eurobarometer on trends in Austria  Austrians volunteered in sport in 2013: 12%, a decrease from 2009: 15%.  In Aus tria, the percentage allocated to the bigges t barriers , s uch as lack of time and lack of motivation, aren’t staggering, with 31%, respectively 26%.  For Austrians, when doing sports, motivating is health improvement, with a significant percentage of 63%, followed by improving fitness, 40%, and having fun with 39%. Austria is also ranking first with 35% when it comes to engage in sport and physical activity to be with friends, the last one being Poland with 9%.  Austrians are third with 54% exercising outdoor, Finland being the one leading with 72% and on the second place, Slovenia with 60%. At home, 43% of Austrians prefer to exercise and at a fitness centre 19%.  Respondents in Austria are part of sport club with 13%, less than they are members of a health or fitness centre, with 16%, on the 5th place.  FACT SHEET –BULGARIA A shocking low percentage of11 % of Bulgarians say that they play sport regularly or with some regularity. 87% never play sport or do so less than once a month. 5 Key Facts from the Eurobarometer on trends in Bulgaria  A very low percent, 3%, of the respondents in Bulgaria were engaged in voluntary work that supported sporting activities in 2013 and is the same percent as in 2009.  Bulgarians ’ main reason for not living an active life is that 39% of them do not have time and 26% lack motivation and interest.  A surprisingly low proportion of respondents cite improving fitness as their motivation in Bulgaria (12%), Romania (12%) and Portugal (14%). To improve their health, Bulgaria (34%), Hungary (39%) and Romania (47%).  Most of the respondents in Bulgaria prefer exercising at home, 52%. And the rest in parks and outdoors (25%) or between home and school, work or shops (21%).
  • 7.  94% of Bulgarians are not part of any sport club and for those that are, the percentage is 2%, the same as those that are members of a health or fitness centre. They are on the second place from the bottom, Romania being the one with the smallest percentage of respondents that are members of a sport club (1%).  FACT SHEET –DENMARK A very high percentage (68 %) of Danish say that they play sport regularly or with some regularity. 14% never play sport or do so less than once a month. 5 Key Facts from the Eurobarometer on trends in Denmark  18% of the respondents in Denmark were engaged in voluntary work that supported sporting activities in 2013, higher than in 2009 when it was 15%.  If Danes don’t engage in phys ical activities it is becaus e they lack motivation (29%) and they are leading i n this regards. Another reason is of course lack of time (48%).  In Denmark, improving one’s s elf-esteem is a fairly common motivating factor (29%), as well as controlling one’s weight (43%), the same as Sweden.  The proportion engaging in sport or physical activity in a park and outdoors is particularly high in Denmark (50%) and the highest in Finland (47%). 22% of the respondents go to a sports club in Denmark.  In Denmark, it is fairly common to be part of a socio-cultural club that includes sport in its activities with 9%, but the highest numbers are for those who join a sport club and health or fitness centre (25%).  FACT SHEET –POLAND Only 28 % of Polish say that they play sport regularly or with some regularity. 52% never play sport or do so less than once a month. 5 Key Facts from the Eurobarometer on trends in Poland  3% of the respondents in Poland were engaged in voluntary work that supported sporting activities in 2013, higher than in 2009 when it was 2%.  In Poland, people don’t practice s port becaus e they lack time 46%, but also interest (14%).  In Poland it is common to relax by doing sports (16%) and the strongest motivation is to improve the health with 59%.  The proportion engaging in sport or physical activity at home is the highest for Poland when talking about settings with 37%, followed by park and outdoors with 35%. The highest is in Finland (47%).  The percentages in Poland are pretty low when it comes to memberships, with only 3% going for sport clubs and 6% for health or fitness centre.  FACT SHEET –PORTUGAL Only 28 % of the Portuguese play sport regularly or with some regularity and 64 % never play sport or do so less than once a month.
  • 8. 5 Key Facts from the Eurobarometer on trends in Portugal  2% of the respondents in Portugal were engaged in voluntary work that supported sporting activities in 2013, the same as in 2009.  Portugal has the highest percentage among the European countries, when it comes to the price barrier when practicing sport regularly (it is too expensive), with 19%. Moreover, the main one is the lack of time, with 33% and lack of motivation with 26%.  In Portugal, the highest figure when it comes to motivators, is improving the health, with 67%, followed by the desire to relax (32%).  The Portuguese prefer to go out and exercise in parks or other outdoors settings with 44%, as well as on the way to school, home, work or shops (25%).  Most of the respondents in Portugal would be part of a health or fitness centre in proportion of 6% and memberships at the club are only 4%.  FACT SHEET – CROATIA 35 % of the Croatians play sport regularly or with some regularity and only 29 % never play sport or do so less than once a month. 5 Key Facts from the Eurobarometer on trends in Croatia  8% of the respondents in Croatia were engaged in voluntary work that supported sporting activities in 2013.  In Croatia 8% of the people see a lack of suitable or accessible sport infrastructure as a problem.  With 58 % of the population thinking that the local authorities does not do enough for its citizens in relation to physical activity Croatia are the most unsatisfied in the European Union.  Croatians prefer to go out and exercise on the way to school, home, work or shops with 44%, as well as in parks or other outdoors settings (30%)  Most of the respondents in Croatia would be part of a health or fitness centre in proportion of 7% and memberships at the club are 10%.  FACT SHEET – FRANCE With 56% France is among the European countries with the highest proportions of the population who do vigorous physical activity for more than an hour only, second only to Estonia (58%). 5 Key Facts from the Eurobarometer on trends in France  A mere 5% of the French do their sport or physical activity in a health- or fitness centre  French people’s main reason for not living an active life is that 42% of them do not have time and 24% lack motivation and interest.  What motivates the French most is engaging in sport of physical activity for improving the health (55%), closely followed by improving fitness (54%).
  • 9.  Respondents in France prefer to exercise, in a park or outdoors (42%) and exercising at home (27%).  With 16%, France’s active res pondents are most likely to be part of a s ports club, with the Netherlands ranking one with 27%. The least likely to be members of sport clubs are Romanians with 1%.  FACT SHEET – LATVIA 31% of Latvians are active and play sport regularly or with some regularity. 39% never play sport. 5 Key Facts from the Eurobarometer on trends in Latvia  Latvians volunteered in sport in 2013: 8%, a decrease from 2009: 13%.  Latvians are some of the most likely to have lack of time as a barrier, 47%. The next impediment for them is the lack of motivation or interest, with 19%.Latvia ranks 12th along with the UK in stating that doing sport is too expensive, as a barrier (11%).  What motivates Latvians when engaging in sport of physical activity is primarily the health improvement (62%). Another important motivator is to improve fitness with 38% of the respondents have agreed on this ..  With 26% Latvians are leading respondents exercising at work, followed by Estonia with 20% and on the shared third place Lithuania and the Czech Republic with 19%.  Respondents in Latvia are the 2nd least likely to be members of any club along with Hungary (89%). Only Bulgaria has fewer club members with 94% not being members of any club.  FACT SHEET – CYPRUS 36% of Cypriots are active and play sport regularly or with some regularity. 54% never play sport. 5 Key Facts from the Eurobarometer on trends in Cyprus  Cypriots volunteered in sport in 2013: 5%, a small increase from 2009 where it was 4%.  Cypriots are some of the most likely to have lack of time as a barrier for physical activity, 49%. The next impediment for them is the lack of motivation or interest, with 20%. Cyprus ranks 2nd, only surpassed by Portugal, in stating that doing sport is too expensive, as a barrier (18%).  What motivates Cypriots when engaging in sport of physical activity is primarily the health improvement (73%). Another important motivator is to improve fitness with 48% of the respondents have agreed on this .  Respondents in Cyprus prefer to exercise at home (36%) and to exercise in a park or outdoors (33%)  The percentages in Cyprus are pretty low when it comes to memberships, with only 6% going for sport clubs and 9% for health or fitness centre.  FACT SHEET – GERMANY 48% of Germans are active and play sport regularly or with some regularity. 29% never play sport.
  • 10. 5 Key Facts from the Eurobarometer on trends in Germany  Germans volunteered in sport in 2013: 10%, a small increase from 2009 where it was 9%.  Germans are most likely to have lack of time as a barrier of doing sports or physical activity, 38%. The next impediment for them is the lack of motivation or interest, with 23%.  What motivates Germans when engaging in sport of physical activity is primarily the health improvement (71%). Another important motivator is to improve fitness with 43% of the respondents have agreed on this .  Respondents in Germany prefer to exercise at home (46%) and to exercise in a park or outdoors (42%)  Respondents in Germany are ranked 3rd in being likely to be members of any club (24 %). Only Holland and Denmark have more members with 27 % and 25 % respectively. ***  FACT SHEET – IRELAND 52% of the Irish are active and play sport regularly or with some regularity. 34% never play sport. 5 Key Facts from the Eurobarometer on trends in Ireland  The Irish volunteered in sport in 2013: 15%, a small increase from 2009 where it was 14%.  Irishmen are most likely to have lack of time as a barrier of doing sports or physical activity, 44%. The next impediment for them is the lack of motivation or interest and having a disability or illness, both with 11%.  What motivates the Irish when engaging in sport of physical activity is primarily the health improvement (71%). Another important motivator is to improve fitness with 47% of the respondents have agreed on this.  Respondents in Ireland prefer to exercise in a park or outdoors (44%) and secondly to exercise at home (27%)  19% of the Irish population is likely to be members of a sports club and 15 % of a health- or fitness centre.  FACT SHEET – MALTA 19% of the Maltese are active and play sport regularly or with some regularity. 75% never play sport. 5 Key Facts from the Eurobarometer on trends in Malta  The Maltese volunteered in sport in 2013: 4%, a massive decrease from 2009: 8%.  People in Malta are most likely to have lack of time as a barrier of doing sports or physical activity, 56%. The next impediment for them is the lack of motivation or interest, with 28%.  What motivates the Maltese when engaging in sport of physical activity is primarily the health improvement (70%). Another important motivator is both to relax and to control their weight with 43%.
  • 11.  Respondents in Malta prefer to exercise on the way between home and school, work or shops (36%) and to exercise in a park or outdoors (29%).  Only 6% of the Maltese population is likely to be members of a sports club while 7 % would be member of a health- or fitness centre.  FACT SHEET – ROMANIA 21% of the Irish are active and play sport regularly or with some regularity. 60% never play sport. 5 Key Facts from the Eurobarometer on trends in Romania  Romanians volunteered in sport in 2013: 3%, a small decrease from 2009 where it was 4%.  People in Romania are most likely to have lack of time as a barrier of doing sports or physical activity, 53%. The next impediment for them is the lack of motivation or interest, with 13%.  What motivates Romanians when engaging in sport of physical activity is primarily the health improvement (47%). Another important motivator is to relax with 24% of the respondents have agreed on this .  Respondents in Romania prefer to exercise at home (53%) and secondly to exercise on the way between home and school, work or shops (24%)  With only 1% respondents in Romania are least likely to be members of a sports club.  FACT SHEET – FINLAND 66% of the Finns are active and play sport regularly or with some regularity. 15% never play sport. 5 Key Facts from the Eurobarometer on trends in Finland  Finns volunteered in sport in 2013: 13%, a massive decrease from 2009: 18%.  The Finnish are most likely to have lack of time as a barrier of doing sports or physical activity, 32%. The next impediment for them is having a disability or illness, with 24%.  What motivates Finns when engaging in sport of physical activity is primarily the health improvement (69%). Another important motivator is to improve fitness with 61% of the respondents have agreed on this .  Respondents in Finland prefer to exercise in a park or outdoors (72%) and to exercise on the way between home and school, work or shops (47%)  Only 12% of the Finnish population is likely to be members of a sports club while 13 % would be member of a health- or fitness centre.