
Recommended
More Related Content
Similar to Fixing amber time and calculating minimum all red time
Similar to Fixing amber time and calculating minimum all red time (20)
Recently uploaded
Recently uploaded (20)
Fixing amber time and calculating minimum all red time
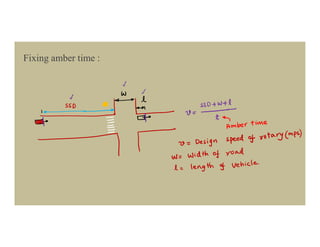
- 1. Fixing amber time :
- 2. Fixing amber time / all red time A driver travelling at the speed limit of 50 kmph was cited for crossing an intersection. He claimed that the duration of the amber display was improper and consequently, a dilemma zone existed at that location. Using the following data determine whether the driver’s claim was correct? Amber duration = 4.5 sec Perception reaction time = 1.5 sec Comfortable deceleration = 3 m/sec2 Car length = 4.6 m Intersection width = 15 m Calculate minimum all red time required? (ESE-CE-95)
- 4. Traffic Signals • Pedestrian Signals
- 5. Road Markings • Carriage way Markings • Intersectional Markings • Harzardous Location Markings • Marking for Parking • Word Messages • Object Marking Road Shoulder Line Bus Lane Bus Lane Centreline Marking Kerb Marking
- 6. Road Markings • Carriage way Markings • Intersectional Markings • Harzardous Location Markings • Marking for Parking • Word Messages • Object Marking Stop Line Directional arrows Give Way Line
- 7. Road Markings • Carriage way Markings • Intersectional Markings • Harzardous Location Markings • Marking for Parking • Word Messages • Object Marking
- 8. Road Markings • Carriage way Markings • Intersectional Markings • Harzardous Location Markings • Marking for Parking • Word Messages • Object Marking
- 9. Road Markings • Carriage way Markings • Intersectional Markings • Harzardous Location Markings • Marking for Parking • Word Messages • Object Marking
- 10. Road Markings • Object Marking
- 12. Traffic engineering Q. Vehicles arriving at an intersection from one of the approach roads follows the Poisson distribution. The mean rate of arrival is 900 vehicles per hour. If a gap is defined as the time difference between two successive vehicle arrivals (with vehicles assumed to be points), the probability (up to four decimal places) that the gap is greater than 8 seconds is ________ (GATE – 17 – Set 1)
- 13. Traffic engineering Traffic on a highway is moving at a rate of 360 v/h at a location. If the number of vehicles arriving on this highway follows negative poisons distribution, the probability (rounded to 2 decimal places) that the head way between successive vehicles lies between 6 and 10 sec is …… (GATE – 19– Set 1)
- 14. Shock wave
- 15. Shock wave Traffic Stream Models (Macroscopic models)
- 16. The relationship between flor tate of traffic and density is shown in figure The shock wave condition is depicted by a) Flow with respect to point 4 and 5 are equal b) Flow at 3 is less than flow at 7 c) Flow with respect to point 1 is equal to max flow d) Flow at 2 is more than flow at 6 Example on shock wave
- 17. A well designed signalised intersection is one in which GATE 18 a) Crossing conflicts are increased b) Total delay is minimised c) Cycle time is equal to the sum of red and green times in all phases d) Cycle time is equal to the sum of red and yellow times in all phases Design of intersections
- 18. Design parameters for a signalised intersection are shown in figure below The green time calculated for major and minor roads are 34 sec and 18 sec respectively The critical lane volume on the major road changes to 440 vehicles per hour per lane and the critical lane volume on the minor road remains unchanged, the green time will be GATE 08 a) Increases for the major road and remains constant for minor road b) Increases for the major road and decreases for the minor road c) Decreases for both the roads d) Remains unchanged for both the roads Traffic signals
- 19. 04. Consider the following situations: 1. Traffic volume entering from all roads is less than 3000 vehicles per hour 2. Pedestrian volume is high 3. Total right turning traffic is high 4. A road in a hilly region A rotary will be more suitable than control by signals, in situations listed against (ESE – 1995) (a) 1 and 3 (b) 1 and 4 (c) 2 and 4 (d) 2 and 3 Problem on Rotary deisgn
- 20. 08. Consider the following parameters related to a rotary intersection: 1. Width of the weaving section 2. Length of the weaving section 3. Proportion of weaving traffic 4. Weaving angle 5. Width of the carriageway at entry Capacity is generally expressed in terms of (ESE – 1997) (a) 1, 2, 3 and 4 (b) 1, 2, 3 and 5 (c) 1, 2 and 3 (d) 4 and 5 Problem on rotary intersections
- 21. Q. Assertion (A): IRC suggest that the maximum volume of traffic of 3000 vehicles per hour entering from all legs of the rotary intersection can be handled efficiency Reason (R): Traffic rotaries may be provided where the intersecting traffic is about 50% of the total traffic or fast turning traffic is at least 30% of the total traffic (ESE-1999) Codes: (a) Both A and R are true and R is the correct explanation of A (b) Both A and R are true but R is not a correct explanation of A (c) A is true but R is false (d) A is false but R is true Problem on rotary intersections
- 22. Q. Based on ‘30th hour volume’ for how much per cent time during the year can the designer willingly tolerate the unfavorable operating conditions? (ESE-2002) (a) 30 (b) 29 (c) 2.5 (d) 0.33 Design hourly volume (30H)
- 23. Q. Which of the following factors are not strictly related to design of traffic rotary intersections? 1. Radius of central island 2. Weaving length 3. Ramps and interchanges 4. Acceleration lanes Select the correct answer using the codes given below: (ESE-2008) (a) 1and 2 (b) 1 and 4 (a) (c) 2 and 3 (d) 3 and 4 Rotary intersections
- 24. Purpose: 1. To study the causes of accidents and suggest corrective measures at potential location 2. To evaluate existing design 3. To compute the financial losses 4. To suggest improvements Accident studies
- 25. Causes of road accidents Road users Vehicle Road conditions Road design Environmental factors Other causes: like improper location of ad boards, level crossing not closed, parked vehicles, mobile phone etc. Accident studies
- 26. Accident statistics Location Details of vehicles involved Nature of accidents Primary causes of accident Accident cost Accident studies
- 28. Accident investigation • Reporting • Scene investigation • Technical presentation • Professional reconstruction • Cuase analysis • Accident data analysis Accident studies
- 29. 06. Consider the following statements: Collision diagram is used to 1. study accident pattern 2. eliminate accidents 3. determine remedial measures 4. make statistical analysis of accidents Which of these statements are correct? (ESE – 1996) (a) 1 and 2 (b) 1 and 3 (c) 3 and 4 (d) 2 and 4 Problem on accident studies
- 30. Problem on accident studies
- 31. Q A vehicle of 20kN skids through a distane equal to 40 before coliding with another parked vehicle of weight 10kN. After collision both the vehicles skid through a distance equal to 12m before stopping. What is the initial velocity of the moving vehicle. f=0.5 Problem on accident studies
- 32. Problem on accident studies
- 33. Problem on accident studies