
Recommended
Recommended
More Related Content
What's hot
What's hot (20)
Similar to Avoid overfitting in precision medicine: How to use cross-validation to reliably estimate subgroup effects
Similar to Avoid overfitting in precision medicine: How to use cross-validation to reliably estimate subgroup effects (20)
Recently uploaded
Recently uploaded (20)
Avoid overfitting in precision medicine: How to use cross-validation to reliably estimate subgroup effects
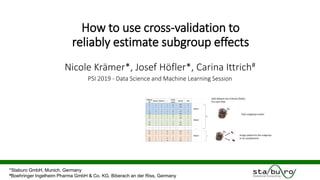
- 1. How to use cross-validation to reliably estimate subgroup effects Nicole Krämer*, Josef Höfler*, Carina Ittrich# PSI 2019 - Data Science and Machine Learning Session *Staburo GmbH, Munich, Germany #Boehringer Ingelheim Pharma GmbH & Co. KG, Biberach an der Riss, Germany
- 2. The goals of our presentation are to … … make you aware how strongly subgroup identification methods can overfit, … explain how cross-validation can help to obtain more realistic subgroup effects. … show in simulations that cross-validation leads to more accurate estimates for subgroup effects. …illustrate how you can apply cross-validated subgroup effects in a clinical trial. 1 It is not our goal to find good or bad subgroup identification methods. discuss the usefulness of subgroup identification in general.
- 3. (Hypothetical) case study • Randomized phase II trial comparing treatment A and B in a parallel design. • Endpoint: Progression-free survival • Relative treatment benefit: hazard ratio (A versus B) • Biomarker • Solid evidence: Expression level of gene SLDEV • Exploratory: expression levels of 50 genes Trial population (n=200) Treatment A Treatment B 100 patients 100 patients How to identify a subgroup based on these biomarkers? Modified „Breast“ dataset from the R package biospear.
- 4. • In this case, subgroup identification often corresponds to finding a cutoff c and a direction. • Popular strategy: Go through a list of cut-offs and find the „best one“. a) Minimize the interaction p-value b) Minimize min(HR<=c,HR>c) c) Maximize the partial log-likelihood from the interaction model d) …. Important (boring?) example: one continuous biomarker 1 Typically, a constraint is added to ensure that the subgroups are sufficiently large. Do we really believe that the true hazard ratio is 0.53?? In this example, the cut-off leads to the smallest interaction p-value (criterion a).
- 5. Foster, J. C., Taylor, J. M., & Ruberg, S. J. (2011). Subgroup identification from randomized clinical trial data. Statistics in medicine, 30(24), 2867-2880 1. In each treatment arm, model the probability of a response (e.g. via random forests) 2. For each patient, predict the probability of a response 3. Define predicted relative treatment benefit: 𝑓𝐴 − 𝑓𝐵. 4. Learn classification tree on predicted relative treatment benefit. Another example: The Virtual Twin Method 𝑌 = 𝑓𝐴 𝐵1, … , 𝐵𝑝, 𝑋1, … , 𝑋 𝑘 𝑌 = 𝑓𝐵 𝐵1, … , 𝐵𝑝, 𝑋1, … , 𝑋 𝑘 𝑓𝐴 𝐵1,… , 𝐵𝑝, 𝑋1, … , 𝑋 𝑘 Response under treatment A Biomarker 𝐵1, … , 𝐵𝑝 Other characteristica 𝑋1, … , 𝑋 𝑘 𝑓𝐵 𝐵1,… , 𝐵𝑝, 𝑋1,… , 𝑋 𝑘 Response under treatment B „Virtual twin“
- 6. Formalization: What is a subgroup identification method? 1 Training data New patient Image source: www.maxpixel.net
- 7. The cross-validated subgroup assignment • After cross-validation, each patient has a cross-validated subgroup assignment. 1 Split dataset into k blocks (folds). For each fold: (k) Train subgroup model (k) Assign patient to the subgroup or its complement
- 8. • After cross-validation, each patient has a cross-validated subgroup assignment. • The cross-validated relative treatment benefit (e.g. hazard ratio) is the relative treatment benefit in the cross-validated subgroup. How to estimate the relative treatment benefit? 1 Cross-validation step 1 2 3 4 5 6 7 8 9 10 Selected cut-off 1.18 0.99 0.88 0.86 0.98 1.13 0.86 0.86 0.98 0.84 Direction ≤ ≤ ≤ ≤ ≤ ≤ ≤ ≤ ≤ ≤
- 9. What does the literature say? • Many papers on subgroup identification methods ... evaluate if the method is able to detect the „correct“ subgroup (e.g. sensitivity, specificity) but do not evaluate if the subgroup effect is correctly estimated. • But in general, there is a lot of work on subgroup effect estimation. However, many papers (only) consider the setting where there is a pre-defined set of subgroups. Bootstrap approaches are most similar to the proposed cross-validation approach. • Combining subgroup identification and cross-validation is not new! Freidlin, B., Jiang, W. and Simon, R., 2010. The cross-validated adaptive signature design. Clinical Cancer Research, 16(2), pp.691-698. Matsui, S., Simon, R., Qu, P., Shaughnessy, J.D., Barlogie, B. and Crowley, J., 2012. Developing and validating continuous genomic signatures in randomized clinical trials for predictive medicine. Clinical Cancer Research, 18(21), pp.6065-6073. 1
- 10. Simulation study I - univariate cut-off search • Two-arm clinical trial (1:1 allocation ratio) with endpoint progression-free survival • One continuous biomarker with relationship hazard ratio <-> biomarker a) Linear predictive effect b) Step-wise predictive effect c) No predictive effect • Simulation of training data (n=75, 150, 300) and test data (n=1000) (1000 times) 1 Training set (n=75, 150, 300) 1. Optimize cut-off c by minimizing interaction p-value. 2. Compute 𝑯𝑹 𝒕𝒓𝒂𝒊𝒏 of the identified subgroup. (> c or ≤ c) 3. Compute cross-validated hazard ratio ratio 𝑯𝑹 𝑪𝑽 (using 10-fold cross-validation) Test set (n=1000) 4. Compute 𝑯𝑹 𝒕𝒆𝒔𝒕 based on the cut-off c and the direction. (> c or ≤ c)
- 11. Results: n=150, linear effect 1
- 12. Results – comparison HRtrain / HRtest 1
- 13. Results – comparison HRCV / HRtest 1
- 14. Simulation study II – Virtual Twin Method Binary endpoint (response yes/no) n=1000 (!) patients 15 normally distributed variables The true subgroup is defined by the first two variables. 1 (Simulation setting from the paper)
- 15. Summary of the simulation studies • The simulations indicate that the ‘naïve’ subgroup effects lead to substantial overfitting. overfitting also occurs for large sample sizes. on average, cross-validated subgroup effects are a good estimate of the subgroup effects on an independent test set. • However, results are quite variable. Both the cross-validated as well as the test set effects vary substantially. Further simulations indicate that the variability may also be due to the variability of the subgroup detection methods. 1
- 16. Let us go back to our case study … • The goal is to define a subgroup based on the expression level of p=50 genes. • Approach: Multivariate Cox proportional hazard model ℎ 𝑡 = ℎ0(𝑡) ∙ 𝑒𝑥𝑝 𝛽 𝑇 ∙ 𝑇 + 𝑗=1 𝑝 𝛽𝑗,𝑋 ∙ 𝑋𝑗 + 𝑗=1 𝑝 𝛽𝑗,𝐼 ∙ 𝑋𝑗 ∙ 𝑇 1 Treatment effect Biomarker effect Biomarker-dependent treatment effect 1) Fit the model using regularized regression (here, Ridge regression) 2) Obtain a signature S via 𝐻𝑅 𝐴 𝑣𝑠 𝐵 = 𝑒𝑥𝑝 𝛽 𝑇 + 𝑗=1 𝑝 𝛽𝑗,𝐼 ∙ 𝑋𝑗 3) Cut-off: At the median value of S (could be optimized as well) = - S
- 17. Results for the predictive signature (leave-one out validation) 1 Other measures of interest may be cross-validated as well…
- 18. Summary • For many data-driven subgroup identification algorithms, the estimated treatment effects are too optimistic (“overfitting”). • This is also the case for seemingly simple examples (e.g. cut-off detection) and large sample sizes (e.g. n=1000 for p=15 variables). • It is important to obtain more realistic estimates. • The investigated framework may be applied to all endpoint types and any subgroup identification algorithm. • On average, the simulations indicate that the cross-validated relative treatment benefit is a good estimate of the true relative treatment benefit. 1
- 19. Biostatistical services at Staburo Clinical Statistics Translational Medicine & Biomarkers Statistical Programming with CDISC Pharmacokinetics/- dynamics Health Technology Assessment Non-clinical Statistics
- 20. Subgroup effects: training set, cross-validation and test set 1
- 21. A small simulation • Randomly permute the endpoint (time,status) within each treatment arm. In this way, the relationship biomarker <--> relative treatment benefit is broken. • Find the cut-off that minimizes the interaction p-value 1 Hazard ratio in the trial population
- 22. Simulation study II – Virtual Twin Method Binary endpoint (response yes/no) n=1000 (!) patients 15 normally distributed variables True subgroup is defined by the first two variables 1 (Simulation setting from the paper)
- 23. Mok TS, Wu Y-L, Thongprasert S, et al. Gefitinib or carboplatin-paclitaxel in pulmonary adenocarcinoma. N Engl J Med. 2009;361(10):947-957 Properties of baseline variables A variable is predictive if the relative treatment benefit (experimental vs. control) depends on the biomarker. “Potential patient selection marker”
- 24. Properties of baseline variables A variable is prognostic if it informs about a likely outcome in absence or irrespective of treatment received. Note: Most often, this is only investigated in the control arm. (“Placebo”? “Standard of care”?) Within each treatment arm, EGFR positive patients do better compared to EGFR negative patients. Note: In the recent FLAURA trial, the control treatment was Gefitinib / Erlotinib (and was compared to Osimertinib).
- 25. Predictive effects and interaction models odds = rate 100 − rate odds ratio = relative treatment benefit 𝑙𝑜𝑔 𝑃(𝑌 = 1) 1 − 𝑃(𝑌 = 1) = 𝛽0 + 𝛽 𝑇 ∙ 𝑇 + 𝛽 𝐵 ∙ 𝐵𝑀 + 𝛽𝐼 ∙ 𝑇 ∙ 𝐵𝑀 Odds ratio .. … for a biomarker positive patient: exp(𝛽 𝑇 + 𝛽𝐼) … for a biomarker negative patient: exp(𝛽 𝑇) The biomarker is predictive if 𝛽𝐼 ≠ 0.
Editor's Notes
- RS