
Recommended
More Related Content
Recently uploaded
Recently uploaded (20)
Featured
Featured (20)
PBC's main indicators - Q1-2018
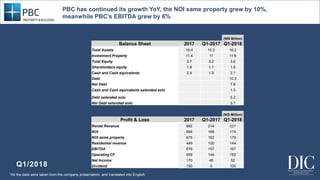
- 1. Q1/2018 (NIS Billion) Balance Sheet 2017 Q1-2017 Q1-2018 Total Assets 16.4 15.3 16.2 Investment Property 11.4 11 11.6 Total Equity 3.7 3.2 3.6 Shareholders equity 1.8 1.7 1.8 Cash and Cash equivalents 2.9 1.9 2.7 Debt 10.3 Net Debt 7.6 Cash and Cash equivalents extended solo 1.5 Debt extended solo 5.2 Net Debt extended solo 3.7 (NIS Million) Profit & Loss 2017 Q1-2017 Q1-2018 Rental Revenue 882 214 221 NOI 694 166 174 NOI same property 675 162 179 Residential revenue 449 100 144 EBITDA 676 157 167 Operating CF 589 144 182 Net Income 170 48 52 Dividend 150 0 100 PBC has continued its growth YoY, the NOI same property grew by 10%, meanwhile PBC’s EBITDA grew by 6% *All the data were taken from the company presentation, and translated into English