1. Abstract
This study aims to express the relationship between
points and areas of community organizations with
that of various crime types in the New Haven,
Connecticut area. The backdrop of the study is
Social Disorganization Theory, which states that
criminal activity is caused by a breakdown and/or
lack of a number of ecological factors, such as
schools, churches and the physical condition of an
area. New Haven crime data was taken from the
police department. ESRI’s ArcGIS software was
employed to geographically analyze the data sets.
On a visual level, it can be observed that hot spots
for various types of crime gravitate towards more
socially disorganized neighborhoods.
Introduction
Social Disorganization Theory is a criminological
approach that emphasizes how environmental factors
affect how and what crimes happen in a given area. The
theory focuses on how a lack of social institutions break
down the solidarity within them. This degraded bond to
the community leads individuals to commit crime in
their respective area. Levels of poverty, ethnogenic
variability, and residential instability in these areas are
thus exceptionally high and serve to perpetuate high
rates of criminality (Brantingham & Brantingham, 1984).
These issues persist as underlying long term causes of
crime and are very rarely addressed in primarily inner
city communities (Wilson, 1987).
Method
Data from the New Haven Police Department were
first obtained, containing all crimes reported to the
police department for the year of 2015. Included in
the data were the street address and type of crime
for each specific call. Using an address locator that
allows various locations to be plotted on a map grid
on the New Haven area, all of the data were fed
through the program to display the approximately
65,000 crime reports for 2015. Once plotted, the
crimes were able to be individualized based upon the
specific type of crime. In this case, murder, burglary,
aggravated assault, emotionally disturbed, and
robbery were utilized for analysis as they represent a
the overarching theme of violent offenses and are
generally well reported. Of the data given, we were
also able to plot points of churches, police stations,
and school areas as representations of social order.
Analysis
Conclusion
Although statistical data not yet processed, it is visible at a
visual level that there is an evident union between areas of
high social disorganization and respective crime levels.
These conclusions are, however, in no way perfect.
Foremost, the data leave out crimes that have not been
reported to the police and therefore can obfuscate the true
ecological nature of a crime. This phenomenon is more
evident with crimes such as sexual assault, which are
generally under-reported. Furthermore, crime incident
locations that lacked a specific street address could not be
effectively entered into ArcGIS which excluded some
particular crimes. The observations do, however, point
towards addressing such long term issues in communities
in order to reduce criminality.
References
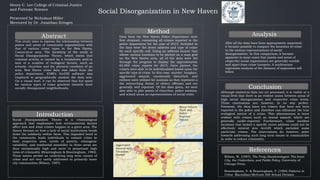
Aggravated
Assault with
Churches
Plotted
Henry C. Lee College of Criminal Justice
and Forensic Science
Presented by Nicholaus Miller
Mentored by Dr. Jonathan Kringen
Social Disorganization in New Haven
Wilson, W. (1987). The Truly Disadvantaged: The Inner
City, the Underclass, and Public Policy. University of
Chicago Press.
Brantingham, P. & Brantingham, P. (1984) Patterns in
Crime. Macmillan/McGraw-Hill School Division.
After all the data have been appropriately separated,
it became possible to compare the locations of crime
to the various representations of social
disorganization. In this comparison, it became
apparent in most cases that points and areas of
respective social organization are generally outside
and apart from crime hotspots. A multivariate
regression analysis of the distance of separation will
follow.
Motor Vehicle
Theft with
Police
Stations
Plotted