
Recommended
More Related Content
What's hot
What's hot (16)
Similar to Topic 7 perfect competition revision (3)
Similar to Topic 7 perfect competition revision (3) (16)
Recently uploaded
Recently uploaded (20)
Topic 7 perfect competition revision (3)
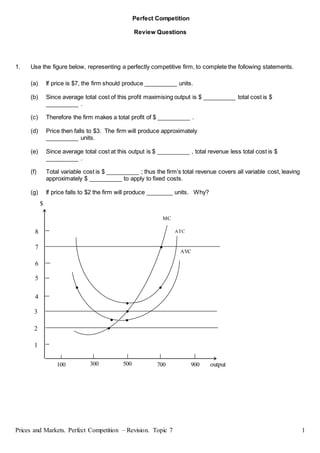
- 1. Prices and Markets. Perfect Competition – Revision. Topic 7 1 Perfect Competition Review Questions 1. Use the figure below, representing a perfectly competitive firm, to complete the following statements. (a) If price is $7, the firm should produce __________ units. (b) Since average total cost of this profit maximising output is $ __________ total cost is $ __________ . (c) Therefore the firm makes a total profit of $ __________ . (d) Price then falls to $3. The firm will produce approximately __________ units. (e) Since average total cost at this output is $ __________ , total revenue less total cost is $ __________ . (f) Total variable cost is $ __________ ; thus the firm’s total revenue covers all variable cost, leaving approximately $ __________ to apply to fixed costs. (g) If price falls to $2 the firm will produce ________ units. Why? $ 8 7 6 5 4 3 2 1 output 100 300 500 700 900 MC ATC AVC
- 2. Prices and Markets. Perfect Competition – Revision. Topic 7 2 2. A small scale grower supplies tomatoes to local fruit shops. Fixed costs facing the grower are $100, and the variable cost data is given in the table below: Output (Q) Total Variable Cost (TVC) 50 100 60 110 70 130 80 160 90 200 100 250 110 310 120 380 (a) For the output and cost figures given above, calculate the average variable cost (AVC) and marginal cost (MC). (b) Assume the grower operates under perfectly competitive conditions, and the price he receives is currently $6 per kilogram. Determine the output level that would maximise the grower’s profits. What are profits at this output level? (c) If, due to an influx of new competition, the price of tomatoes falls to $3 per kilogram, explain whether the grower should continue to produce in the short run and in the long run. 3. Using a perfectly competitive firm operating in the short run as a basis for your diagram, show and explain the prices associated with the break even and shut down points, and explain the output ranges over which the firm produces to make a positive economic profit and/or to minimise economic losses. 4. In long-run equilibrium, P = AC = MC. Of what significance for the allocation of resources is the equality of MC and AC? Of what significance for the allocation of resources is the equality of P and MC? 5. Using a perfectly competitive firm operating in the short run as a basis for your diagrams, show and explain how the firm can make economic profit, normal profit and minimum economic loss; and show also the break even and shut down points.
- 3. Prices and Markets. Perfect Competition – Revision. Topic 7 3 6. A perfectly competitive firm producing X has the following monthly cost data (Q = total output, MC = marginal cost): Q (units) MC ($) 1 40 2 37 3 32 4 28 5 30 6 32 7 35 8 40 9 46 10 56 (a) For each of the following prices determine this firm’s optimal output per month in the short run. Show your calculations. (i) $30.50 (ii) $32.40 (iii) $42.00 (b) Suppose the market price of X is $49.00. Calculate the total fixed cost that would result in zero economic profit for this firm. Show your calculations. (c) Suppose there are 400 firms in the perfectly competitive market for X, each with the same monthly cost data as the above firm. Draw this market’s short run supply curve, indicating the specific prices and quantities of output, on the assumption that the cost data are not affected by the summation of the firms’ outputs. (d) Suppose the market price of X is $60.00 and the total fixed cost of the above firm is $140 per month. (i) Initially, how would this firm react to the situation in the long run? Explain with the aid of your calculations. (ii) With the aid of diagrams (sketches will be sufficient – there is no need to plot the exact data) showing both the firm and the market, explain how this market adjusts to long run equilibrium.
- 4. Prices and Markets. Perfect Competition – Revision. Topic 7 4 7. A perfectly competitive firm has the following cost data: Q AFC TVC (units per day) ($) ($) 1 90 20 2 45 36 3 30 49 4 22.50 60 5 18 73 6 15 88 7 12.86 106 8 11.25 129 9 10 159 10 9 199 (a) For each of the following prices determine this firm’s profit-maximising (or loss-minimising) output per day, in the short run, and calculate the daily profit or loss. Show your calculations. (a.1) $13.20 (a.2) $16.50 (a.3) $39.00 (b) Draw this firm’s short run supply curve, indicating the relevant numerical values for price and output. (c) Suppose this firm’s costs are the same as those of other firms in the perfectly competitive industry. Indicate, together with a brief explanation, the numerical value of the critical price level below which this firm will leave the industry in the long run, and above which new firms will enter that industry in the long run.
- 5. Prices and Markets. Perfect Competition – Revision. Topic 7 5 8. A perfectly competitive firm producing X has the following monthly cost data (Q = total output, MC = marginal cost): Q (units) MC ($) 1 40 2 37 3 32 4 28 5 30 6 32 7 35 8 40 9 46 10 56 (a) For each of the following prices determine this firm’s optimal output per month in the short run. Show your calculations. (a.i) $30.50 (a.ii) $32.40 (a.iii) $42.00 (b) Suppose the market price of X is $49.00. Calculate the total fixed cost that would result in a normal profit for this firm. Show your calculations. (c) Suppose there are 400 firms in the perfectly competitive X industry, each with the same monthly cost data as the above firm. Draw this industry’s short run supply curve, indicating the specific prices and quantities of output, on the assumption that the cost data are not affected by the summation of the firms’ outputs. (d) Suppose the market price of X is $44.00 and the total fixed cost of the above firm is $140 per month. How will this firm react to this situation in the long run? Explain with the aid of your calculations.