1. Alkali Halide Salts Dissolved in Non-ionic Surfactants studied by 23Na, 81Br, and 87Rb
Nuclear Magnetic Resonance Spectroscopy
Morgan E. Wilson, Leeza M. Kerr, Markus M. Hoffmann*
Polyethylene glycol (PEG) has been recognized as a green
solvent medium for chemical synthesis and processing. In
contrast to traditional organic solvents, mineral salts can be
dissolved in PEG. However, not much is established about how
the salts that are dissolved interact with PEG. The spin-lattice
relaxation time (T1) and thus the linewidth of quadrupolar nuclei
are sensitive to the presence of electric field gradients, which is
expected to be present when ion pairs are formed. NMR spectral
data are presented for 0.075 molal salt solutions with varying
compositions of water with PEG as well as other PEG related
surfactants expressed in % volume by surfactant. The figure
captions summarize our main preliminary findings. In addition,
for some of the salts a gel-like phase separation (solubility gap)
was observed for certain solvent composition ranges that at
present we have not experimentally established yet.
Abstract:
Acknowledgements:
The College at Brockport, SUNY, Post-Tenure Award
Rochester Midland Corporation
for providing PEG-200 and the
surfactants.
0
5
10
15
20
25
30
0 20 40 60 80 100
Linewidth(ppm)
% by volume surfactant
PEG
C10E6
C10E7P2
5197051975 ppm
10 %vol PEG
20 %vol PEG
30 %vol PEG
40 %vol PEG
50 %vol PEG
60 %vol PEG
70 %vol PEG
80 %vol PEG
90 %vol PEG
0
50
100
150
200
250
0 20 40 60 80 100
Linewidth(ppm)
% by volume surfactant
0
5
10
15
20
25
30
35
40
45
50
0 5 10 15 20 25 30
Linewidth(ppm)
% by volume surfactant
NaBr in PEG
NaBr in C10E6
RbBr in C10E6
Figure 2: 23Na NMR linewidth in ppm of 0.075 molal NaBr as a
function of mixed solvent composition of water and PEG-200,
C10E6, or C10E7P2. For both PEG-200 and C10E6, the Na peak
broadened as the volume percent of surfactant increased from 0% to as
high as 100% (neat). Neat NaBr in C10E7P2 showed a 200% increase
in linewidth compared to neat NaBr in PEG-200 (25.8 ppm and 12.9
ppm, respectively).
Figure 3: 81Br NMR linewidth in ppm of 0.075 molal NaBr in
PEG and C10E6 and 0.075 molal RbBr in C10E6 as a function of
mixed solvent composition with water. All three systems showed
broader Br peaks as the volume percent surfactant increased. These
systems were only investigated to 30% by volume surfactant at this
point but it was noted that large surfactant content results in
immeasurably broad lines.
Figure 4: 87Rb NMR linewidth in ppm of 0.075 molal RbBr as a
function of mixed solvent composition of water and C10E6. A
gradual increase in linewidth is observed from 0% to 50% by volume
of C10E6. From 50% to 60% a sharp increase of about 400% (40 ppm to
172.1 ppm) is present, indicating a solvent structural transition that was
also visibly observed in the lab by a notable increase in sample
viscosity. After 60%, the linewidth increases gradually again.
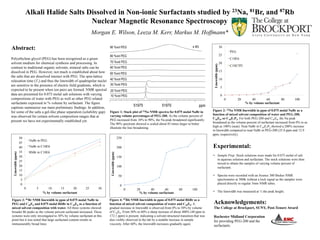
Figure 1: Stack plot of 23Na NMR spectra for 0.075 molal NaBr in
varying volume percentages of PEG-200. As the volume percent of
PEG increased from 10% to 90%, the Na peak broadened significantly.
The 90% spectrum showed is scaled about 85 times larger to better
illustrate the line broadening.
Experimental:
• Sample Prep: Stock solutions were made for 0.075 molal of salt
in aqueous solution and surfactant. The stock solutions were then
mixed to obtain the samples of varying volume percent of
surfactant.
• Spectra were recorded with an Avance 300 Bruker NMR
spectrometer at 300K without a lock signal as the samples were
placed directly in regular 5mm NMR tubes.
• The linewidth was measured at ½ the peak height.
x
85