
Recommended
More Related Content
What's hot
What's hot (20)
Similar to Processing Time Series Data with Hadoop MapReduce
Similar to Processing Time Series Data with Hadoop MapReduce (20)
Processing Time Series Data with Hadoop MapReduce
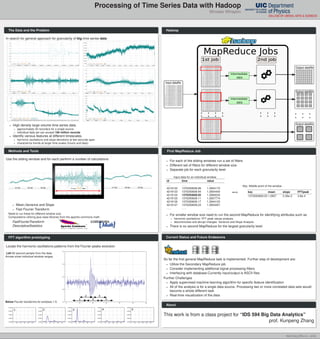
- 1. Processing of Time Series Data with Hadoop Miroslav Mihaylov The Data and the Problem In search for general approach for granularity of big time series data High density large volume time series data. approximately 20 records/s for a single source individual data set can exceed 100 million records Identify various features at different timescales. harmonic oscillations and slope deviations at few seconds span characterize trends at larger time scales (hourly and daily) Methods and Tools Use the sliding window and for each perform a number of calculations Mean,Variance and Slope Fast Fourier Transform Need to run these for different window size. Computations utilizing java class libraries from the apache commons math. FastFourierTransform DescriptiveStatistics FFT algorithm prototyping Locate the harmonic oscillations patterns from the Fourier peaks evolution Left 60 second sample from the data. Arrows show individual window ranges. Below Fourier transforms for windows 1-5. Hadoop First MapReduce Job For each of the sliding windows run a set of filters Different set of filters for different window size Separate job for each granularity level Input data for an individual window. id time value . . . . . . . . . . . . 4219122 1370293608.89 1.2844170 4219123 1370293608.94 1.2854440 4219124 1370293609.05 1.2884030 4219125 1370293609.11 1.2837774 4219126 1370293609.17 1.2844120 4219127 1370293609.23 1.2854267 . . . . . . . . . . . . =⇒ Key: Middle point of the window key mean slope FFTpeak 1370293609.05 1.2857 2.36e-2 3.8e-4 For smaller window size need to run the second MapReduce for identifying attributes such as harmonic oscillations- FFT peak values analysis. discontinuities and abrupt changes- Variance and Slope Analysis There is no second MapReduce for the largest granularity level Current Status and Future Endeavors So far the first general MapReduce task is implemented. Further step of development are: Utilize the Secondary MapReduce job Consider implementing additional signal processing filters Interfacing with database-Currently input/output is ASCII files Further Challenges Apply supervised machine learning algorithm for specific feature identification All of the analysis is for a single data source. Processing two or more correlated data sets would become a whole different task Real-time visualization of the data About This work is from a class project for “IDS 594 Big Data Analytics” prof. Kunpeng Zhang mmihay2@uic.edu