June 2017 Market Report for Home Sales in Toronto and GTA
•
0 likes•412 views

June 2017 Market Watch

Recommended
More Related Content
More from Michelle Makos
More from Michelle Makos (20)
Recently uploaded
Recently uploaded (20)
June 2017 Market Report for Home Sales in Toronto and GTA
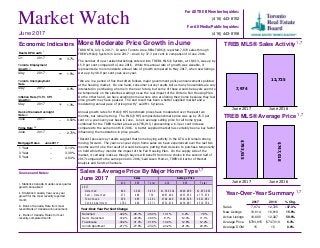
- 1. Toronto Employment Growth May 2017 1.5% Month June 2017 1 Year 3 Year 5 Year 3.14% 3.39% 4.64% June 2017 1 Year 3 Year 5 Year -- -- -- Market Watch For All TREB Member Inquiries: (416) 443-8158 For All Media/Public Inquiries: (416) 443-8152 More Moderate Price Growth in June TORONTO, July 6, 2017 – Greater Toronto Area REALTORS® reported 7,974 sales through TREB’s MLS® System in June 2017 – down by 37.3 per cent in comparison to June 2016. The number of new residential listings entered into TREB’s MLS® System, at 19,614, was up by 15.9 per cent compared to June 2016. While this annual rate of growth was sizeable, it represented a more moderate annual rate of growth compared to May 2017, when new listings were up by 48.9 per cent year-over-year. “We are in a period of flux that often follows major government policy announcements pointed at the housing market. On one hand, consumer survey results tell us many households are very interested in purchasing a home in the near future, but some of these would-be buyers seem to be temporarily on the sidelines waiting to see the real impact of the Ontario Fair Housing Plan. On the other hand, we have existing home owners who are listing their home because they feel price growth may have peaked. The end result has been a better supplied market and a moderating annual pace of price growth,” said Mr. Syrianos. Annual growth rates for MLS® HPI benchmark prices have moderated over the past two months, but remain strong. The MLS® HPI composite benchmark price was up by 25.3 per cent on a year-over-year basis in June. June’s average selling price for all home types combined for the TREB market area was $793,915, representing a 6.3 per cent increase compared to the same month in 2016. A better supplied market has certainly been a key factor influencing the moderation in price growth. “Recent Ipsos survey results suggest that home buying activity in the GTA will remain strong moving forward. The year-over-year dip in home sales we have experienced over the last two months seem to be the result of would-be buyers putting their decision to purchase temporarily on hold while they monitor the impact of the Fair Housing Plan. On the supply side of the market, it certainly looks as though buyers will benefit from more choice in the second half of 2017 compared to the same period in 2016,”said Jason Mercer, TREB’s Director of Market Analysis and Service Channels. TREB MLS® Sales Activity 7,974 12,725 June 2017 June 2016 TREB MLS® Average Price $793,915 $747,018 June 2017 June 2016 Year-Over-Year Summary 2017 2016 % Chg. Sales New Listings Active Listings Average Price Average DOM 7,974 12,725 -37.3% 19,614 16,918 15.9% 19,680 12,327 59.6% $793,915 $747,018 6.3% 15 15 0.0% Sources and Notes: i - Statistics Canada, Quarter-over-quarter growth, annualized ii - Statistics Canada, Year-over-year growth for the most recently reported month iii - Bank of Canada, Rate from most recent Bank of Canada announcement iv - Bank of Canada, Rates for most recently completed month Real GDP Growth Q1 2017 3.7% Toronto Unemployment Rate May 2017 -- 6.9% Inflation Rate (Yr./Yr. CPI Growth) May 2017 1.3% Bank of Canada Overnight Rate June 2017 -- 0.50% Prime Rate June 2017 -- 2.70% Economic Indicators Metrics Sales Average Price 416 905 Total 416 905 Total 2017 Detached Semi - Detached Townhouse Condo Apartment 848 2,602 3,450 $1,386,524 $948,099 $1,055,863 273 486 759 $987,404 $653,936 $773,879 296 985 1,281 $704,449 $596,028 $621,081 1,702 669 2,371 $552,679 $436,097 $519,784 Sales & Average Price By Major Home Type June 2017 June 2017 i ii ii iii iv Detached Semi - Detached Townhouse Condo Apartment 10.1% 6.2% 7.8% 8.1% 12.4% 11.1% 10.9% 12.8% 12.2% 23.2% 21.4% 23.2% Detached Semi - Detached Townhouse Condo Apartment -42.9% -45.7% -45.0% -37.2% -40.9% -39.6% -33.2% -31.4% -31.8% -21.7% -27.6% -23.4% 1,7 1,7 1,7 1,7 Year-Over-Year Per Cent Change Mortgage Rates
- 2. Toronto Real Estate Board Market Watch, June 2017 SALES BY PRICE RANGE AND HOUSE TYPE JUNE 2017 2 Price Range Detached Semi-Detached Att/Row/Twnhouse Condo Townhouse Condo Apt Link Co-op Apt Det Condo Co-ownership Apt Total $0 to $99,999 $100,000 to $199,999 $200,000 to $299,999 $300,000 to $399,999 $400,000 to $499,999 $500,000 to $599,999 $600,000 to $699,999 $700,000 to $799,999 $800,000 to $899,999 $900,000 to $999,999 $1,000,000 to $1,249,999 $1,250,000 to $1,499,999 $1,500,000 to $1,749,999 $1,750,000 to $1,999,999 $2,000,000+ 0 0 0 0 0 0 0 0 0 0 7 1 0 2 22 0 1 0 0 33 19 1 1 20 167 0 4 0 1 213 53 19 17 73 633 2 2 1 3 803 154 41 68 201 646 20 1 1 2 1,134 278 101 170 154 394 17 0 2 0 1,116 415 221 172 91 196 9 0 3 0 1,107 471 148 84 40 107 11 2 1 1 865 414 79 54 15 77 13 0 0 0 652 323 39 33 14 36 6 0 0 0 451 511 54 30 8 37 6 0 1 0 647 299 33 15 6 24 2 0 0 0 379 167 11 5 4 10 1 0 0 0 198 96 4 1 0 11 0 0 0 0 112 243 7 2 1 11 0 0 0 0 264 Price Range Detached Semi-Detached Att/Row/Twnhouse Condo Townhouse Condo Apt Link Co-op Apt Det Condo Co-ownership Apt Total $0 to $99,999 $100,000 to $199,999 $200,000 to $299,999 $300,000 to $399,999 $400,000 to $499,999 $500,000 to $599,999 $600,000 to $699,999 $700,000 to $799,999 $800,000 to $899,999 $900,000 to $999,999 $1,000,000 to $1,249,999 $1,250,000 to $1,499,999 $1,500,000 to $1,749,999 $1,750,000 to $1,999,999 $2,000,000+ 0 0 0 0 17 0 0 0 0 17 13 1 1 19 179 0 7 0 2 222 71 3 2 148 1,079 1 20 0 9 1,333 244 84 51 387 4,209 5 10 1 17 5,008 785 226 318 917 4,159 81 4 7 3 6,500 1,588 485 778 864 2,377 139 5 12 3 6,251 2,325 1,058 1,159 722 1,400 106 1 12 1 6,784 2,992 1,013 695 318 775 67 5 9 1 5,875 3,164 690 468 149 470 102 2 3 0 5,048 2,560 397 340 86 220 87 1 3 0 3,694 3,936 419 327 82 252 99 2 2 0 5,119 2,817 199 127 42 139 30 3 1 0 3,358 1,803 70 35 23 63 1 1 1 0 1,997 1,035 31 9 7 41 1 0 0 0 1,124 2,308 75 11 8 80 0 1 0 0 2,483 SALES BY PRICE RANGE AND HOUSE TYPE YEAR-TO-DATE, 2017 Total Sales Share of Total Sales Average Price 3,450 759 652 629 2,371 87 10 9 7 7,974 43.3% 9.5% 8.2% 7.9% 29.7% 1.1% 0.1% 0.1% 0.1% 100.0% $1,055,863 $773,879 $688,364 $551,338 $519,784 $692,160 $371,390 $637,767 $412,714 $793,915 Total Sales Share of Total Sales Average Price 25,641 4,751 4,321 3,772 15,460 719 62 51 36 54,813 46.8% 8.7% 7.9% 6.9% 28.2% 1.3% 0.1% 0.1% 0.1% 100.0% $1,164,062 $820,058 $742,385 $579,707 $512,141 $770,172 $492,552 $685,616 $358,639 $870,016 1,7 1,7
- 3. Toronto Real Estate Board Market Watch, June 2017 Number of Sales Dollar Volume Average Price Median Price New Listings SNLR (Trend) Active Listings Mos. Inv. (Trend) Avg. SP / LP Avg. DOM TREB Total Halton Region Burlington Halton Hills Milton Oakville Peel Region Brampton Caledon Mississauga City of Toronto Toronto West Toronto Central Toronto East York Region Aurora E. Gwillimbury Georgina King Markham Newmarket Richmond Hill Vaughan Whitchurch-Stouffville Durham Region Ajax Brock Clarington Oshawa Pickering Scugog Uxbridge Whitby Dufferin County Orangeville Simcoe County Adjala-Tosorontio Bradford West GwillimburyEssa Innisfil New Tecumseth 7,974 $6,330,675,197 793,915 $655,900 19,614 63.5% 19,680 1.2 100% 15 801 $687,991,852 858,916 $752,000 1,876 66.0% 1,884 1.2 99% 17 232 $178,186,979 768,047 $665,250 478 70.7% 495 1.1 99% 15 95 $68,780,895 724,009 $650,000 176 75.6% 151 1.1 101% 12 216 $162,483,349 752,238 $680,250 532 64.2% 401 0.9 99% 16 258 $278,540,629 1,079,615 $967,500 690 62.4% 837 1.3 98% 22 1,662 $1,177,403,110 708,425 $655,400 4,294 62.5% 4,110 1.1 99% 15 743 $509,699,610 686,002 $651,000 2,035 60.0% 1,900 1.0 100% 16 82 $81,857,596 998,263 $857,500 226 57.7% 309 1.9 97% 17 837 $585,845,904 699,935 $645,000 2,033 65.6% 1,901 1.1 99% 15 3,139 $2,603,735,455 829,479 $635,000 6,295 66.7% 6,000 1.2 101% 15 846 $631,746,629 746,745 $635,000 1,659 66.9% 1,637 1.2 101% 15 1,562 $1,446,688,882 926,177 $610,000 2,932 67.7% 2,878 1.3 100% 15 731 $525,299,944 718,605 $688,000 1,704 64.5% 1,485 1.0 102% 14 1,095 $1,084,630,872 990,530 $878,000 3,745 56.6% 4,493 1.4 99% 17 67 $69,346,488 1,035,022 $1,007,000 239 55.7% 284 1.3 95% 17 27 $26,604,000 985,333 $783,000 120 53.3% 183 1.8 98% 17 57 $36,143,380 634,094 $560,000 267 57.1% 409 1.5 96% 25 28 $38,581,000 1,377,893 $1,287,500 120 50.8% 170 2.7 95% 20 303 $291,521,556 962,117 $875,000 939 59.0% 1,044 1.2 100% 16 108 $85,584,400 792,448 $742,500 351 56.7% 396 1.1 99% 18 184 $208,803,616 1,134,802 $989,500 655 55.9% 795 1.4 99% 17 276 $275,296,132 997,450 $902,500 862 56.1% 957 1.4 99% 17 45 $52,750,300 1,172,229 $1,020,000 192 53.5% 255 1.6 98% 19 997 $613,218,495 615,064 $565,000 2,639 65.5% 2,216 0.9 101% 14 156 $103,679,700 664,613 $636,250 447 64.2% 330 0.8 102% 14 15 $10,083,300 672,220 $425,000 41 69.4% 74 2.2 102% 17 162 $86,478,889 533,820 $505,000 461 67.0% 383 0.9 102% 12 293 $142,560,676 486,555 $465,000 819 64.0% 661 0.8 101% 13 119 $88,486,724 743,586 $675,000 285 65.9% 255 0.9 100% 15 33 $22,001,385 666,709 $650,000 60 69.7% 75 1.4 98% 17 31 $25,875,021 834,678 $633,000 58 71.4% 82 1.6 99% 17 188 $134,052,800 713,047 $637,500 468 65.6% 356 0.7 99% 13 61 $30,861,798 505,931 $500,000 111 78.4% 99 0.7 99% 18 61 $30,861,798 505,931 $500,000 111 78.4% 99 0.7 99% 18 219 $132,833,615 606,546 $570,000 654 62.3% 878 1.5 99% 20 17 $13,921,215 818,895 $725,000 39 67.1% 60 2.2 97% 18 39 $26,144,900 670,382 $670,000 163 58.7% 211 1.3 99% 18 32 $16,809,700 525,303 $481,000 65 70.7% 102 1.4 98% 22 65 $36,647,700 563,811 $532,500 250 53.5% 323 1.8 100% 20 66 $39,310,100 595,608 $550,000 137 72.2% 182 1.2 98% 20 SUMMARY OF EXISTING HOME TRANSACTIONS ALL HOME TYPES, JUNE 2017 ALL TREB AREAS 3 1 1 1 2 5498 3
- 4. Toronto Real Estate Board Market Watch, June 2017 SUMMARY OF EXISTING HOME TRANSACTIONS ALL HOME TYPES, JUNE 2017 CITY OF TORONTO MUNICIPAL BREAKDOWN 4 Number of Sales Dollar Volume Average Price Median Price New Listings SNLR (Trend) Active Listings Mos. Inv. (Trend) Avg. SP / LP Avg. DOM TREB Total City of Toronto Total Toronto West Toronto W01 Toronto W02 Toronto W03 Toronto W04 Toronto W05 Toronto W06 Toronto W07 Toronto W08 Toronto W09 Toronto W10 Toronto Central Toronto C01 Toronto C02 Toronto C03 Toronto C04 Toronto C06 Toronto C07 Toronto C08 Toronto C09 Toronto C10 Toronto C11 Toronto C12 Toronto C13 Toronto C14 Toronto C15 Toronto East Toronto E01 Toronto E02 Toronto E03 Toronto E04 Toronto E05 Toronto E06 Toronto E07 Toronto E08 Toronto E09 Toronto E10 Toronto E11 7,974 $6,330,675,197 $793,915 $655,900 19,614 63.5% 19,680 1.2 100% 15 3,139 $2,603,735,455 $829,479 $635,000 6,295 66.7% 6,000 1.2 101% 15 846 $631,746,629 $746,745 $635,000 1,659 66.9% 1,637 1.2 101% 15 90 $80,220,083 $891,334 $621,250 108 71.5% 89 1.0 102% 14 87 $78,453,464 $901,764 $862,324 150 69.6% 109 0.8 104% 11 55 $36,246,600 $659,029 $660,000 132 63.8% 123 1.0 102% 14 68 $41,954,976 $616,985 $617,500 139 63.8% 167 1.4 102% 18 90 $50,358,900 $559,543 $570,000 220 64.7% 259 1.6 99% 19 136 $83,775,185 $615,994 $542,500 272 66.5% 252 1.4 101% 16 33 $34,364,023 $1,041,334 $989,800 51 69.1% 43 1.0 103% 15 171 $161,654,298 $945,347 $790,000 309 70.3% 282 1.1 100% 14 47 $31,029,800 $660,209 $636,000 77 68.3% 82 1.1 99% 14 69 $33,689,300 $488,251 $451,000 201 63.0% 231 1.4 98% 21 1,562 $1,446,688,882 $926,177 $610,000 2,932 67.7% 2,878 1.3 100% 15 529 $352,661,433 $666,657 $552,000 912 71.6% 866 1.2 102% 16 77 $134,395,800 $1,745,400 $1,295,000 151 57.4% 168 2.1 100% 19 41 $51,024,823 $1,244,508 $902,000 88 61.5% 91 1.3 103% 13 73 $146,659,688 $2,009,037 $1,780,000 135 60.7% 139 1.3 99% 14 37 $35,083,151 $948,193 $599,900 74 66.2% 69 1.1 97% 18 84 $71,018,576 $845,459 $571,000 245 62.3% 269 1.3 98% 18 199 $123,932,196 $622,775 $560,000 342 70.6% 315 1.2 102% 14 29 $67,216,420 $2,317,808 $1,940,000 44 69.1% 46 1.5 99% 16 64 $67,155,199 $1,049,300 $889,500 89 68.1% 82 1.1 101% 12 50 $44,400,536 $888,011 $507,500 69 74.0% 47 0.8 102% 11 25 $63,082,250 $2,523,290 $2,370,000 76 57.8% 104 2.1 97% 17 81 $82,464,101 $1,018,075 $715,000 140 71.0% 108 0.9 105% 11 133 $108,209,100 $813,602 $550,000 314 65.9% 308 1.3 99% 16 140 $99,385,609 $709,897 $535,000 253 69.3% 266 1.1 101% 15 731 $525,299,944 $718,605 $688,000 1,704 64.5% 1,485 1.0 102% 14 82 $80,784,445 $985,176 $961,500 132 68.4% 79 0.7 105% 11 63 $66,432,891 $1,054,490 $930,000 126 67.1% 88 0.9 102% 11 77 $66,648,230 $865,561 $865,000 174 62.7% 132 0.9 103% 14 93 $50,837,600 $546,641 $485,000 215 63.8% 203 1.0 101% 12 57 $39,297,708 $689,433 $590,000 170 64.4% 159 1.0 100% 15 24 $20,471,800 $852,992 $718,750 76 55.5% 69 1.2 100% 15 70 $39,267,378 $560,963 $420,500 195 62.6% 182 1.2 101% 16 41 $29,574,501 $721,329 $635,000 111 66.6% 104 1.0 102% 10 93 $51,459,500 $553,328 $530,000 213 68.2% 197 1.0 103% 15 52 $41,622,900 $800,440 $830,000 115 58.1% 121 1.3 99% 16 79 $38,902,991 $492,443 $487,500 177 67.6% 151 1.0 102% 14 1 1 1 2 8 3 9 4 5
- 5. Toronto Real Estate Board Market Watch, June 2017 SUMMARY OF EXISTING HOME TRANSACTIONS ALL HOME TYPES, YEAR-TO-DATE 2017 ALL TREB AREAS 5 Number of Sales Dollar Volume Average Price Median Price New Listings Avg. SP / LP Avg. DOM TREB Total Halton Region Burlington Halton Hills Milton Oakville Peel Region Brampton Caledon Mississauga City of Toronto Toronto West Toronto Central Toronto East York Region Aurora E. Gwillimbury Georgina King Markham Newmarket Richmond Hill Vaughan Whitchurch-Stouffville Durham Region Ajax Brock Clarington Oshawa Pickering Scugog Uxbridge Whitby Dufferin County Orangeville Simcoe County Adjala-Tosorontio Bradford West GwillimburyEssa Innisfil New Tecumseth 54,813 $47,688,179,665 $870,016 $719,000 101,052 107% 12 5,394 $5,154,231,330 $955,549 $821,500 9,480 104% 13 1,437 $1,193,425,301 $830,498 $755,000 2,255 103% 14 628 $470,611,214 $749,381 $687,000 880 104% 14 1,288 $1,005,534,208 $780,694 $739,500 2,459 106% 10 2,041 $2,484,660,607 $1,217,374 $1,099,000 3,886 104% 14 11,145 $8,426,852,940 $756,111 $697,500 20,978 106% 11 5,158 $3,777,140,797 $732,288 $692,000 10,063 105% 10 536 $529,695,090 $988,237 $890,000 1,107 103% 15 5,451 $4,120,017,053 $755,828 $676,000 9,808 107% 11 20,212 $17,707,267,382 $876,077 $653,000 33,891 108% 13 5,293 $3,985,338,360 $752,945 $650,000 8,720 107% 14 10,214 $10,116,410,138 $990,445 $620,000 16,800 107% 13 4,705 $3,605,518,884 $766,316 $742,000 8,371 111% 11 9,504 $10,702,918,219 $1,126,149 $1,000,000 21,109 108% 12 657 $752,425,300 $1,145,244 $1,050,000 1,463 107% 12 294 $302,404,436 $1,028,587 $946,000 703 109% 12 701 $486,064,351 $693,387 $630,000 1,524 105% 13 260 $404,882,968 $1,557,242 $1,384,000 568 102% 24 2,467 $2,782,765,988 $1,127,996 $1,022,000 5,254 109% 11 921 $900,787,903 $978,054 $930,000 2,130 110% 10 1,675 $2,127,161,994 $1,269,947 $1,215,000 3,809 109% 11 2,154 $2,493,023,871 $1,157,393 $1,050,000 4,720 107% 12 375 $453,401,408 $1,209,070 $1,035,000 938 105% 16 6,524 $4,339,837,597 $665,211 $625,000 11,826 109% 10 1,036 $742,090,878 $716,304 $695,500 1,901 110% 9 99 $52,648,990 $531,808 $428,800 188 102% 20 1,152 $691,832,008 $600,549 $570,000 2,030 109% 9 1,838 $1,033,355,685 $562,217 $535,000 3,480 111% 9 741 $576,008,531 $777,339 $725,000 1,304 108% 10 184 $123,659,351 $672,062 $610,000 307 102% 17 200 $177,627,446 $888,137 $777,250 325 103% 21 1,274 $942,614,708 $739,886 $711,500 2,291 109% 9 385 $208,328,169 $541,112 $530,000 553 104% 12 385 $208,328,169 $541,112 $530,000 553 104% 12 1,649 $1,148,744,028 $696,631 $620,000 3,215 103% 15 104 $90,880,715 $873,853 $713,500 174 99% 24 440 $378,954,712 $861,261 $787,300 912 105% 12 240 $128,788,342 $536,618 $485,000 405 101% 17 414 $270,535,984 $653,469 $588,000 997 103% 15 451 $279,584,275 $619,921 $566,000 727 101% 15 1 1 1 2 4 5
- 6. Toronto Real Estate Board Market Watch, June 2017 SUMMARY OF EXISTING HOME TRANSACTIONS ALL HOME TYPES, YEAR-TO-DATE 2017 CITY OF TORONTO MUNICIPAL BREAKDOWN 6 Number of Sales Dollar Volume Average Price Median Price New Listings Avg. SP / LP Avg. DOM TREB Total City of Toronto Total Toronto West Toronto W01 Toronto W02 Toronto W03 Toronto W04 Toronto W05 Toronto W06 Toronto W07 Toronto W08 Toronto W09 Toronto W10 Toronto Central Toronto C01 Toronto C02 Toronto C03 Toronto C04 Toronto C06 Toronto C07 Toronto C08 Toronto C09 Toronto C10 Toronto C11 Toronto C12 Toronto C13 Toronto C14 Toronto C15 Toronto East Toronto E01 Toronto E02 Toronto E03 Toronto E04 Toronto E05 Toronto E06 Toronto E07 Toronto E08 Toronto E09 Toronto E10 Toronto E11 54,813 $47,688,179,665 $870,016 $719,000 101,052 107% 12 20,212 $17,707,267,382 $876,077 $653,000 33,891 108% 13 5,293 $3,985,338,360 $752,945 $650,000 8,720 107% 14 347 $302,731,255 $872,424 $630,000 544 107% 13 476 $467,249,475 $981,617 $923,500 746 112% 10 375 $274,253,666 $731,343 $730,000 674 111% 11 467 $322,827,493 $691,279 $635,000 814 109% 15 608 $339,982,824 $559,182 $547,000 1,047 105% 19 982 $618,447,589 $629,784 $529,000 1,546 106% 16 163 $196,328,124 $1,204,467 $1,162,000 265 111% 12 1,077 $1,001,671,161 $930,057 $710,000 1,703 106% 12 275 $201,653,751 $733,286 $720,000 450 108% 12 523 $260,193,022 $497,501 $400,200 931 105% 15 10,214 $10,116,410,138 $990,445 $620,000 16,800 107% 13 3,316 $2,213,458,550 $667,509 $550,000 5,185 106% 13 484 $757,925,915 $1,565,963 $1,259,500 880 104% 20 319 $502,908,192 $1,576,515 $1,151,000 551 107% 13 484 $925,288,920 $1,911,754 $1,802,500 855 107% 13 230 $226,558,003 $985,035 $600,000 408 110% 12 723 $684,420,038 $946,639 $623,000 1,358 106% 12 1,223 $785,699,120 $642,436 $566,900 1,837 106% 13 166 $385,106,204 $2,319,917 $1,922,500 277 104% 14 406 $414,328,011 $1,020,512 $708,250 629 109% 11 265 $254,584,253 $960,695 $488,000 388 108% 10 216 $680,564,688 $3,150,762 $2,900,000 430 103% 17 484 $570,306,904 $1,178,320 $745,000 791 113% 10 977 $944,219,908 $966,448 $559,000 1,709 107% 11 921 $771,041,432 $837,179 $535,000 1,502 109% 11 4,705 $3,605,518,884 $766,316 $742,000 8,371 111% 11 402 $394,776,001 $982,030 $925,000 656 116% 9 362 $394,542,109 $1,089,895 $998,000 606 111% 11 469 $446,953,734 $952,993 $920,000 867 113% 11 588 $382,193,681 $649,989 $706,150 1,026 111% 11 524 $399,025,166 $761,498 $631,500 921 113% 12 195 $176,252,388 $903,858 $805,000 381 108% 11 459 $290,676,829 $633,283 $455,000 899 111% 11 314 $244,984,805 $780,206 $754,550 537 108% 9 627 $367,699,530 $586,443 $533,249 1,103 111% 10 346 $280,194,425 $809,810 $803,750 659 109% 14 419 $228,220,216 $544,678 $557,500 716 108% 12 1 1 1 2 4 5
- 7. Toronto Real Estate Board Market Watch, June 2017 SUMMARY OF EXISTING HOME TRANSACTIONS DETACHED HOUSES, JUNE 2017 ALL TREB AREAS 7 Sales Dollar Volume Average Price Median Price New Listings Active Listings Avg. SP / LP Avg. DOM TREB Total Halton Region Burlington Halton Hills Milton Oakville Peel Region Brampton Caledon Mississauga City of Toronto Toronto West Toronto Central Toronto East York Region Aurora E. Gwillimbury Georgina King Markham Newmarket Richmond Hill Vaughan Whitchurch-Stouffville Durham Region Ajax Brock Clarington Oshawa Pickering Scugog Uxbridge Whitby Dufferin County Orangeville Simcoe County Adjala-Tosorontio Bradford West GwillimburyEssa Innisfil New Tecumseth 3,450 $3,642,726,647 $1,055,863 $876,000 10,263 11,245 99% 16 440 $471,671,215 $1,071,980 $950,000 1,112 1,240 98% 19 115 $115,251,399 $1,002,186 $900,000 294 345 98% 16 69 $54,447,488 $789,094 $763,000 135 128 101% 12 98 $94,617,798 $965,488 $881,500 244 219 99% 19 158 $207,354,530 $1,312,370 $1,140,000 439 548 97% 24 737 $682,481,381 $926,026 $840,000 2,059 2,137 99% 15 400 $320,498,573 $801,246 $750,000 1,140 1,086 99% 15 64 $70,569,273 $1,102,645 $932,500 170 254 97% 18 273 $291,413,535 $1,067,449 $940,000 749 797 99% 14 848 $1,175,771,928 $1,386,524 $1,085,313 2,096 2,196 100% 14 301 $336,699,185 $1,118,602 $935,000 690 719 100% 15 254 $558,706,100 $2,199,630 $1,855,800 598 707 99% 14 293 $280,366,643 $956,883 $850,000 808 770 101% 14 573 $736,220,778 $1,284,853 $1,175,000 2,379 3,090 98% 18 41 $50,234,688 $1,225,236 $1,130,000 156 187 94% 16 21 $22,568,000 $1,074,667 $900,000 106 169 97% 18 49 $31,972,900 $652,508 $570,000 241 380 96% 25 26 $37,841,000 $1,455,423 $1,380,000 110 157 95% 19 112 $159,396,068 $1,423,179 $1,295,000 459 576 100% 17 62 $57,031,000 $919,855 $847,500 261 294 99% 16 90 $150,809,478 $1,675,661 $1,450,000 391 518 98% 18 134 $178,677,244 $1,333,412 $1,204,000 497 607 98% 18 38 $47,690,400 $1,255,011 $1,052,500 158 202 98% 19 654 $450,635,030 $689,044 $635,000 1,995 1,768 100% 14 91 $68,522,700 $752,997 $732,000 303 221 103% 13 14 $9,888,300 $706,307 $427,500 40 73 102% 16 100 $59,358,188 $593,582 $585,000 349 316 101% 14 199 $105,625,298 $530,780 $515,000 639 530 101% 13 70 $62,837,947 $897,685 $794,900 201 182 99% 15 32 $21,628,385 $675,887 $650,000 59 75 98% 17 25 $22,407,021 $896,281 $710,000 52 77 99% 16 123 $100,367,191 $815,993 $730,000 352 294 99% 13 36 $21,085,800 $585,717 $591,450 64 57 99% 16 36 $21,085,800 $585,717 $591,450 64 57 99% 16 162 $104,860,515 $647,287 $610,250 558 757 99% 20 17 $13,921,215 $818,895 $725,000 39 60 97% 18 24 $17,249,500 $718,729 $755,000 133 173 99% 21 22 $12,750,900 $579,586 $590,000 50 82 98% 21 58 $33,404,500 $575,940 $550,000 234 302 100% 20 41 $27,534,400 $671,571 $605,000 102 140 98% 18 1 2 3 4 51 1 1
- 8. Toronto Real Estate Board Market Watch, June 2017 SUMMARY OF EXISTING HOME TRANSACTIONS DETACHED HOUSES, JUNE 2017 CITY OF TORONTO MUNICIPAL BREAKDOWN 8 Sales Dollar Volume Average Price Median Price New Listings Active Listings Avg. SP / LP Avg. DOM TREB Total City of Toronto Total Toronto West Toronto W01 Toronto W02 Toronto W03 Toronto W04 Toronto W05 Toronto W06 Toronto W07 Toronto W08 Toronto W09 Toronto W10 Toronto Central Toronto C01 Toronto C02 Toronto C03 Toronto C04 Toronto C06 Toronto C07 Toronto C08 Toronto C09 Toronto C10 Toronto C11 Toronto C12 Toronto C13 Toronto C14 Toronto C15 Toronto East Toronto E01 Toronto E02 Toronto E03 Toronto E04 Toronto E05 Toronto E06 Toronto E07 Toronto E08 Toronto E09 Toronto E10 Toronto E11 3,450 $3,642,726,647 $1,055,863 $876,000 10,263 11,245 99% 16 848 $1,175,771,928 $1,386,524 $1,085,313 2,096 2,196 100% 14 301 $336,699,185 $1,118,602 $935,000 690 719 100% 15 18 $34,043,800 $1,891,322 $1,722,500 24 29 99% 14 25 $31,384,788 $1,255,392 $1,160,000 57 47 103% 11 31 $22,074,000 $712,065 $690,000 63 63 103% 14 35 $28,887,888 $825,368 $830,000 87 108 103% 17 17 $15,220,000 $895,294 $830,000 60 76 99% 23 21 $19,554,375 $931,161 $850,000 74 80 99% 14 29 $31,879,023 $1,099,277 $1,040,000 45 37 103% 16 79 $115,267,111 $1,459,077 $1,215,000 155 148 99% 13 22 $21,184,500 $962,932 $920,000 36 41 100% 13 24 $17,203,700 $716,821 $697,000 89 90 99% 19 254 $558,706,100 $2,199,630 $1,855,800 598 707 99% 14 5 $7,682,000 $1,536,400 $1,698,000 10 16 99% 20 19 $45,046,500 $2,370,868 $2,325,000 31 31 102% 13 19 $33,490,800 $1,762,674 $1,475,000 48 50 104% 8 53 $128,214,188 $2,419,136 $2,100,000 97 101 99% 13 17 $24,983,001 $1,469,588 $1,350,000 37 41 96% 18 16 $31,029,000 $1,939,313 $1,782,500 78 114 95% 22 1 $1,040,000 $1,040,000 $1,040,000 1 1 95% 7 15 $48,820,587 $3,254,706 $2,950,000 20 21 98% 15 17 $29,602,999 $1,741,353 $1,600,000 24 17 100% 12 16 $28,800,237 $1,800,015 $1,725,000 21 18 102% 11 14 $53,204,000 $3,800,286 $2,825,000 55 84 96% 17 27 $51,713,688 $1,915,322 $1,600,000 65 55 106% 8 17 $41,911,000 $2,465,353 $2,520,000 65 96 96% 17 18 $33,168,100 $1,842,672 $1,529,000 46 62 101% 16 293 $280,366,643 $956,883 $850,000 808 770 101% 14 20 $24,529,400 $1,226,470 $1,075,000 34 20 107% 10 27 $34,573,913 $1,280,515 $1,110,000 56 43 100% 12 42 $42,233,229 $1,005,553 $897,500 123 97 102% 17 38 $29,939,000 $787,868 $762,500 114 117 100% 11 21 $21,239,700 $1,011,414 $970,000 62 70 101% 17 19 $17,889,900 $941,574 $800,000 62 61 100% 15 16 $15,490,000 $968,125 $942,450 64 66 102% 18 20 $21,107,501 $1,055,375 $847,500 59 60 101% 9 38 $27,876,500 $733,592 $726,500 104 94 103% 14 34 $33,189,000 $976,147 $885,000 78 85 99% 18 18 $12,298,500 $683,250 $700,000 52 57 101% 14 1 1 1 1 2 3 4 5
- 9. Toronto Real Estate Board Market Watch, June 2017 SUMMARY OF EXISTING HOME TRANSACTIONS SEMI-DETACHED HOUSES, JUNE 2017 ALL TREB AREAS 9 Sales Dollar Volume Average Price Median Price New Listings Active Listings Avg. SP / LP Avg. DOM TREB Total Halton Region Burlington Halton Hills Milton Oakville Peel Region Brampton Caledon Mississauga City of Toronto Toronto West Toronto Central Toronto East York Region Aurora E. Gwillimbury Georgina King Markham Newmarket Richmond Hill Vaughan Whitchurch-Stouffville Durham Region Ajax Brock Clarington Oshawa Pickering Scugog Uxbridge Whitby Dufferin County Orangeville Simcoe County Adjala-Tosorontio Bradford West GwillimburyEssa Innisfil New Tecumseth 759 $587,374,100 $773,879 $698,000 1,820 1,590 101% 14 53 $36,126,900 $681,640 $670,000 117 79 100% 12 14 $8,895,900 $635,421 $650,000 28 23 101% 13 10 $5,330,000 $533,000 $522,800 7 2 101% 8 18 $12,541,000 $696,722 $689,000 54 35 101% 12 11 $9,360,000 $850,909 $885,000 28 19 98% 15 260 $172,563,299 $663,705 $658,000 723 630 100% 15 146 $92,240,788 $631,786 $635,000 414 363 100% 16 5 $3,216,000 $643,200 $639,000 22 28 99% 15 109 $77,106,511 $707,399 $690,000 287 239 100% 14 273 $269,561,393 $987,404 $872,022 561 487 103% 12 91 $73,757,524 $810,522 $757,500 205 200 102% 13 76 $99,238,945 $1,305,776 $1,199,000 141 138 103% 11 106 $96,564,924 $910,990 $842,500 215 149 104% 11 76 $60,477,080 $795,751 $793,500 243 265 100% 18 5 $3,646,000 $729,200 $742,000 16 15 97% 21 2 $1,478,000 $739,000 $739,000 4 2 99% 16 2 $1,007,180 $503,590 $503,590 9 8 97% 32 0 - - - 1 1 - - 23 $20,022,100 $870,526 $850,000 71 61 100% 15 14 $9,348,000 $667,714 $672,500 39 52 100% 17 2 $1,687,000 $843,500 $843,500 20 36 99% 13 25 $20,945,800 $837,832 $830,000 76 78 99% 19 3 $2,343,000 $781,000 $785,000 7 12 101% 18 81 $39,799,828 $491,356 $456,000 150 101 103% 11 19 $12,191,500 $641,658 $635,000 38 27 103% 13 0 - - - 0 0 - - 8 $3,393,051 $424,131 $432,276 14 7 107% 5 39 $15,984,377 $409,856 $410,000 69 45 103% 13 7 $4,186,900 $598,129 $575,000 12 10 104% 10 1 $373,000 $373,000 $373,000 1 0 99% 9 0 - - - 0 0 - - 7 $3,671,000 $524,429 $520,000 16 12 99% 12 4 $1,692,300 $423,075 $418,700 13 14 97% 31 4 $1,692,300 $423,075 $418,700 13 14 97% 31 12 $7,153,300 $596,108 $607,500 13 14 97% 17 0 - - - 0 0 - - 8 $5,101,400 $637,675 $640,450 8 8 97% 13 0 - - - 0 1 - - 0 - - - 0 0 - - 4 $2,051,900 $512,975 $519,450 5 5 97% 23 1 1 1 1 2 3 4 5
- 10. Toronto Real Estate Board Market Watch, June 2017 SUMMARY OF EXISTING HOME TRANSACTIONS SEMI-DETACHED HOUSES, JUNE 2017 CITY OF TORONTO MUNICIPAL BREAKDOWN 10 Sales Dollar Volume Average Price Median Price New Listings Active Listings Avg. SP / LP Avg. DOM TREB Total City of Toronto Total Toronto West Toronto W01 Toronto W02 Toronto W03 Toronto W04 Toronto W05 Toronto W06 Toronto W07 Toronto W08 Toronto W09 Toronto W10 Toronto Central Toronto C01 Toronto C02 Toronto C03 Toronto C04 Toronto C06 Toronto C07 Toronto C08 Toronto C09 Toronto C10 Toronto C11 Toronto C12 Toronto C13 Toronto C14 Toronto C15 Toronto East Toronto E01 Toronto E02 Toronto E03 Toronto E04 Toronto E05 Toronto E06 Toronto E07 Toronto E08 Toronto E09 Toronto E10 Toronto E11 759 $587,374,100 $773,879 $698,000 1,820 1,590 101% 14 273 $269,561,393 $987,404 $872,022 561 487 103% 12 91 $73,757,524 $810,522 $757,500 205 200 102% 13 12 $13,067,883 $1,088,990 $1,093,450 12 8 108% 12 29 $26,366,853 $909,202 $875,000 39 22 103% 11 13 $8,910,600 $685,431 $690,000 49 48 100% 14 3 $2,103,888 $701,296 $685,000 9 16 107% 12 24 $16,117,300 $671,554 $636,000 70 83 99% 16 1 $999,000 $999,000 $999,000 10 6 95% 1 0 - - - 1 1 - - 2 $1,608,000 $804,000 $804,000 4 4 101% 8 2 $1,310,000 $655,000 $655,000 2 1 103% 5 5 $3,274,000 $654,800 $660,000 9 11 97% 24 76 $99,238,945 $1,305,776 $1,199,000 141 138 103% 11 16 $21,797,400 $1,362,338 $1,099,950 35 30 104% 10 15 $26,074,000 $1,738,267 $1,304,000 28 17 104% 9 9 $8,121,023 $902,336 $692,000 13 9 98% 15 7 $8,428,000 $1,204,000 $1,206,000 7 3 97% 10 0 - - - 0 1 - - 1 $1,092,000 $1,092,000 $1,092,000 5 9 94% 20 3 $4,355,000 $1,451,667 $1,480,000 8 11 110% 13 1 $2,175,000 $2,175,000 $2,175,000 3 4 118% 6 10 $13,367,500 $1,336,750 $1,340,000 6 8 104% 13 2 $2,151,000 $1,075,500 $1,075,500 5 4 98% 8 0 - - - 1 1 - - 4 $4,931,000 $1,232,750 $1,185,500 10 7 104% 10 1 $1,150,000 $1,150,000 $1,150,000 1 1 96% 41 7 $5,597,022 $799,575 $787,000 19 33 95% 10 106 $96,564,924 $910,990 $842,500 215 149 104% 11 34 $35,825,445 $1,053,690 $972,500 52 28 103% 11 20 $19,987,978 $999,399 $975,000 46 28 107% 6 22 $20,283,101 $921,959 $921,500 33 23 105% 11 4 $2,713,800 $678,450 $669,400 14 14 103% 19 1 $650,000 $650,000 $650,000 14 15 94% 4 2 $1,217,000 $608,500 $608,500 5 2 100% 11 4 $3,012,000 $753,000 $745,000 17 12 102% 7 0 - - - 2 1 - - 5 $3,325,000 $665,000 $670,000 9 7 99% 14 4 $2,780,000 $695,000 $690,000 5 5 105% 18 10 $6,770,600 $677,060 $692,500 18 14 101% 12 1 1 1 1 2 3 4 5
- 11. Toronto Real Estate Board Market Watch, June 2017 SUMMARY OF EXISTING HOME TRANSACTIONS CONDOMINIUM TOWNHOUSES, JUNE 2017 ALL TREB AREAS 11 Sales Dollar Volume Average Price Median Price New Listings Active Listings Avg. SP / LP Avg. DOM TREB Total Halton Region Burlington Halton Hills Milton Oakville Peel Region Brampton Caledon Mississauga City of Toronto Toronto West Toronto Central Toronto East York Region Aurora E. Gwillimbury Georgina King Markham Newmarket Richmond Hill Vaughan Whitchurch-Stouffville Durham Region Ajax Brock Clarington Oshawa Pickering Scugog Uxbridge Whitby Dufferin County Orangeville Simcoe County Adjala-Tosorontio Bradford West GwillimburyEssa Innisfil New Tecumseth 629 $346,791,466 $551,338 $515,000 1,308 1,166 101% 16 80 $42,509,368 $531,367 $490,000 132 132 100% 18 50 $25,915,680 $518,314 $499,950 68 54 99% 17 3 $1,380,000 $460,000 $455,000 5 4 102% 13 9 $4,202,888 $466,988 $460,000 22 16 101% 18 18 $11,010,800 $611,711 $535,000 37 58 100% 20 204 $106,660,773 $522,847 $507,000 497 426 101% 15 64 $29,046,050 $453,845 $441,500 116 112 103% 19 1 $465,000 $465,000 $465,000 0 0 99% 29 139 $77,149,723 $555,034 $546,000 381 314 100% 14 219 $132,731,325 $606,079 $560,000 410 366 101% 16 64 $34,348,699 $536,698 $476,750 127 126 99% 19 96 $66,873,538 $696,599 $637,500 142 116 101% 15 59 $31,509,088 $534,052 $540,000 141 124 101% 13 55 $36,235,100 $658,820 $615,000 130 133 99% 18 8 $6,148,800 $768,600 $554,400 15 22 99% 20 0 - - - 0 0 - - 0 - - - 0 1 - - 0 - - - 0 0 - - 25 $15,535,300 $621,412 $610,000 59 59 101% 17 5 $2,981,000 $596,200 $615,000 15 14 95% 30 8 $5,484,500 $685,563 $722,500 16 13 98% 19 9 $6,085,500 $676,167 $606,000 25 23 98% 11 0 - - - 0 1 - - 67 $27,250,900 $406,730 $415,000 131 99 102% 16 10 $4,514,000 $451,400 $465,000 25 24 101% 17 1 $195,000 $195,000 $195,000 1 1 87% 30 3 $1,647,500 $549,167 $435,000 10 7 97% 11 25 $7,933,000 $317,320 $315,000 54 38 102% 14 17 $7,917,900 $465,759 $441,000 21 19 103% 14 0 - - - 0 0 - - 2 $1,035,000 $517,500 $517,500 3 3 99% 25 9 $4,008,500 $445,389 $460,000 17 7 107% 17 3 $1,054,000 $351,333 $345,000 5 4 101% 9 3 $1,054,000 $351,333 $345,000 5 4 101% 9 1 $350,000 $350,000 $350,000 3 6 93% 36 0 - - - 0 0 - - 0 - - - 2 3 - - 0 - - - 0 0 - - 0 - - - 0 0 - - 1 $350,000 $350,000 $350,000 1 3 93% 36 1 1 1 1 2 3 4 5
- 12. Toronto Real Estate Board Market Watch, June 2017 SUMMARY OF EXISTING HOME TRANSACTIONS CONDOMINIUM TOWNHOUSES, JUNE 2017 CITY OF TORONTO MUNICIPAL BREAKDOWN 12 Sales Dollar Volume Average Price Median Price New Listings Active Listings Avg. SP / LP Avg. DOM TREB Total City of Toronto Total Toronto West Toronto W01 Toronto W02 Toronto W03 Toronto W04 Toronto W05 Toronto W06 Toronto W07 Toronto W08 Toronto W09 Toronto W10 Toronto Central Toronto C01 Toronto C02 Toronto C03 Toronto C04 Toronto C06 Toronto C07 Toronto C08 Toronto C09 Toronto C10 Toronto C11 Toronto C12 Toronto C13 Toronto C14 Toronto C15 Toronto East Toronto E01 Toronto E02 Toronto E03 Toronto E04 Toronto E05 Toronto E06 Toronto E07 Toronto E08 Toronto E09 Toronto E10 Toronto E11 629 $346,791,466 $551,338 $515,000 1,308 1,166 101% 16 219 $132,731,325 $606,079 $560,000 410 366 101% 16 64 $34,348,699 $536,698 $476,750 127 126 99% 19 4 $2,544,500 $636,125 $569,500 8 7 101% 17 5 $3,635,099 $727,020 $751,099 10 9 103% 8 3 $1,586,000 $528,667 $492,000 5 2 101% 12 4 $1,998,900 $499,725 $507,950 11 14 103% 13 25 $10,495,800 $419,832 $430,000 42 48 99% 22 7 $6,734,000 $962,000 $635,000 10 6 97% 19 0 - - - 0 0 - - 3 $1,777,000 $592,333 $573,000 9 9 98% 26 4 $2,068,900 $517,225 $514,950 8 6 103% 21 9 $3,508,500 $389,833 $400,000 24 25 96% 19 96 $66,873,538 $696,599 $637,500 142 116 101% 15 29 $21,399,900 $737,928 $655,000 42 34 101% 11 4 $4,415,000 $1,103,750 $972,500 4 3 98% 10 0 - - - 1 2 - - 0 - - - 1 0 - - 0 - - - 2 1 - - 7 $3,834,888 $547,841 $530,000 13 12 99% 30 10 $5,821,500 $582,150 $492,500 13 11 101% 17 0 - - - 0 0 - - 1 $660,000 $660,000 $660,000 4 3 116% 12 3 $1,722,000 $574,000 $650,000 1 0 103% 11 5 $4,218,000 $843,600 $985,000 9 11 101% 17 5 $3,234,750 $646,950 $727,000 3 1 101% 13 9 $6,534,000 $726,000 $583,000 19 14 100% 17 23 $15,033,500 $653,630 $600,000 30 24 101% 17 59 $31,509,088 $534,052 $540,000 141 124 101% 13 3 $1,799,100 $599,700 $650,000 11 9 103% 18 4 $2,969,000 $742,250 $739,500 5 2 98% 11 0 - - - 1 1 - - 7 $3,513,000 $501,857 $475,000 11 8 106% 11 13 $7,469,000 $574,538 $580,000 32 24 100% 14 0 - - - 1 0 - - 4 $2,501,000 $625,250 $617,500 13 12 102% 21 6 $3,007,500 $501,250 $517,500 12 9 107% 5 5 $2,098,500 $419,700 $442,500 12 14 99% 18 6 $2,648,000 $441,333 $440,000 15 17 98% 15 11 $5,503,988 $500,363 $490,000 28 28 102% 10 1 1 1 1 2 3 4 5
- 13. Toronto Real Estate Board Market Watch, June 2017 SUMMARY OF EXISTING HOME TRANSACTIONS CONDOMINIUM APARTMENT, JUNE 2017 ALL TREB AREAS 13 Sales Dollar Volume Average Price Median Price New Listings Active Listings Avg. SP / LP Avg. DOM TREB Total Halton Region Burlington Halton Hills Milton Oakville Peel Region Brampton Caledon Mississauga City of Toronto Toronto West Toronto Central Toronto East York Region Aurora E. Gwillimbury Georgina King Markham Newmarket Richmond Hill Vaughan Whitchurch-Stouffville Durham Region Ajax Brock Clarington Oshawa Pickering Scugog Uxbridge Whitby Dufferin County Orangeville Simcoe County Adjala-Tosorontio Bradford West GwillimburyEssa Innisfil New Tecumseth 2,371 $1,232,408,997 $519,784 $448,000 4,245 3,907 101% 16 76 $36,830,400 $484,611 $420,000 147 152 100% 16 29 $12,832,400 $442,497 $410,000 42 35 101% 9 2 $995,000 $497,500 $497,500 7 6 96% 35 19 $8,137,300 $428,279 $420,000 40 31 101% 14 26 $14,865,700 $571,758 $438,000 58 80 100% 25 322 $128,669,735 $399,595 $375,000 601 552 100% 17 43 $15,110,900 $351,416 $355,000 86 86 99% 19 0 - - - 0 0 - - 279 $113,558,835 $407,021 $379,000 515 466 100% 17 1,702 $940,659,809 $552,679 $475,000 2,971 2,708 101% 15 363 $168,872,821 $465,214 $430,000 575 535 101% 16 1,098 $680,131,799 $619,428 $525,000 1,968 1,825 101% 15 241 $91,655,189 $380,312 $355,000 428 348 102% 14 218 $106,631,176 $489,134 $446,400 426 410 100% 15 3 $1,670,000 $556,667 $525,000 7 15 99% 10 0 - - - 0 0 - - 0 - - - 1 3 - - 2 $740,000 $370,000 $370,000 0 1 97% 31 80 $38,256,688 $478,209 $447,000 176 163 101% 16 8 $3,500,900 $437,613 $430,000 7 1 104% 13 60 $28,400,988 $473,350 $426,250 105 93 100% 14 64 $33,318,700 $520,605 $460,000 130 131 99% 15 1 $743,900 $743,900 $743,900 0 3 102% 46 44 $17,260,477 $392,284 $367,200 87 65 103% 13 11 $4,522,000 $411,091 $375,000 13 9 104% 13 0 - - - 0 0 - - 11 $3,592,400 $326,582 $330,000 28 20 100% 10 6 $1,941,500 $323,583 $330,000 17 16 108% 8 10 $4,432,977 $443,298 $390,000 21 15 106% 14 0 - - - 0 0 - - 0 - - - 0 0 - - 6 $2,771,600 $461,933 $370,000 8 5 99% 26 5 $1,029,400 $205,880 $232,000 4 7 99% 37 5 $1,029,400 $205,880 $232,000 4 7 99% 37 4 $1,328,000 $332,000 $296,500 9 13 99% 17 0 - - - 0 0 - - 1 $295,000 $295,000 $295,000 3 4 98% 14 0 - - - 0 0 - - 0 - - - 2 4 - - 3 $1,033,000 $344,333 $298,000 4 5 100% 18 1 1 1 1 2 3 4 5
- 14. Toronto Real Estate Board Market Watch, June 2017 SUMMARY OF EXISTING HOME TRANSACTIONS CONDOMINIUM APARTMENT, JUNE 2017 CITY OF TORONTO MUNICIPAL BREAKDOWN 14 Sales Dollar Volume Average Price Median Price New Listings Active Listings Avg. SP / LP Avg. DOM TREB Total City of Toronto Total Toronto West Toronto W01 Toronto W02 Toronto W03 Toronto W04 Toronto W05 Toronto W06 Toronto W07 Toronto W08 Toronto W09 Toronto W10 Toronto Central Toronto C01 Toronto C02 Toronto C03 Toronto C04 Toronto C06 Toronto C07 Toronto C08 Toronto C09 Toronto C10 Toronto C11 Toronto C12 Toronto C13 Toronto C14 Toronto C15 Toronto East Toronto E01 Toronto E02 Toronto E03 Toronto E04 Toronto E05 Toronto E06 Toronto E07 Toronto E08 Toronto E09 Toronto E10 Toronto E11 2,371 $1,232,408,997 $519,784 $448,000 4,245 3,907 101% 16 1,702 $940,659,809 $552,679 $475,000 2,971 2,708 101% 15 363 $168,872,821 $465,214 $430,000 575 535 101% 16 54 $28,723,900 $531,924 $490,000 61 40 104% 13 21 $11,397,724 $542,749 $425,000 33 23 103% 11 7 $2,896,000 $413,714 $380,000 10 5 100% 10 25 $8,419,300 $336,772 $315,000 28 24 100% 20 20 $7,246,800 $362,340 $354,000 36 44 101% 17 102 $52,805,910 $517,705 $462,750 164 146 102% 16 4 $2,485,000 $621,250 $625,000 4 3 103% 12 83 $40,567,187 $488,761 $440,000 138 119 101% 14 19 $6,466,400 $340,337 $235,000 27 29 96% 16 28 $7,864,600 $280,879 $305,000 74 102 97% 24 1,098 $680,131,799 $619,428 $525,000 1,968 1,825 101% 15 461 $279,920,133 $607,202 $535,000 803 763 102% 16 34 $52,970,300 $1,557,950 $935,000 73 104 96% 27 11 $8,523,000 $774,818 $635,000 24 28 104% 21 12 $9,710,500 $809,208 $610,500 27 31 102% 20 19 $9,198,150 $484,113 $449,000 35 26 101% 18 58 $33,189,188 $572,227 $515,000 139 125 100% 16 183 $109,901,696 $600,556 $553,100 309 270 102% 13 12 $15,520,833 $1,293,403 $957,000 19 19 100% 17 36 $23,524,700 $653,464 $567,500 53 52 100% 13 28 $10,652,299 $380,439 $379,250 37 23 101% 11 6 $5,660,250 $943,375 $904,000 11 8 109% 18 43 $21,089,663 $490,457 $412,000 59 42 102% 13 103 $54,684,100 $530,914 $505,000 223 189 102% 15 92 $45,586,987 $495,511 $436,500 156 145 101% 14 241 $91,655,189 $380,312 $355,000 428 348 102% 14 14 $8,195,000 $585,357 $527,000 20 11 104% 9 7 $4,682,000 $668,857 $575,000 9 8 96% 14 13 $4,131,900 $317,838 $280,000 14 9 99% 13 43 $13,906,800 $323,414 $328,000 65 56 102% 13 21 $9,159,008 $436,143 $412,000 55 45 101% 15 3 $1,364,900 $454,967 $470,000 8 6 99% 22 42 $15,472,578 $368,395 $364,000 86 79 100% 15 14 $4,619,500 $329,964 $298,750 32 25 104% 13 44 $17,514,500 $398,057 $387,500 86 79 103% 15 5 $1,258,000 $251,600 $198,000 6 4 110% 8 35 $11,351,003 $324,314 $347,265 47 26 103% 16 1 1 1 1 2 3 4 5
- 15. Toronto Real Estate Board Market Watch, June 2017 SUMMARY OF EXISTING HOME TRANSACTIONS LINK, JUNE 2017 ALL TREB AREAS 15 Sales Dollar Volume Average Price Median Price New Listings Active Listings Avg. SP / LP Avg. DOM TREB Total Halton Region Burlington Halton Hills Milton Oakville Peel Region Brampton Caledon Mississauga City of Toronto Toronto West Toronto Central Toronto East York Region Aurora E. Gwillimbury Georgina King Markham Newmarket Richmond Hill Vaughan Whitchurch-Stouffville Durham Region Ajax Brock Clarington Oshawa Pickering Scugog Uxbridge Whitby Dufferin County Orangeville Simcoe County Adjala-Tosorontio Bradford West GwillimburyEssa Innisfil New Tecumseth 87 $60,217,899 $692,160 $639,000 264 249 100% 14 7 $4,828,499 $689,786 $624,900 17 11 103% 7 3 $1,770,500 $590,167 $595,000 6 2 105% 7 2 $1,353,100 $676,550 $676,550 1 0 102% 6 0 - - - 2 1 - - 2 $1,704,899 $852,450 $852,450 8 8 101% 9 8 $6,154,000 $769,250 $713,500 40 37 100% 11 3 $1,779,000 $593,000 $612,000 17 16 101% 7 1 $687,000 $687,000 $687,000 1 0 101% 15 4 $3,688,000 $922,000 $731,500 22 21 99% 13 4 $3,017,500 $754,375 $764,250 29 23 102% 10 0 - - - 1 1 - - 1 $748,500 $748,500 $748,500 5 3 107% 10 3 $2,269,000 $756,333 $780,000 23 19 101% 10 29 $26,964,000 $929,793 $880,000 107 112 99% 19 0 - - - 6 5 - - 0 - - - 0 0 - - 0 - - - 2 1 - - 0 - - - 3 3 - - 20 $18,570,500 $928,525 $878,750 71 77 98% 14 1 $685,000 $685,000 $685,000 0 0 98% 58 5 $4,889,000 $977,800 $900,000 14 15 96% 31 3 $2,819,500 $939,833 $1,034,500 10 10 105% 16 0 - - - 1 1 - - 31 $15,220,000 $490,968 $495,000 52 35 102% 10 5 $2,836,000 $567,200 $560,000 7 6 103% 15 0 - - - 0 0 - - 13 $6,290,500 $483,885 $505,000 28 19 102% 10 7 $2,872,500 $410,357 $430,000 7 3 101% 8 0 - - - 1 2 - - 0 - - - 0 0 - - 1 $575,000 $575,000 $575,000 1 1 98% 8 5 $2,646,000 $529,200 $510,000 8 4 100% 6 1 $500,000 $500,000 $500,000 1 1 101% 17 1 $500,000 $500,000 $500,000 1 1 101% 17 7 $3,533,900 $504,843 $482,000 18 30 98% 31 0 - - - 0 0 - - 3 $1,634,000 $544,667 $482,000 7 12 99% 16 3 $1,309,900 $436,633 $430,000 8 13 96% 54 1 $590,000 $590,000 $590,000 0 1 98% 8 0 - - - 3 4 - - 1 1 1 1 2 3 4 5
- 16. Toronto Real Estate Board Market Watch, June 2017 SUMMARY OF EXISTING HOME TRANSACTIONS LINK, JUNE 2017 CITY OF TORONTO MUNICIPAL BREAKDOWN 16 Sales Dollar Volume Average Price Median Price New Listings Active Listings Avg. SP / LP Avg. DOM TREB Total City of Toronto Total Toronto West Toronto W01 Toronto W02 Toronto W03 Toronto W04 Toronto W05 Toronto W06 Toronto W07 Toronto W08 Toronto W09 Toronto W10 Toronto Central Toronto C01 Toronto C02 Toronto C03 Toronto C04 Toronto C06 Toronto C07 Toronto C08 Toronto C09 Toronto C10 Toronto C11 Toronto C12 Toronto C13 Toronto C14 Toronto C15 Toronto East Toronto E01 Toronto E02 Toronto E03 Toronto E04 Toronto E05 Toronto E06 Toronto E07 Toronto E08 Toronto E09 Toronto E10 Toronto E11 87 $60,217,899 $692,160 $639,000 264 249 100% 14 4 $3,017,500 $754,375 $764,250 29 23 102% 10 0 - - - 1 1 - - 0 - - - 0 0 - - 0 - - - 0 0 - - 0 - - - 0 0 - - 0 - - - 0 0 - - 0 - - - 0 0 - - 0 - - - 0 0 - - 0 - - - 0 0 - - 0 - - - 0 0 - - 0 - - - 0 0 - - 0 - - - 1 1 - - 1 $748,500 $748,500 $748,500 5 3 107% 10 0 - - - 0 0 - - 0 - - - 0 0 - - 0 - - - 0 0 - - 0 - - - 0 0 - - 0 - - - 0 0 - - 1 $748,500 $748,500 $748,500 3 1 107% 10 0 - - - 0 0 - - 0 - - - 0 0 - - 0 - - - 0 0 - - 0 - - - 0 0 - - 0 - - - 0 0 - - 0 - - - 0 0 - - 0 - - - 1 1 - - 0 - - - 1 1 - - 3 $2,269,000 $756,333 $780,000 23 19 101% 10 0 - - - 0 0 - - 0 - - - 0 0 - - 0 - - - 0 0 - - 0 - - - 0 0 - - 1 $780,000 $780,000 $780,000 6 3 99% 7 0 - - - 0 0 - - 2 $1,489,000 $744,500 $744,500 10 11 102% 11 0 - - - 0 0 - - 0 - - - 0 0 - - 0 - - - 0 0 - - 0 - - - 7 5 - - 1 1 1 1 2 3 4 5
- 17. Toronto Real Estate Board Market Watch, June 2017 SUMMARY OF EXISTING HOME TRANSACTIONS ATTACHED/ROW/TOWNHOUSE, JUNE 2017 ALL TREB AREAS 17 Sales Dollar Volume Average Price Median Price New Listings Active Listings Avg. SP / LP Avg. DOM TREB Total Halton Region Burlington Halton Hills Milton Oakville Peel Region Brampton Caledon Mississauga City of Toronto Toronto West Toronto Central Toronto East York Region Aurora E. Gwillimbury Georgina King Markham Newmarket Richmond Hill Vaughan Whitchurch-Stouffville Durham Region Ajax Brock Clarington Oshawa Pickering Scugog Uxbridge Whitby Dufferin County Orangeville Simcoe County Adjala-Tosorontio Bradford West GwillimburyEssa Innisfil New Tecumseth 652 $448,813,288 $688,364 $635,000 1,677 1,481 101% 15 143 $94,150,470 $658,395 $630,000 348 267 99% 14 19 $11,646,100 $612,953 $610,000 37 34 99% 17 9 $5,275,307 $586,145 $565,000 21 11 100% 10 72 $42,984,363 $597,005 $595,500 170 99 99% 13 43 $34,244,700 $796,388 $768,000 120 123 98% 15 130 $80,478,922 $619,069 $617,500 373 326 100% 13 86 $50,629,299 $588,713 $595,000 262 237 100% 14 11 $6,920,323 $629,120 $663,323 33 27 101% 11 33 $22,929,300 $694,827 $681,000 78 62 100% 12 77 $75,785,600 $984,229 $902,000 203 193 103% 16 20 $16,372,500 $818,625 $851,500 51 47 102% 15 29 $37,213,000 $1,283,207 $1,195,000 66 76 102% 22 28 $22,200,100 $792,861 $743,950 86 70 106% 11 144 $118,102,738 $820,158 $797,500 459 482 100% 17 10 $7,647,000 $764,700 $729,500 39 40 100% 18 4 $2,558,000 $639,500 $619,000 10 12 104% 14 6 $3,163,300 $527,217 $519,500 14 16 98% 25 0 - - - 6 8 - - 43 $39,740,900 $924,207 $856,800 103 108 101% 17 18 $12,038,500 $668,806 $657,500 29 35 99% 20 19 $17,532,650 $922,771 $910,000 109 120 99% 17 41 $33,449,388 $815,839 $810,000 123 107 101% 15 3 $1,973,000 $657,667 $645,000 26 36 97% 9 120 $63,052,260 $525,436 $530,000 222 147 102% 13 20 $11,093,500 $554,675 $553,000 59 42 99% 16 0 - - - 0 0 - - 27 $12,197,250 $451,750 $450,000 32 14 106% 9 17 $8,204,001 $482,588 $500,000 33 29 101% 15 15 $9,111,000 $607,400 $623,000 29 27 100% 18 0 - - - 0 0 - - 3 $1,858,000 $619,333 $600,000 2 1 97% 21 38 $20,588,509 $541,803 $537,552 67 34 102% 12 12 $5,500,298 $458,358 $456,500 24 16 99% 11 12 $5,500,298 $458,358 $456,500 24 16 99% 11 26 $11,743,000 $451,654 $434,350 48 50 100% 17 0 - - - 0 0 - - 3 $1,865,000 $621,667 $610,000 10 11 104% 17 7 $2,748,900 $392,700 $388,000 7 6 100% 13 6 $2,653,200 $442,200 $436,850 14 16 101% 19 10 $4,475,900 $447,590 $452,500 17 17 98% 18 1 1 1 1 2 3 4 5
- 18. Toronto Real Estate Board Market Watch, June 2017 SUMMARY OF EXISTING HOME TRANSACTIONS ATTACHED/ROW/TOWNHOUSE, JUNE 2017 CITY OF TORONTO MUNICIPAL BREAKDOWN 18 Sales Dollar Volume Average Price Median Price New Listings Active Listings Avg. SP / LP Avg. DOM TREB Total City of Toronto Total Toronto West Toronto W01 Toronto W02 Toronto W03 Toronto W04 Toronto W05 Toronto W06 Toronto W07 Toronto W08 Toronto W09 Toronto W10 Toronto Central Toronto C01 Toronto C02 Toronto C03 Toronto C04 Toronto C06 Toronto C07 Toronto C08 Toronto C09 Toronto C10 Toronto C11 Toronto C12 Toronto C13 Toronto C14 Toronto C15 Toronto East Toronto E01 Toronto E02 Toronto E03 Toronto E04 Toronto E05 Toronto E06 Toronto E07 Toronto E08 Toronto E09 Toronto E10 Toronto E11 652 $448,813,288 $688,364 $635,000 1,677 1,481 101% 15 77 $75,785,600 $984,229 $902,000 203 193 103% 16 20 $16,372,500 $818,625 $851,500 51 47 102% 15 2 $1,840,000 $920,000 $920,000 3 5 97% 22 6 $5,404,000 $900,667 $882,500 11 8 109% 7 1 $780,000 $780,000 $780,000 5 5 98% 63 1 $545,000 $545,000 $545,000 4 5 94% 20 1 $704,000 $704,000 $704,000 10 7 101% 35 4 $3,439,000 $859,750 $927,000 8 9 100% 12 0 - - - 1 2 - - 2 $1,822,000 $911,000 $911,000 2 1 98% 7 0 - - - 3 3 - - 3 $1,838,500 $612,833 $620,500 4 2 97% 9 29 $37,213,000 $1,283,207 $1,195,000 66 76 102% 22 17 $21,417,000 $1,259,824 $1,180,000 21 21 102% 27 3 $4,815,000 $1,605,000 $1,500,000 13 12 104% 13 0 - - - 0 1 - - 0 - - - 2 2 - - 1 $902,000 $902,000 $902,000 0 0 100% 28 1 $1,125,000 $1,125,000 $1,125,000 6 7 94% 29 2 $2,814,000 $1,407,000 $1,407,000 11 21 96% 9 0 - - - 0 0 - - 0 - - - 0 0 - - 1 $1,075,000 $1,075,000 $1,075,000 5 2 108% 1 0 - - - 0 0 - - 1 $1,135,000 $1,135,000 $1,135,000 3 3 96% 3 3 $3,930,000 $1,310,000 $1,360,000 5 7 104% 19 0 - - - 0 0 - - 28 $22,200,100 $792,861 $743,950 86 70 106% 11 11 $10,435,500 $948,682 $938,000 15 11 108% 13 4 $3,485,000 $871,250 $850,000 9 5 107% 10 0 - - - 3 2 - - 1 $765,000 $765,000 $765,000 11 8 109% 7 0 - - - 1 2 - - 0 - - - 0 0 - - 2 $1,302,800 $651,400 $651,400 5 1 109% 8 1 $840,000 $840,000 $840,000 6 9 99% 26 1 $645,000 $645,000 $645,000 2 3 101% 22 3 $1,747,900 $582,633 $545,000 10 9 99% 7 5 $2,978,900 $595,780 $630,000 24 20 103% 10 1 1 1 1 2 3 4 5
- 19. Toronto Real Estate Board Market Watch, June 2017 SUMMARY OF EXISTING HOME TRANSACTIONS CO-OP APARTMENT, JUNE 2017 ALL TREB AREAS 19 Sales Dollar Volume Average Price Median Price New Listings Active Listings Avg. SP / LP Average DOM TREB Total Halton Region Burlington Halton Hills Milton Oakville Peel Region Brampton Caledon Mississauga City of Toronto Toronto West Toronto Central Toronto East York Region Aurora E. Gwillimbury Georgina King Markham Newmarket Richmond Hill Vaughan Whitchurch-Stouffville Durham Region Ajax Brock Clarington Oshawa Pickering Scugog Uxbridge Whitby Dufferin County Orangeville Simcoe County Adjala-Tosorontio Bradford West GwillimburyEssa Innisfil New Tecumseth 10 $3,713,900 $371,390 $313,000 17 20 101% 16 0 - - - 0 0 - - 0 - - - 0 0 - - 0 - - - 0 0 - - 0 - - - 0 0 - - 0 - - - 0 0 - - 1 $395,000 $395,000 $395,000 1 1 110% 3 1 $395,000 $395,000 $395,000 0 0 110% 3 0 - - - 0 0 - - 0 - - - 1 1 - - 9 $3,318,900 $368,767 $265,000 15 18 100% 18 6 $1,448,900 $241,483 $247,450 9 8 106% 12 3 $1,870,000 $623,333 $700,000 4 6 96% 30 0 - - - 2 4 - - 0 - - - 1 1 - - 0 - - - 0 0 - - 0 - - - 0 0 - - 0 - - - 0 0 - - 0 - - - 0 0 - - 0 - - - 0 0 - - 0 - - - 0 0 - - 0 - - - 0 0 - - 0 - - - 1 1 - - 0 - - - 0 0 - - 0 - - - 0 0 - - 0 - - - 0 0 - - 0 - - - 0 0 - - 0 - - - 0 0 - - 0 - - - 0 0 - - 0 - - - 0 0 - - 0 - - - 0 0 - - 0 - - - 0 0 - - 0 - - - 0 0 - - 0 - - - 0 0 - - 0 - - - 0 0 - - 0 - - - 0 0 - - 0 - - - 0 0 - - 0 - - - 0 0 - - 0 - - - 0 0 - - 0 - - - 0 0 - - 0 - - - 0 0 - - 1 1 1 1 2 3 4 5
- 20. Toronto Real Estate Board Market Watch, June 2017 SUMMARY OF EXISTING HOME TRANSACTIONS CO-OP APARTMENT, JUNE 2017 CITY OF TORONTO MUNICIPAL BREAKDOWN 20 Sales Dollar Volume Average Price Median Price New Listings Active Listings Avg. SP / LP Avg. DOM TREB Total City of Toronto Total Toronto West Toronto W01 Toronto W02 Toronto W03 Toronto W04 Toronto W05 Toronto W06 Toronto W07 Toronto W08 Toronto W09 Toronto W10 Toronto Central Toronto C01 Toronto C02 Toronto C03 Toronto C04 Toronto C06 Toronto C07 Toronto C08 Toronto C09 Toronto C10 Toronto C11 Toronto C12 Toronto C13 Toronto C14 Toronto C15 Toronto East Toronto E01 Toronto E02 Toronto E03 Toronto E04 Toronto E05 Toronto E06 Toronto E07 Toronto E08 Toronto E09 Toronto E10 Toronto E11 10 $3,713,900 $371,390 $313,000 17 20 101% 16 9 $3,318,900 $368,767 $265,000 15 18 100% 18 6 $1,448,900 $241,483 $247,450 9 8 106% 12 0 - - - 0 0 - - 1 $265,000 $265,000 $265,000 0 0 100% 6 0 - - - 0 0 - - 0 - - - 0 0 - - 2 $328,000 $164,000 $164,000 1 0 90% 13 1 $242,900 $242,900 $242,900 6 5 109% 11 0 - - - 0 0 - - 2 $613,000 $306,500 $306,500 1 1 120% 15 0 - - - 1 2 - - 0 - - - 0 0 - - 3 $1,870,000 $623,333 $700,000 4 6 96% 30 1 $445,000 $445,000 $445,000 0 1 93% 19 1 $725,000 $725,000 $725,000 0 0 104% 31 0 - - - 0 0 - - 0 - - - 0 1 - - 0 - - - 0 0 - - 0 - - - 1 1 - - 0 - - - 0 0 - - 1 $700,000 $700,000 $700,000 2 2 91% 39 0 - - - 0 0 - - 0 - - - 0 0 - - 0 - - - 0 0 - - 0 - - - 0 0 - - 0 - - - 0 0 - - 0 - - - 1 1 - - 0 - - - 2 4 - - 0 - - - 0 0 - - 0 - - - 1 2 - - 0 - - - 0 0 - - 0 - - - 0 0 - - 0 - - - 0 0 - - 0 - - - 0 0 - - 0 - - - 0 1 - - 0 - - - 0 0 - - 0 - - - 0 0 - - 0 - - - 1 1 - - 0 - - - 0 0 - - 1 1 1 1 2 3 4 5
- 21. Toronto Real Estate Board Market Watch, June 2017 SUMMARY OF EXISTING HOME TRANSACTIONS DETACHED CONDOMINIUM, JUNE 2017 ALL TREB AREAS 21 Sales Dollar Volume Average Price Median Price New Listings Active Listings Avg. SP / LP Avg. DOM TREB Total Halton Region Burlington Halton Hills Milton Oakville Peel Region Brampton Caledon Mississauga City of Toronto Toronto West Toronto Central Toronto East York Region Aurora E. Gwillimbury Georgina King Markham Newmarket Richmond Hill Vaughan Whitchurch-Stouffville Durham Region Ajax Brock Clarington Oshawa Pickering Scugog Uxbridge Whitby Dufferin County Orangeville Simcoe County Adjala-Tosorontio Bradford West GwillimburyEssa Innisfil New Tecumseth 9 $5,739,900 $637,767 $625,000 11 14 97% 27 2 $1,875,000 $937,500 $937,500 3 3 99% 28 2 $1,875,000 $937,500 $937,500 3 2 99% 28 0 - - - 0 0 - - 0 - - - 0 0 - - 0 - - - 0 1 - - 0 - - - 0 1 - - 0 - - - 0 0 - - 0 - - - 0 0 - - 0 - - - 0 1 - - 0 - - - 1 1 - - 0 - - - 0 0 - - 0 - - - 0 0 - - 0 - - - 1 1 - - 0 - - - 0 0 - - 0 - - - 0 0 - - 0 - - - 0 0 - - 0 - - - 0 0 - - 0 - - - 0 0 - - 0 - - - 0 0 - - 0 - - - 0 0 - - 0 - - - 0 0 - - 0 - - - 0 0 - - 0 - - - 0 0 - - 0 - - - 2 1 - - 0 - - - 2 1 - - 0 - - - 0 0 - - 0 - - - 0 0 - - 0 - - - 0 0 - - 0 - - - 0 0 - - 0 - - - 0 0 - - 0 - - - 0 0 - - 0 - - - 0 0 - - 0 - - - 0 0 - - 0 - - - 0 0 - - 7 $3,864,900 $552,129 $550,000 5 8 95% 27 0 - - - 0 0 - - 0 - - - 0 0 - - 0 - - - 0 0 - - 0 - - - 0 0 - - 7 $3,864,900 $552,129 $550,000 5 8 95% 27 1 1 1 1 2 3 4 5
- 22. Toronto Real Estate Board Market Watch, June 2017 SUMMARY OF EXISTING HOME TRANSACTIONS DETACHED CONDOMINIUM, JUNE 2017 CITY OF TORONTO MUNICIPAL BREAKDOWN 22 Sales Dollar Volume Average Price Median Price New Listings Active Listings Avg. SP / LP Avg. DOM TREB Total City of Toronto Total Toronto West Toronto W01 Toronto W02 Toronto W03 Toronto W04 Toronto W05 Toronto W06 Toronto W07 Toronto W08 Toronto W09 Toronto W10 Toronto Central Toronto C01 Toronto C02 Toronto C03 Toronto C04 Toronto C06 Toronto C07 Toronto C08 Toronto C09 Toronto C10 Toronto C11 Toronto C12 Toronto C13 Toronto C14 Toronto C15 Toronto East Toronto E01 Toronto E02 Toronto E03 Toronto E04 Toronto E05 Toronto E06 Toronto E07 Toronto E08 Toronto E09 Toronto E10 Toronto E11 9 $5,739,900 $637,767 $625,000 11 14 97% 27 0 - - - 1 1 - - 0 - - - 0 0 - - 0 - - - 0 0 - - 0 - - - 0 0 - - 0 - - - 0 0 - - 0 - - - 0 0 - - 0 - - - 0 0 - - 0 - - - 0 0 - - 0 - - - 0 0 - - 0 - - - 0 0 - - 0 - - - 0 0 - - 0 - - - 0 0 - - 0 - - - 0 0 - - 0 - - - 0 0 - - 0 - - - 0 0 - - 0 - - - 0 0 - - 0 - - - 0 0 - - 0 - - - 0 0 - - 0 - - - 0 0 - - 0 - - - 0 0 - - 0 - - - 0 0 - - 0 - - - 0 0 - - 0 - - - 0 0 - - 0 - - - 0 0 - - 0 - - - 0 0 - - 0 - - - 0 0 - - 0 - - - 0 0 - - 0 - - - 1 1 - - 0 - - - 0 0 - - 0 - - - 0 0 - - 0 - - - 0 0 - - 0 - - - 0 0 - - 0 - - - 0 0 - - 0 - - - 0 0 - - 0 - - - 0 0 - - 0 - - - 0 0 - - 0 - - - 0 0 - - 0 - - - 0 0 - - 0 - - - 1 1 - - 1 1 1 1 2 3 4 5
- 23. Toronto Real Estate Board Market Watch, June 2017 SUMMARY OF EXISTING HOME TRANSACTIONS CO-OWNERSHIP APARTMENT, JUNE 2017 ALL TREB AREAS 23 Sales Dollar Volume Average Price Median Price New Listings Active Listings Avg. SP / LP Avg. DOM TREB Total Halton Region Burlington Halton Hills Milton Oakville Peel Region Brampton Caledon Mississauga City of Toronto Toronto West Toronto Central Toronto East York Region Aurora E. Gwillimbury Georgina King Markham Newmarket Richmond Hill Vaughan Whitchurch-Stouffville Durham Region Ajax Brock Clarington Oshawa Pickering Scugog Uxbridge Whitby Dufferin County Orangeville Simcoe County Adjala-Tosorontio Bradford West GwillimburyEssa Innisfil New Tecumseth 7 $2,889,000 $412,714 $360,000 9 8 103% 16 0 - - - 0 0 - - 0 - - - 0 0 - - 0 - - - 0 0 - - 0 - - - 0 0 - - 0 - - - 0 0 - - 0 - - - 0 0 - - 0 - - - 0 0 - - 0 - - - 0 0 - - 0 - - - 0 0 - - 7 $2,889,000 $412,714 $360,000 9 8 103% 16 1 $247,000 $247,000 $247,000 1 1 95% 0 5 $1,907,000 $381,400 $360,000 8 7 102% 12 1 $735,000 $735,000 $735,000 0 0 107% 51 0 - - - 0 0 - - 0 - - - 0 0 - - 0 - - - 0 0 - - 0 - - - 0 0 - - 0 - - - 0 0 - - 0 - - - 0 0 - - 0 - - - 0 0 - - 0 - - - 0 0 - - 0 - - - 0 0 - - 0 - - - 0 0 - - 0 - - - 0 0 - - 0 - - - 0 0 - - 0 - - - 0 0 - - 0 - - - 0 0 - - 0 - - - 0 0 - - 0 - - - 0 0 - - 0 - - - 0 0 - - 0 - - - 0 0 - - 0 - - - 0 0 - - 0 - - - 0 0 - - 0 - - - 0 0 - - 0 - - - 0 0 - - 0 - - - 0 0 - - 0 - - - 0 0 - - 0 - - - 0 0 - - 0 - - - 0 0 - - 0 - - - 0 0 - - 1 1 1 1 2 3 4 5
- 24. Toronto Real Estate Board Market Watch, June 2017 SUMMARY OF EXISTING HOME TRANSACTIONS CO-OWNERSHIP APARTMENT, JUNE 2017 CITY OF TORONTO MUNICIPAL BREAKDOWN 24 Sales Dollar Volume Average Price Median Price New Listings Active Listings Avg. SP / LP Avg. DOM TREB Total City of Toronto Total Toronto West Toronto W01 Toronto W02 Toronto W03 Toronto W04 Toronto W05 Toronto W06 Toronto W07 Toronto W08 Toronto W09 Toronto W10 Toronto Central Toronto C01 Toronto C02 Toronto C03 Toronto C04 Toronto C06 Toronto C07 Toronto C08 Toronto C09 Toronto C10 Toronto C11 Toronto C12 Toronto C13 Toronto C14 Toronto C15 Toronto East Toronto E01 Toronto E02 Toronto E03 Toronto E04 Toronto E05 Toronto E06 Toronto E07 Toronto E08 Toronto E09 Toronto E10 Toronto E11 7 $2,889,000 $412,714 $360,000 9 8 103% 16 7 $2,889,000 $412,714 $360,000 9 8 103% 16 1 $247,000 $247,000 $247,000 1 1 95% 0 0 - - - 0 0 - - 0 - - - 0 0 - - 0 - - - 0 0 - - 0 - - - 0 0 - - 1 $247,000 $247,000 $247,000 1 1 95% 0 0 - - - 0 0 - - 0 - - - 0 0 - - 0 - - - 0 0 - - 0 - - - 0 0 - - 0 - - - 0 0 - - 5 $1,907,000 $381,400 $360,000 8 7 102% 12 0 - - - 1 1 - - 1 $350,000 $350,000 $350,000 2 1 100% 1 2 $890,000 $445,000 $445,000 2 1 107% 13 1 $307,000 $307,000 $307,000 1 1 96% 27 0 - - - 0 0 - - 0 - - - 0 0 - - 0 - - - 0 1 - - 0 - - - 0 0 - - 0 - - - 2 2 - - 0 - - - 0 0 - - 0 - - - 0 0 - - 1 $360,000 $360,000 $360,000 0 0 100% 4 0 - - - 0 0 - - 0 - - - 0 0 - - 1 $735,000 $735,000 $735,000 0 0 107% 51 0 - - - 0 0 - - 1 $735,000 $735,000 $735,000 0 0 107% 51 0 - - - 0 0 - - 0 - - - 0 0 - - 0 - - - 0 0 - - 0 - - - 0 0 - - 0 - - - 0 0 - - 0 - - - 0 0 - - 0 - - - 0 0 - - 0 - - - 0 0 - - 0 - - - 0 0 - - 1 1 1 1 2 3 4 5
- 25. Toronto Real Estate Board Market Watch, June 2017 FOCUS ON THE MLS HOME PRICE INDEX INDEX AND BENCHMARK PRICE, JUNE 2017 ALL TREB AREAS 25 Composite Single-Family Detached Single-Family Attached Townhouse Apartment Index Benchmark Yr./Yr. % Chg. Index Benchmark Yr./Yr. % Chg. Index Benchmark Yr./Yr. % Chg. Index Benchmark Yr./Yr. % Chg. Index Benchmark Yr./Yr. % Chg. TREB Total Halton Region Burlington Halton Hills Milton Oakville Peel Region Brampton Caledon Mississauga City of Toronto York Region Aurora East Gwillimbury Georgina King Markham Newmarket Richmond Hill Vaughan Whitchurch-Stouffville Durham Region Ajax Brock Clarington Oshawa Pickering Scugog Uxbridge Whitby Dufferin County Orangeville Simcoe County Adjala-Tosorontio Bradford West GwillimburyEssa Innisfil New Tecumseth 266.7 $810,700 25.33% 277.3 $1,027,200 24.18% 276.5 $777,900 22.18% 265.8 $589,700 29.09% 233.9 $467,400 30.60% 275.5 $888,300 25.06% 280.0 $1,032,800 24.11% 279.6 $715,300 23.88% 293.3 $541,000 31.05% 240.0 $443,800 23.46% 274.1 $744,600 24.59% 281.8 $954,000 23.49% 277.9 $666,700 24.17% 299.9 $551,200 30.85% 239.6 $394,400 22.93% 252.0 $745,800 19.32% 252.3 $820,900 19.12% 253.6 $574,600 18.34% 263.1 $422,800 31.95% 228.5 $461,900 23.71% 252.0 $747,000 18.98% 250.0 $894,700 18.04% 259.5 $627,200 18.33% 265.6 $439,700 32.93% 233.8 $476,200 24.23% 291.9 $1,067,800 27.41% 296.4 $1,252,900 25.54% 305.1 $851,900 26.18% 293.5 $635,100 31.26% 242.6 $466,000 23.97% 251.9 $715,400 24.58% 254.0 $896,800 22.82% 256.5 $656,600 22.43% 252.1 $541,300 27.71% 228.4 $392,600 30.37% 255.2 $647,200 26.46% 250.4 $731,300 24.89% 255.6 $599,500 24.26% 251.9 $460,600 32.09% 230.8 $344,500 39.46% 232.8 $854,900 27.77% 234.0 $889,500 28.78% 262.0 $647,200 27.56% - - - 222.1 $539,900 24.15% 250.7 $744,200 22.83% 262.4 $1,048,100 19.49% 257.4 $709,900 19.78% 252.1 $566,700 26.24% 228.1 $402,100 28.94% 255.9 $829,500 24.22% 274.7 $1,205,400 19.80% 275.8 $919,400 18.57% 261.7 $631,400 27.04% 236.3 $485,200 32.16% 301.4 $1,017,500 25.58% 315.5 $1,200,600 26.50% 307.4 $889,400 22.71% 265.8 $680,500 30.29% 218.8 $481,000 27.06% 302.8 $1,002,000 28.20% 307.3 $1,160,800 27.72% 305.4 $787,600 27.25% 273.4 $747,500 35.68% 260.2 $543,900 23.08% 280.1 $957,100 37.64% 284.8 $1,015,000 37.65% 283.4 $592,800 33.30% - - - - - - 289.7 $552,000 39.08% 297.2 $560,400 39.01% 294.6 $580,800 33.85% - - - - - - 272.6 $1,140,500 26.97% 275.4 $1,145,600 26.85% 277.8 $650,600 24.63% - - - 216.6 $592,400 23.14% 306.0 $1,060,400 23.24% 339.7 $1,397,500 24.66% 315.8 $944,500 21.79% 248.1 $654,900 24.92% 212.7 $509,100 30.89% 279.2 $822,700 25.09% 283.6 $955,900 24.44% 280.1 $659,700 20.89% 269.6 $559,800 37.90% 275.4 $463,900 27.56% 333.3 $1,197,400 28.29% 364.9 $1,550,700 29.31% 333.7 $1,014,200 25.50% 282.7 $715,900 37.84% 228.2 $464,400 27.56% 282.2 $1,020,700 22.32% 283.5 $1,178,500 23.21% 296.0 $896,700 20.47% 288.3 $783,900 25.79% 209.9 $484,400 23.62% 311.1 $1,072,100 25.75% 314.1 $1,126,800 25.99% 268.6 $737,800 23.89% 245.3 $440,400 39.61% 269.6 $598,900 25.63% 261.4 $610,500 29.53% 257.8 $669,900 29.16% 268.3 $535,800 27.40% 268.2 $425,400 36.28% 243.2 $414,700 31.03% 267.5 $659,200 27.08% 268.6 $720,600 27.00% 274.2 $591,700 28.79% 253.0 $462,500 26.69% 225.5 $365,500 36.50% 203.9 $370,900 28.72% 205.1 $374,300 28.83% - - - - - - - - - 252.5 $533,000 27.91% 245.7 $591,700 28.37% 247.4 $472,600 18.60% 306.4 $480,000 50.86% 218.7 $324,200 34.83% 267.4 $509,100 33.83% 259.6 $554,000 32.11% 281.1 $470,500 33.03% 292.4 $363,100 51.82% 232.3 $272,400 25.36% 263.0 $705,300 24.94% 258.9 $806,600 23.52% 266.0 $620,700 24.47% 260.6 $465,300 27.25% 283.5 $526,900 33.16% 232.3 $606,500 31.99% 239.6 $620,700 32.60% 225.4 $471,700 26.77% - - - - - - 238.2 $728,100 29.04% 236.5 $730,300 28.67% 233.8 $573,700 29.67% - - - - - - 265.8 $692,200 30.17% 268.6 $772,500 30.26% 270.5 $595,900 28.99% 225.1 $409,900 21.41% 227.5 $412,400 29.11% 258.7 $593,000 31.79% 270.2 $615,800 31.04% 252.6 $473,300 32.53% - - - - - - 258.7 $593,000 31.79% 270.2 $615,800 31.04% 252.6 $473,300 32.53% - - - - - - 266.7 $598,700 26.70% 261.5 $607,900 25.84% 270.8 $507,400 29.88% - - - - - - 238.6 $718,000 17.59% 238.5 $719,300 17.55% - - - - - - - - - 291.4 $710,200 29.40% 273.7 $748,900 29.04% 293.8 $610,600 30.17% - - - - - - 256.5 $490,000 24.03% 257.4 $513,300 21.99% 257.8 $401,400 29.74% - - - - - - 277.7 $537,600 27.62% 276.8 $535,000 26.80% 276.3 $422,400 33.74% - - - - - - 234.8 $557,900 25.16% 233.7 $592,300 24.64% 245.0 $444,000 28.07% - - - - - -
- 26. Toronto Real Estate Board Market Watch, June 2017 FOCUS ON THE MLS HOME PRICE INDEX INDEX AND BENCHMARK PRICE, JUNE 2017 CITY OF TORONTO 26 Composite Single-Family Detached Single-Family Attached Townhouse Apartment Index Benchmark Yr./Yr. % Chg. Index Benchmark Yr./Yr. % Chg. Index Benchmark Yr./Yr. % Chg. Index Benchmark Yr./Yr. % Chg. Index Benchmark Yr./Yr. % Chg. TREB Total City of Toronto Toronto W01 Toronto W02 Toronto W03 Toronto W04 Toronto W05 Toronto W06 Toronto W07 Toronto W08 Toronto W09 Toronto W10 Toronto C01 Toronto C02 Toronto C03 Toronto C04 Toronto C06 Toronto C07 Toronto C08 Toronto C09 Toronto C10 Toronto C11 Toronto C12 Toronto C13 Toronto C14 Toronto C15 Toronto E01 Toronto E02 Toronto E03 Toronto E04 Toronto E05 Toronto E06 Toronto E07 Toronto E08 Toronto E09 Toronto E10 Toronto E11 267 $810,700 25.33% 277 $1,027,200 24.18% 277 $777,900 22.18% 266 $589,700 29.09% 234 $467,400 30.60% 256 $829,500 24.22% 275 $1,205,400 19.80% 276 $919,400 18.57% 262 $631,400 27.04% 236 $485,200 32.16% 223 $898,800 15.25% 226 $1,181,400 8.02% 248 $956,300 9.98% 238 $503,300 19.56% 213 $482,500 22.01% 263 $936,900 11.47% 260 $1,099,000 6.56% 297 $911,200 8.15% 252 $594,600 15.62% 236 $505,800 27.44% 283 $730,700 22.50% 293 $795,400 23.77% 281 $720,200 18.40% 239 $487,100 18.63% 237 $408,000 30.01% 250 $639,200 25.49% 265 $834,300 24.60% 241 $696,300 17.23% 218 $516,100 22.15% 227 $332,700 32.63% 228 $541,400 24.17% 254 $842,400 20.72% 232 $676,000 19.64% 215 $389,500 34.65% 210 $275,400 31.00% 203 $593,100 18.70% 280 $892,700 21.67% 222 $672,700 15.56% 300 $891,900 38.78% 158 $400,600 23.90% 238 $1,018,500 21.85% 254 $1,098,700 19.80% 219 $899,200 12.29% 0 $0 -100.00% 146 $590,000 27.86% 212 $846,000 21.81% 220 $1,151,000 14.09% 213 $789,100 10.02% 237 $569,300 31.50% 204 $424,800 30.69% 231 $580,500 18.99% 235 $876,000 12.72% 205 $588,300 10.71% 247 $643,200 24.10% 221 $283,600 31.59% 242 $557,400 31.17% 254 $761,100 24.55% 254 $648,700 24.94% 203 $431,700 22.33% 237 $329,700 48.00% 263 $650,500 27.85% 287 $1,086,900 16.34% 277 $968,300 12.76% 272 $773,400 28.24% 260 $540,900 30.42% 256 $1,222,100 17.53% 244 $1,948,700 19.44% 279 $1,464,300 18.51% 266 $1,186,500 12.44% 240 $683,200 19.36% 297 $1,554,400 25.60% 288 $1,767,500 25.10% 298 $1,105,800 21.86% - - - 310 $814,400 28.04% 254 $1,565,700 22.32% 262 $1,846,600 21.57% 261 $1,221,900 15.69% 298 $1,096,800 47.14% 214 $495,900 30.33% 294 $1,145,300 26.66% 323 $1,380,900 23.30% 235 $867,500 15.52% 235 $630,500 21.12% 265 $586,300 31.56% 272 $942,400 25.65% 352 $1,608,000 24.42% 251 $897,100 17.64% 233 $657,900 20.31% 227 $553,100 32.22% 248 $649,200 27.61% 283 $1,648,200 19.00% 279 $1,331,900 15.42% 253 $660,700 18.22% 246 $530,700 30.17% 172 $1,216,100 18.08% 141 $1,776,200 7.04% 157 $1,273,500 4.19% 266 $1,456,400 23.56% 191 $631,800 26.71% 261 $1,018,200 17.90% 281 $1,732,400 13.33% 270 $1,331,400 9.15% 257 $750,400 18.21% 253 $604,200 22.70% 246 $869,800 22.41% 214 $1,459,100 10.47% 240 $1,062,700 9.99% 218 $377,300 22.50% 273 $396,400 31.69% 235 $2,006,700 20.86% 231 $2,474,700 18.53% 299 $1,252,000 19.59% 220 $880,200 21.48% 252 $789,200 28.29% 261 $945,800 23.67% 312 $1,662,300 23.20% 274 $875,600 19.30% 243 $702,800 26.68% 214 $430,900 28.22% 274 $894,400 36.34% 347 $1,878,800 23.37% 275 $1,339,100 17.27% 325 $874,500 39.06% 244 $615,000 45.62% 268 $869,100 26.32% 370 $1,737,300 29.64% 311 $1,012,400 24.36% 296 $708,900 34.65% 206 $479,900 30.88% 321 $1,001,400 27.67% 323 $1,141,200 24.82% 330 $1,041,900 26.75% 372 $679,300 34.74% 272 $646,100 32.30% 282 $1,059,700 23.60% 246 $1,119,900 21.20% 298 $997,600 24.96% 309 $928,300 31.24% 261 $714,100 21.09% 267 $820,100 20.25% 280 $943,300 21.49% 252 $823,600 16.44% - - - 223 $325,900 26.91% 261 $644,600 23.58% 258 $761,200 11.68% 270 $651,600 20.66% 249 $539,600 27.58% 271 $415,500 53.25% 257 $674,600 18.97% 285 $1,002,300 14.21% 282 $776,800 16.20% 271 $589,800 19.58% 213 $417,800 26.01% 277 $771,600 22.16% 281 $803,700 21.98% 282 $670,800 25.50% 245 $605,600 18.54% 240 $506,600 28.83% 269 $660,400 21.68% 302 $991,200 17.12% 297 $776,600 21.67% 280 $606,100 18.51% 236 $403,300 28.48% 262 $631,800 30.05% 270 $840,000 21.12% 244 $632,500 24.36% 257 $525,400 36.33% 249 $396,800 49.46% 249 $595,800 24.97% 264 $748,500 14.26% 252 $616,900 15.85% 284 $527,600 36.69% 231 $433,500 38.88% 279 $781,200 27.26% 273 $874,100 24.00% 266 $689,700 27.64% 322 $561,500 38.74% 225 $363,300 45.05% 264 $577,000 28.49% 284 $789,400 22.75% 277 $627,400 23.72% 201 $395,100 14.77% 272 $405,400 56.99%
- 27. Toronto Real Estate Board Market Watch, June 2017 HISTORIC ANNUAL STATISTICS 27 Year Sales Average Price 2005 2006 2007 2008 2009 2010 2011 2012 2013 2014 2015 84,145 $335,907 83,084 $351,941 93,193 $376,236 74,552 $379,347 87,308 $395,460 85,545 $431,276 89,096 $465,014 85,496 $497,130 87,049 $522,958 92,782 $566,624 101,213 $622,121 2016 MONTHLY STATISTICS NOTES 1 - Sales, dollar volume, average sale prices and median sale prices are based on firm transactions entered into the TREB MLS® system between the first and last day of the month/period being reported. 2 - New listings entered into the TREB MLS® system between the first and last day of the month/period being reported. 3 - Active listings at the end of the last day of the month/period being reported. 4 - Ratio of the average selling price to the average listing price for firm transactions entered into the TREB MLS® system between the first and last day of the month/period being reported. 5 - Average number of days on the market for firm transactions entered into the TREB MLS® system between the first and last day of the month/period being reported. 6 - Due to past changes to TREB's service area, caution should be exercised when making historical comparisons. 7 - Past monthly and year-to-date figures are revised on a monthly basis. 8 - SNLR = Sales-to-New Listings Ratio. Calculated using a 12-month moving average (sales/new listings). 9 - Mos. Inv. = Months of Inventory. Calculated using a 12-month moving average (active listings/sales). 2017 MONTHLY STATISTICS *For historic annual sales and average price data over a longer time frame go to: January February March April May June July August September October November December Year to Date 5,156 $768,373 7,963 $876,654 12,001 $917,057 11,553 $919,589 10,166 $864,191 7,974 $793,915 - - - - - - - - - - - - 54,813 $856,630 January February March April May June July August September October November December Annual 4,640 $630,193 7,582 $685,628 10,260 $688,011 12,016 $739,762 12,790 $752,100 12,725 $747,018 9,929 $710,471 9,748 $710,978 9,830 $756,021 9,716 $762,649 8,502 $777,041 5,306 $730,037 113,044 $729,823 1,6,7 1,7 1,7 http://www.torontorealestateboard.com/market_news/market_watch/historic_stats/p df/TREB_historic_statistics.pdf Copyright® 2017 Toronto Real Estate Board $870,01654,813