1. METHODOLOGY
California NAIP Imagery is a high resolution satellite dataset administered
by the US Department of Agriculture. The Imagery displayed is from the year
2014 with a 1mx1m spatial resolution of Earth’s surface. It was used as the base
map for the study area and is displayed in true color.
Overlaying the image is Urban Area taken from the 2011 National Land
Cover Data Set(NLCD) distributed by the U.S Geological Survey (USGS). Urban
Area was extracted from the dataset using a series of raster-based reclassification
processes. The data displayed is a result of a three year Inverse Distance
Weighted (IDW) Interpolation of earthquakes by magnitude for the years 2013 –
2015. See bottom right of poster. In the analysis, the urban area dataset was
combined with the interpolated surface using a weighted sum.
This map classifies urban areas of Northern and Southern California on a
color ramp from yellow to dark blue. The areas that appear darker in color are
regions of high magnitude earthquake activity over the last three years.
Year
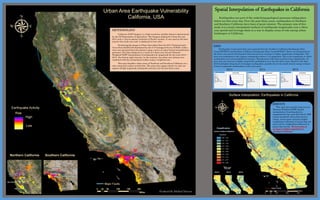
RESULTS
This map was created using Inverse
Distance Weighted (IDW) spatial
interpolation of earthquakes by
magnitude for the years 2013-2015. IDW
creates predicted values from known
values across space and gives higher
weight(more influence) to points that are
near and low weights(less influence) to
points that are far. We have seen an
increase in higher magnitudes in
Southern California!
DATA
Earthquake events point data was acquired from the Northern California Earthquake Data
Center(NCEDC) and Southern California Earthquake Data Center(SCEDC). Below are histograms for
the three year period showing that there has been an increase in higher magnitude earthquakes. The
data was condensed to only capture earthquakes above a 3.0 magnitude. This is the magnitude at which
earthquakes are just perceptible by humans. Though most of the data contains lower magnitudes, we
have seen an increase in higher magnitude earthquakes over the last three years. Based on the data,
2015 had higher frequencies of stronger earthquakes, possibly due to the small seismic energy releases
of lower magnitude earthquakes in the years prior.
201520142013
Spatial Interpolation of Earthquakes in California
Earthquakes are part of the underlying geological processes taking place
below our feet every day. Over the past three years, earthquakes in Northern
and Southern California have been of great interest. The primary aim of this
study is to create interpolated surfaces of earthquake magnitudes over a three
year period and leverage them in a way to display areas of risk among urban
landscapes in California.
Produced By Michael Nassour