What's next for travel demand and energy in transport?
FY15 summary report revised
1. 177 Tremont Street Boston, MA
Phone: 617-426-6054 Fax: 617-451-2054
Info@mbtaadvisoryboard.org mgensler@mbtaadvisoryboard.org
Fiscal Year 2015 Daily Service Summary
The following report outlines findings from staff analysis on MBTA bus and subway daily service reports for
FY2015. The service reports are received from MBTA’s Operations and Control Center (OCC). Figures from
FY2014 are included as comparison to illustrate change over time. Both weekday and weekend figures were
tracked and analyzed to provide a complete picture of service reliability.
FY2015 experienced 49,943 total dropped, or missed, trips. A dropped trip is a scheduled bus, heavy rail
(blue, orange, and red lines) or light rail (green line and Mattapan trolley) trip that is not completed. For
bus service, a dropped trip occurs when a trip listed on a published schedule is not completed. The Advisory
Board monitors dropped trips and keeps track of the reasons why they occur. On a daily basis, MBTA
experiences between 100 and 200 dropped trips. Most of these missed trips occur on bus service, and
decrease reliability.
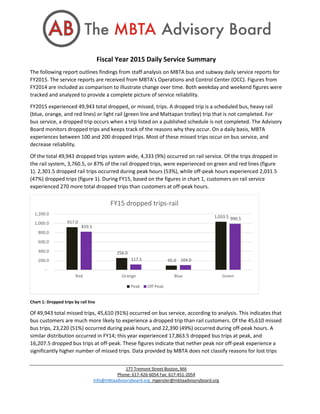
Of the total 49,943 dropped trips system wide, 4,333 (9%) occurred on rail service. Of the trips dropped in
the rail system, 3,760.5, or 87% of the rail dropped trips, were experienced on green and red lines (figure
1). 2,301.5 dropped rail trips occurred during peak hours (53%), while off-peak hours experienced 2,031.5
(47%) dropped trips (figure 1). During FY15, based on the figures in chart 1, customers on rail service
experienced 270 more total dropped trips than customers at off-peak hours.
Chart 1: Dropped trips by rail line
Of 49,943 total missed trips, 45,610 (91%) occurred on bus service, according to analysis. This indicates that
bus customers are much more likely to experience a dropped trip than rail customers. Of the 45,610 missed
bus trips, 23,220 (51%) occurred during peak hours, and 22,390 (49%) occurred during off-peak hours. A
similar distribution occurred in FY14; this year experienced 17,863.5 dropped bus trips at peak, and
16,207.5 dropped bus trips at off-peak. These figures indicate that nether peak nor off-peak experience a
significantly higher number of missed trips. Data provided by MBTA does not classify reasons for lost trips
917.0
256.0
95.0
1,033.5
819.5
117.5 104.0
990.5
-
200.0
400.0
600.0
800.0
1,000.0
1,200.0
Red Orange Blue Green
FY15 dropped trips-rail
Peak Off Peak
2. 2
by peak and off-peak, so Advisory Board analysis is not able to determine if there are trends in reasons for
lost trips during peak compared to off-peak.
Dropped trips impacted MBTA service reliability throughout FY2015. Between FY2014 and FY2015, total
missed trips increased 29% (from 38,816.5 to 49,943 trips). During this time, total scheduled trips increased
by 20,972.5, less than 1%. In FY2015, percentage of total trips run decreased 0.3% from FY2014. This
decrease mostly occurred on bus service, which saw 2% fewer trips run in FY15 than in FY14. Heavy and
light rail (subway and trolley) service saw no difference in trips run between these two years.
Chart 2: Percent of subway and trolley trips run in Fiscal Year 2014
Chart 3: Percent of subway and trolley trips run in Fiscal Year 2015
The largest contrast of peak and off-peak missed rail trips occurred on the orange line (chart 1). Peak hours
saw more than double the number of orange line drops than off-peak. Aside from the orange line, there
does not seem to be a clear distinction between dropped rail trips at peak and off-peak hours. Total missed
trips (bus and rail combined) during peak hours for FY15 totaled 25,521.5 trips, while missed trips during
off-peak hours totaled 24,421.5 trips. The peak/off-peak difference of 1100 trips is smaller than in FY14,
where peak hours experienced 2427.5 more missed trips than off-peak hours.
99.3%
99.4%
99.6% 99.6%
99.5% 99.5%
98.9%
98.7%
99.1%
99.0%
98.8%
99.1%
98.2%
98.4%
98.6%
98.8%
99.0%
99.2%
99.4%
99.6%
99.8%
July Aug Sept Oct Nov Dec Jan Feb Mar Apr May Jun
Subway/trolley % trips run-FY14
99.1%
99.6% 99.4% 99.5% 99.4% 99.3%
99.0%
94.8%
99.5% 99.7%
99.4% 99.3%
92.0%
93.0%
94.0%
95.0%
96.0%
97.0%
98.0%
99.0%
100.0%
101.0%
July Aug Sept Oct Nov Dec Jan Feb Mar Apr May Jun
Subway/trolley % trips run-FY15
3. 3
Not surprisingly, dropped trips attributed to weather increased in FY15. Service in late January and
February was severely impacted by heavy snow. According to MBTA Advisory Board monthly reports,
February saw 8,671.5 missed trips, the highest monthly total for FY2015. MBTA suspended service system-
wide on January 27th
in anticipation of heavy snow. Rail service was suspended due to heavy snow
accumulation on February 10th
. Limited bus service ran on this day, and figures provided by MBTA indicate
100% of rail trips run on February 10th
despite the service suspension.
Accumulation of snow and ice on surface rail lines and roadways reduced the percent of scheduled rail trips
run in February (2.6% from January; chart 3). Red line trips in Braintree and Quincy were replaced with bus
service for several weeks during this month. It is likely that because bus service was available, missed trips
on the red line in Braintree and Quincy were not recorded.
Scheduled (including not run) rail trips run decreased 6.6% from January, and scheduled bus trips run
decreased 6.5%. It is possible that due to recording methods the percentage of trips run in February could
be lower. Comparing FY2015 to FY2014, it appears weather conditions significantly decrease the
percentage of subway and trolley trips run in February of these two years. Monthly, February shows the
lowest percentage of rail trips run for both FY14 and FY15 (charts 2 and 3).
These figures suggest weather conditions in February caused the number of total trips run to decrease
significantly. This “weather conditions” category does not explain completely why a trip was dropped; if it
was not a category, totals of missed trips attributed to disabled train and other categories impacted by
weather would likely rise. The impact of weather conditions on fragile MBTA equipment and infrastructure
likely caused the increase in dropped trips due to weather.
Chart 4: FY2015 percent of bus trips run
Chart 4 above shows the percentage of bus trips run by month for FY15. The largest monthly difference
(2.8%) occurred between January and February. The highest percentage (98.8%) occurred in January,
despite a service suspension on the 27th
. The lowest percentage of bus trips run (96%) occurred in February.
Incidentally, the highest FY15 monthly total of dropped trips (2,389-chart 5) attributed to Family Medical
Leave Act (FMLA) was recorded this month.
98.3%
97.1%
98.5%
98.2% 98.1% 98.1%
98.8%
96.0%
97.8%
98.6%
98.5%
98.0%
94.5%
95.0%
95.5%
96.0%
96.5%
97.0%
97.5%
98.0%
98.5%
99.0%
99.5%
July Aug Sept Oct Nov Dec Jan Feb Mar Apr May Jun
Bus % trips run-FY15
4. 4
Chart 5: FY2015 total dropped trips attributed to FMLA
These figures suggest factors of than weather conditions impacted bus service in January and February. Rail
service was suspended on February 10th
due to severe weather; the number of bus trips run on this day was
reduced significantly. Similar suspensions did not occur in FY14. Comparing figures for FY15 monthly total
missed trips due to FMLA (chart 5) and percentage of bus trips run (chart 4), lost trips attributed to FMLA
significantly impact bus service.
Chart 6: FY2014 percent of bus trips run
870.5
1354
758
1011.5
810.5
1385.5
692
2389
1476.5
741.5 747
1312.5
0
500
1000
1500
2000
2500
3000
July Aug Sept Oct Nov Dec Jan Feb Mar Apr May Jun
FY15 Total FMLA missed trips
98.4%
98.3%
99.0% 99.0% 99.0%
98.3%
98.7%
98.6% 98.6%
98.2% 98.2%
98.0%
97.0%
97.5%
98.0%
98.5%
99.0%
99.5%
July Aug Sept Oct Nov Dec Jan Feb Mar Apr May Jun
Bus % trips run-FY14
5. 5
Chart 7: FY2015 total dropped bus trips classified by garage
As mentioned above, bus service in FY15 saw a total 45,610 (91% of total dropped trips) missed trips. Of
these trips, 26,290 (58%) originated from Arborway, Cabot, and Charlestown garages (chart 7). More daily
bus trips originate from these garages than others.
The leading cause of dropped trips for both FY2015 and FY2014 is Family Medical Leave Act (FMLA).
Reviewing the charts on page 7, FY15 saw 13,548 trips lost attributed to FMLA, a 34% increase from FY14.
FY15 saw 8,284.5 trips missed attributed to No Crew, an increase of 7,112.5 trips (600%) from FY14. It is
possible that different recording methods resulted in increases of total lost trips attributed to FMLA and No
Crew. Crew is not available when a trip is dropped due to FMLA.
“Vacant work” and “No Crew” are defined similarly; it is possible these categories are interpreted
differently by the many supervisors that submit daily service figures. “No Crew” is defined as “a trip lost
due to unavailable operators”. “Vacant work” is defined as “no operator either picked or assigned to a
certain trip”. The difference between these two reasons appear to be subtle.
There is a lack of consistency from year to year in the way MBTA records reasons for dropped trips.
Changes in recording methods and reasons given for dropped trips could explain the difference in total
drops due to “No Crew” in FY2014 and FY2015. According to MBTA Advisory Board staff analysis, FY15 saw
167.5 trips lost attributed to vacant work, while FY14 experienced 1,832 dropped trips attributed to this
reason. The 1,664 trip decrease in trips lost due to “Vacant Work” is unusual-FY13 saw 1,990 trips lost due
to “vacant work”, a 158 trip difference from FY14. Additionally, in FY15 762.5 dropped trips were attributed
to “10-hour rule”, a reason not used in FY14.
The lack of consistency in recording methods is evident when comparing total dropped trips by category
(see tables on page 7). The “accident/emergency”, “supervisor action”, and “other” categories show
significantly different totals for FY14 and FY15. FY15 experienced 5 times as many total trips dropped
attributed to accident/emergency than FY14. Trips lost dues to supervisor action decreased 43% from FY14.
Dropped trips attributed to “other” decreased 96% from FY14; figures in this category for FY14 and FY15
suggest recording methods may have changed or interpreted differently between these 2 years.
The total number of trips dropped due to Operator Diverted has increased significantly from FY14. 2023.5
trips lost in FY15 were attributed to this category (chart 8); FY14 saw just 47 dropped trips due to operator
-
1,000.0
2,000.0
3,000.0
4,000.0
5,000.0
FY15 dropped bus trips by garage
Peak Off Peak
6. 6
diverted (chart 9). It is unclear what caused this change; more operator diversions, different recording
methods or interpretations of “operator diverted” could be reasons. These inconsistencies make tracking
MBTA operations unnecessarily difficult. Inconsistencies in recording methods are apparent when
comparing FY2014 and FY2015 daily missed trip reports.
Drops due to “disabled bus” and “disabled train” did not increase significantly (charts 8 and 9). Trips lost
due to disabled vehicle will be examined more closely in a separate document.
Dropped Trips Report: Comparing FY15 & FY14
OVERVIEW FY15 FY14 Difference
Total Dropped Trips 49,943.0 38,816.5 11126.5
Average Dropped Per Day 136.8 106.3 30.5
Total Scheduled 2,707,691.5 2,686,719.0 20972.5
Total Run 2657748.5 2,647,902.00 9846.5
*RUN TRIPS FY15 FY14 Difference
% Run - Rail 99.0% 99.0% 0
% Run - Bus 96.6% 98.5% -1.9%
% Run - Total 98.2% 98.5% -0.3%
*VEHICLE AVAILABILITY AM FY15 PM FY15 AM FY14 PM FY14
% Available - Rail 101.0% 101.5% 102.9% 103.1%
% Available - Bus 101.8% 101.3% 103.1% 103.5%
% Available - Total 101.5% 101.4% 102.8% 103.1%
PEAK V. OFF-PEAK Peak FY15 Off-Peak FY15 Peak FY14 Off-Peak FY14
Dropped Rail 2301.5 2031.5 2758.5 1987.0
Dropped Bus 23220.0 22390.0 17863.5 16207.5
Dropped Total 25521.5 24421.5 20622.0 18194.5
8. 8
Chart 8: Top 10 causes of dropped trips in FY2015 Chart 9: top 10 causes of dropped trips for FY2014.
compared to FY2014 totals for same causes.
*figures do not include weekends
** “10 hour rule” was not a category used during FY2014
*Top 10 FY15
Causes
Total
missed
trips
FY14
figures
FMLA 13,548.5 10,114
No Crew 8,284.5 1,172
Op. Sick 6,462.0 4,322.5
Disabled Bus 4,774.0 4,659
Traffic
Conditions
2,545.0 1,518.5
Op. Diverted 2,023.5 47
No
Equipment
1,331.0 1,752.5
10 Hour Rule 762.5 **
Weather 650.0 96
Disabled Train 646.0 673.5
*Top 10 FY14
Causes
Total missed trips
FMLA 10,114.0
Disabled Bus 4,659.0
Op. Sick 4,322.5
Vacant Work 1,832.0
No Equipment 1,752.5
Traffic Conditions 1,518.5
No Crew 1,172.0
UEA/AWOL 1,001.5
Disabled Train 673.5
Op. issued V Day 469.5