Innovative strategies to engage parents of all backgrounds
GAR1
1. C
Monday, June 22, 2015 Big Picture • Local Focus $1.00
Paddock Publications • 143rd Year • No. 251
Northwest Suburbs
dailyherald.com
Asa Arreola never knew he was poor. As a child
in Carpentersville he bunked with his grand-
mother because his mother, a single parent,
worked long hours. His grandparents didn’t speak
English and couldn’t help him with homework.
But at tiny Sunny Hill Elementary
School his life looked like everybody
else’s — they spoke Spanish at home
and had parents who were preoccu-
pied with providing shelter and food.
He saw his friends, at 12 or 14, already
start to work in their families’ land-
scaping businesses.
Then he got to Barrington High
School, where for the first time he
realized there were other kinds of
lives — middle class and even affluent lives. Arre-
ola had returned to his mother by then — trusted
to be home alone, to cook his own meals, to stay on
schedule and be independent. It was hard.
“It made me stronger,” Arreola says now of his
experiences. He just finished his freshman year at
DePaul University, where he is majoring in biologi-
cal sciences and eventually wants to be a surgeon.
“You realize how much people take for granted
and how you’ve got to hold on to what you’ve got.”
He also realizes, despite his per-
sonal success, how hard it is for poor
children to achieve the same basic
things as middle-class children.
“Money and income really do
affect certain things,” says Arreola. “I
don’t like to play the whole socioeco-
nomic card, but people see a Latino
with less money and they think less
of them, so I have to work harder to
prove I can be a good part of society.”
* * *
Not every low-income student is as mature, or
as gifted, as Arreola was in his formative years. But
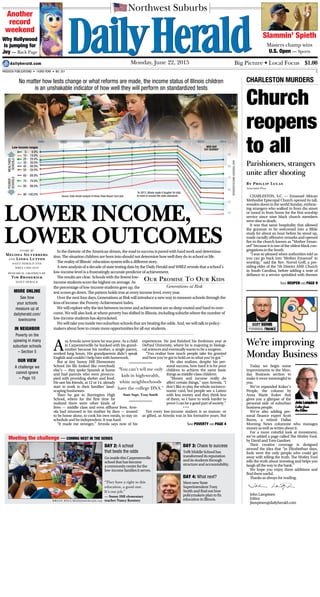
40
50
60
70
80
90
100%
ISATPERCENTMEETS/EXCEEDS
2006 2007 2008 2009 2010 2011 2012 2013 2014
NEW ISAT
CUT SCORES*
0 - 9.9%
10 - 19.9%
20 - 29.9%
30 - 39.9%
40 - 49.9%
50 - 59.9%
60 - 69.9%
70 - 79.9%
80 - 89.9%
90 -100.0%
WEALTHIER
SCHOOLS
POORER
SCHOOLS
Low-income ranges
Source: Daily Herald analysis of Illinois State Report Card data
*In 2013, Illinois made it tougher for kids
to meet or exceed the state standards.
In the rhetoric of the American dream, the road to success is paved with hard work and determina-
tion. The situation children are born into should not determine how well they do in school or life.
The reality of Illinois’ education system tells a different story.
A new analysis of a decade of state testing data by the Daily Herald and WBEZ reveals that a school’s
low-income level is a frustratingly accurate predictor of achievement.
The results are clear. Schools with the fewest low-
income students score the highest on average. As
the percentage of low-income students goes up, the
test scores go down. The pattern holds true at every income level, every year.
Over the next four days, Generations at Risk will introduce a new way to measure schools through the
lens of income: the Poverty-Achievement Index.
We will explore why the ties between income and achievement are so deep-rooted and hard to over-
come. We will also look at where poverty has shifted in Illinois, including suburbs where the number of
low-income students has skyrocketed.
We will take you inside two suburban schools that are beating the odds. And, we will talk to policy-
makers about how to create more opportunities for all our students.
Meeting the challenge — COMING NEXT IN THE SERIES
DAY 2: A school
that beats the odds
DAY 3: Chaos to success
DAY 4: What next?
Story by
Melissa Silverberg
and Linda Lutton
Daily Herald and
WBEZ Chicago
Research, Graphics by
Tim Broderick
Daily Herald
“They have a right to this
education, a good one.
It’s our job.”
— Sunny Hill elementary
teacher Nancy Kontney
Go inside this Carpentersville
school that has become
a community center for the
low-income families it serves.
Tefft Middle School has
transformed its reputation
and its students through
structure and accountability.
Meet new State
Superintendent Tony
Smith and find out how
policymakers plan to fix
education in Illinois.
MORE ONLINE
See how
your schools
measure up at
dailyherald.com/
lowincome
IN NEIGHBOR
Poverty on the
upswing in many
suburban schools
– Section 5
Our View
A challenge we
cannot ignore
– Page 10
No matter how tests change or what reforms are made, the income status of Illinois children
is an unshakable indicator of how well they will perform on standardized tests
“You can’t tell me only
kids in high-wealth,
white neighborhoods
have the college DNA.”
State Supt. Tony Smith
Lower income,
lower outcomes
Our Promise To Our Kids
Generations at Risk
B r i a n H i l l / bhill@dailyherald.com
See POVERTY on Page 4
Today we begin some
improvements to the Mon-
day Business section to
make it more meaningful to
you.
We’ve expanded Kukec’s
People, the column by
Anna Marie Kukec that
gives you a glimpse of the
personal side of suburban
business people.
We’re also adding per-
sonal finance expert Scott
Burns, a retired Dallas
Morning News columnist who manages
money as well as writes about it.
For a more colorful look at investment,
we’ve added a page called The Motley Fool,
by David and Tom Gardner.
Their creative coverage is designed
around the idea that “in Elizabethan days,
fools were the only people who could get
away with telling the truth. The Motley Fool
tells the truth about investing and helps you
laugh all the way to the bank.”
We hope you enjoy these additions and
find them useful.
Thanks as always for reading.
John Lampinen
Editor
jlampinen@dailyherald.com
We’re improving
Monday Business
By Phillip Lucas
Associated Press
CHARLESTON, S.C. — Emanuel African
Methodist Episcopal Church opened its tall,
wooden doors to the world Sunday, embrac-
ing strangers who walked in from the street
or tuned in from home for the first worship
service since nine black church members
were shot to death.
It was that same hospitality that allowed
the gunman to be welcomed into a Bible
study for about an hour before he stood up,
made racially offensive remarks and opened
fire in the church known as “Mother Eman-
uel” because it is one of the oldest black con-
gregations in the South.
“I was so pleased when authorities told us
you can go back into ‘Mother Emanuel’ to
worship,” said the Rev. Norvel Goff, a pre-
siding elder of the 7th District AME Church
in South Carolina, before adding a note of
defiance to a service sprinkled with themes
Church
reopens
to all
Parishioners, strangers
unite after shooting
Another
record
weekend
Why Hollywood
is jumping for
Joy — Back Page
Slammin’ Spieth
Masters champ wins
U.S. Open — Sports
CHARLESTON MURDERS
See REOPEN on Page 9
2. Page 4 Section 1 Daily Herald Monday, June 22, 2015Our Promise to Our Kids
C**
there are more low-income
kids in Illinois schools today
than ever before, and accord-
ing to the Daily Herald/WBEZ
analysis, most of them are
failing the state’s standard-
ized tests.
“You can’t tell me that only
kids in high-wealth, white
neighborhoods have the col-
lege DNA — that’s ridicu-
lous,” said State Superinten-
dent Tony Smith, recently
appointed by Gov. Bruce
Rauner. “There’s something
about how we’re structured
that is sorting opportunity.
We’re wasting massive, mas-
sive human potential by not
figuring out a way to increase
access and support for all of
our kids.”
How poverty affects schools
— and how well schools edu-
cate low-income children
— are vital questions for
Illinois. The population of
low-income students in Illi-
nois has climbed steadily. For
the first time in 2014, more
than half — 51.5 percent
— of Illinois public school
kids were considered low-
income, up from 39 percent
a decade ago. And the num-
ber of schools grappling with
highly concentrated pov-
erty has ballooned in the last
decade.
What the Daily Herald/
WBEZ Poverty-Achievement
Index shows is a shocking
correlation between low-
income students and aca-
demic achievement. In the
past decade, the schools with
the highest number of poor
students always finish at the
bottom, the schools with
the fewest poor students are
at the top, and every other
group is stratified in the mid-
dle. High school standard-
ized test scores show the
exact same trend.
When the state raised the
minimum passing score
on the Illinois Standards
Achievement Test — which
tests third through eighth
graders in reading and
mathematics and grades 4
and 7 in science — scores
dropped across the board,
but the stratification stayed
constant.
To researchers, this indi-
cates a cycle of failure that
has dire consequences for
everyone.
“As Americans, we love
to think of ourselves as liv-
ing in the land of opportunity
— a country where anyone
who works hard can make
it,” said Natasha Ushomir-
sky, a data and policy ana-
lyst at The Education Trust, a
nonprofit that promotes aca-
demic equality, especially for
students of color and those
living in poverty.
But, Ushomirsky said, the
educational opportunities
for affluent and poor kids are
anything but equal.
“The resulting relationship
between schools’ poverty
rates and achievement (flies)
in the face of our national val-
ues,” she asserted.
Robin Steans, executive
director at advocacy group
Advance Illinois, said the
future of poor students mat-
ters for everyone.
“We can either get it right
on the front end or we’re
going to need to support
them as a society,” she said.
“It is easy for people to look
around and say they are com-
fortable with their schools and
that their schools are doing
well, but one way or another
we all pay for it when we leave
kids behind.”
The Poverty-
Achievement Index
The index groups schools
with similar percentages of
low-income students and
compares their academic
performance within that
group. It also shows how the
performance of each income
group compares with the
others.
Statistically, a PAI score
of zero means a school is
performing average for its
income range. Anything
above zero means that
school is doing better than
the average; a school scoring
below zero is doing worse.
Researchers say many fac-
tors play into student success
— language, race, student
growth, expectations, having
role models — but income is
a vital statistic.
“Taking into account the
income of students is incred-
ibly important,” said Kelly
Jones, senior managing
director of partnerships at
Teach for America, a nation-
wide initiative that recruits
young people to commit two
years to teaching in impover-
ished school districts. “That
needs to be part of under-
standing the full context of
who these students are and
what specific challenges they
face.”
“If you are using test
score data in order to deter-
mine the effectiveness of
the school, you have to take
those kinds of demograph-
ics into account,” agreed
Michael Petrilli, executive
director from the Thomas B.
Fordham Institute, an ideo-
logically conservative educa-
tion policy think tank.
The Poverty-Achievement
Index also reveals an unex-
pected bright side — the
low-income schools that
are overachieving and man-
aging to score significantly
higher than what would be
expected. Like:
• John Jay Elementary
School in Mount Prospect,
where 83 percent of stu-
dents are low-income, had
55.1 percent of kids meet or
exceed state standards last
year. That’s below the state-
wide average, but impressive
in their income group, which
averaged only 42.5 percent.
• In 2014, all schools in
Carol Stream Elementary
District 93 scored above
average within their income
groups, which range from 25
to 55 percent low income.
• South Elementary School
in Des Plaines, which in 2014
had 71 percent low-income,
63 percent minority and 53
percent English language
learners — also had 71.6 per-
cent of kids make the grade.
The average in that income
group was 47.2.
See how your schools mea-
sure up at www.dailyherald.
com/lowincome.
Schools can compare
themselves to other like
schools all the way up the
income spectrum. Even in
the strata of least low income
— 0-9.9 percent, where 84
percent of students on aver-
age either met or exceeded
state standards in 2014 —
schools fall on both sides of
the average.
Another surprise: Chicago
Public Schools rises above its
reputation under the lens of
income.
Two-thirds of Chicago ele-
mentary schools had a pos-
itive score on the Poverty-
Achievement Index in 2014.
A decade ago, just half of city
grammar schools had posi-
tive scores. And over time,
of the 100 schools in the
state with the best cumula-
tive Poverty-Achievement
Index scores — schools that
year after year do better than
expected given their poverty
rate — 55 are in CPS.
Why poverty matters
Today there are more than
1 million low-income stu-
dents in Illinois. Some subur-
ban districts have seen their
low-income populations
double or triple in the past
decade and are struggling to
keep up with the changing
demographics.
Researchers and advo-
cates say there are lots of rea-
sons why poverty and lack of
achievement are so tightly
linked.
“One has to do with the
things money can buy,” said
Larry Joseph, director of
research at Voices for Illinois
Children, which advocates
for all children through edu-
cation, health care and family
economics.
“More affluent families can
Poverty: ‘We all pay for it
when we leave kids behind’
In our report, a school with a 0 for a Z score is exactly average. Schools
above average would have a positive Z score while schools below average
would have a negative Z score.
How we used them
To make a more apples-to-apples comparison of Illinois schools, we sorted
them into ranges based on the percentage of low-income students they
serve. Then we
calculated the
average composite
ISAT and PSAE scores
for each range.
With those averages,
we were able to sort
each school based on
how many points
higher or lower it was
from its income
range’s average -
the Z score.
Although Z scores can
be used to compare
schools from different
ranges, our primary goal was to use them as a device to see how a school
performed compared to an average - in this case, the average ISAT score
for schools with similar levels of low-income students.
For example, below is a chart showing how high or low Tefft Middle
School’s ISAT scores were since 2006 when compared to the average for
all schools with similiar percentages of low-income students.
Source: “Statistics Unplugged” by Sally Caldwell, Illinois School Report Card data
Using Z scores allows us to quickly see that Tefft has not just been above
average, but above average in a fairly compelling way for several years.
0 =
| AVERAGE | ABOVE AVERAGEBELOW AVERAGE
-1-2 2 3-3 1
About 68% of
data falls
between
1 and -1.
About 16%
of data falls
below -1.
About 16%
of data falls
above 1.
How data falls within
a normal curve
We can measure how spread out the data is using standard deviations.
A Z score is simply the number of standard deviations something is from
the average.
The normal curve
Z scores are based on the idea of the normal curve: Generally if you have
enough data, most of it will fall around an average. The rest will distribute
on either side of that average.
Number of standard deviations from the average = Z score
ABOVE AVERAGE
BELOW AVERAGE
-2
-1
0
1
2
2006 2007 2008 2009 2010 2011 2012 2013 2014
0 = AVERAGE
DAILY HERALD
WEALTHIEST
LOWEST
PERCENTAGE
OF LOW-INCOME
STUDENTS
POOREST
HIGHEST
PERCENTAGE
OF LOW-INCOME
STUDENTS
0-9.9% LOW INCOME
10-19.9% LOW INCOME
20-29.9% LOW INCOME
30-39.9% LOW INCOME
40-49.9% LOW INCOME
50-59.9% LOW INCOME
60-69.9% LOW INCOME
70-79.9% LOW INCOME
80-89.9% LOW INCOME
90-100% LOW INCOME
Ranges for
elementary
schools
Compared to schools with a similar
percentage of low-income students
Poverty-achievement index
Our index is based on a statistical technique called a Z score that
shows how far something is from the average.
B o b C h w e d y k / bchwedyk@dailyherald.com
From left, Kaylee Bautista, Shyla Rajabali and Emily Bautista use some quiet time to study
before lunch at Tefft Middle School in Streamwood, where nearly 75 percent of students were
considered low-income in 2014.
2004, 2005 ISAT averages
The ISAT tests in 2004 and 2005 were very different than the
ISAT tests in 2006.
Starting in 2006, a different ISAT test was given, more closely aligned with
mandates from No Child Left Behind. New grading scales and “cut” scores
were also introduced.
While the earlier results should not be directly compared to the later
tests — or even to each other, the stratification of scores among the
income levels can still be seen. Here are the average ISAT scores by
income level for 2004 and 2005.
Income
level 2004 ISAT averages 2005 ISAT averages
0-9.9% 82.8 85.7
10-19.9% 76.7 80.8
20-29.9% 73.9 78.3
30-39.9% 70.8 75.1
40-49.9% 66.7 72.6
50-59.9% 63.6 69.7
60-69.9% 58.5 63.9
70-79.9% 51.0 56.4
80-89.9% 46.7 50.5
90-100% 39.3 43.4
Source: Daily Herald analysis of Illinois School Report Card data
DAILY HERALD
Continued from Page 1
See INCOME on Page 5
SUBSCRIPTION RATES
Carrier home delivery rate, daily and Sunday: $702.00 - 52 weeks.
Back issues available at www.dailyherald.com. All back issue orders must be prepaid.
All subscriptions may include up to four Premium Editions per year. For each Premium
Edition your account will be charged an additional $1.00 in the billing period when the
section publishes. Premium issues scheduled to date are: Thanksgiving edition, New Year’s
edition, and an edition at the end of August.
Customer service? Call by noon
Missed paper? Call by 9 a.m.
— 847-427-4333 —
NORTHWEST SUBURBS DAILY HERALD (USPS 032020) is published daily in Arlington Heights
by Paddock Publications Inc., 155 E. Algonquin Road, P.O. Box 280, Arlington Heights, IL 60006.
Periodicals postage paid at Arlington Heights, IL, and additional mailing offices.
POSTMASTER: Send address changes to DAILY HERALD, P.O. Box 280,
Arlington Hts., IL 60006.
Northwest Suburbs
3. Daily Herald Section 1 Page 5Monday, June 22, 2015 Our Promise to Our Kids
*A
invest more resources in their
children’s development ...
health care, adequate nutri-
tion, early learning oppor-
tunities, home comput-
ers, dance lessons, summer
camp and safe and support-
ive neighborhoods,” he said.
“And access to higher quality
schools.”
Poverty takes an emo-
tional toll, too, that affects
academics.
Unstable employment and
financial insecurity increase
family stress, which hurts
the quality of parenting and
family relationships and puts
stress on children who other-
wise would be focusing their
energy on learning, Joseph
said.
Achievement gaps between
poor and middle-class stu-
dents are present even before
kids get to school.
“Some students don’t have
early childhood education
and they are coming into kin-
dergarten already behind,”
said Steans, of Advance Illi-
nois, a group working to drive
more dollars to low-income
students and schools.
“They haven’t had exposure
to letters, numbers or how to
navigate a classroom, how to
sit still, how to work coopera-
tively with others. All of which
makes it harder for them to
catch up.”
Getting to school can be a
challenge in and of itself —
fromdifficultyaffordingtrans-
portation to not having a safe
passage to walk to school, said
Elaine Allensworth, director
of the Consortium on Chicago
School Research at the Urban
Education Institute at the Uni-
versity of Chicago.
“In the poorest areas of the
city you also have students
more likely to be exposed to
traumatic events, to violence,
to having issues with hous-
ing instability,” Allensworth
said.
“These are really, really
stressful events for kids.”
Domestic violence, unsta-
ble families, homelessness,
language barriers and high-
mobility may also come into
play.
The mixture of challenges
that each student faces before
he or she sits down in a class-
room can weigh heavily on
schools.
“Low-income students
need more support from
school in a lot of ways, all of
which cost money,” Steans
said.
* * *
As much as poverty is a
strong indicator of success or
failure, the few exceptions,
like Asa Arreola, show there
is hope. Advocates say we
have to find a way to replicate
those examples on a larger
scale.
Arreola, who found impor-
tant role models among the
Sunny Hill staff, makes it a
point to return occasionally
to share with kids what he’s
learned on his journey.
“I tell them that they need
the courage to keep on
fighting, even when things
get really hard. They need to
just keep on moving,” he
said.
As a child living with his
grandparents, he would see
his mother for a few minutes
before he went to bed each
night.
She always told him the
two most important things in
his life were a good education
and a loving family.
Arreola keeps those lessons
in mind every day.
“Education has been
my only goal,” he said. “I’d
always hoped that if I studied
hard, did well, maybe I could
have a little money and take
care of my family.
“And, if I ever have kids,
maybe they don’t have to
grow up like I did.”
Income: Poverty takes emotional toll as well
Continued from Page 4
B r i a n H i l l / bhill@dailyherald.com
Asa Arreola, a former student at Sunny Hill Elementary in Carpentersville, is now studying biological sciences at DePaul Univer-
sity and hopes to become a doctor. He regularly goes back to his suburban school, where more than 90 percent of students are
low-income, to talk to the children about overcoming hardships.
Low-income
students in Illinois
Half of all public school
students now qualify as low
income.
Source: Illinois School Report Cards
DAILY HERALD
0
10
20
30
40
50
2004YEAR: 2014
39.0%
51.5%
Low-income
students in Illinois
Half of all public school
students now qualify as low
income.
Source: Illinois School Report Cards
DAILY HERALD
0
10
20
30
40
50
2004YEAR: 2014
39.0%
51.5%
On the air
• Radio: Hear Melissa Silverberg and Linda Lutton discuss the
Generations at Risk series on the WBEZ program “Morning Shift,”
airing from 9-10 a.m. today at 91.5-FM.
Look online
• Go to dailyherald.com/lowincome to search the database.
2004
2005
2006
2007
2008
2009
2010
2011
2012
2013
2014
0
10
20
30
40
50
60
70
80
90
100% MEETS/EXCEEDS
0-12.4%
12.5-24.9%
25-37.4%
37.5-49.9%
50-62.4%%
65-74.9%
75-87.4%
87.5-100%
How low income
affects high school scores
Like with elementary schools, the more than 600 Illinois
high schools with more low-income students score
worse on the Prairie State Achievement Exam; those
with fewer low-income students score higher.
DAILY HERALD
Source: Daily Herald analysis of Illinois School Report Card data
2004
2005
2006
2007
2008
2009
2010
2011
2012
2013
2014
0
10
20
30
40
50
60
70
80
90
100% MEETS/EXCEEDS
0-12.4%
12.5-24.9%
25-37.4%
37.5-49.9%
50-62.4%%
65-74.9%
75-87.4%
87.5-100%
LOW-
INCOME
RANGES
How low income
affects high school scores
Like with elementary schools, the more than 600 Illinois
high schools with more low-income students score
worse on the Prairie State Achievement Exam; those
with fewer low-income students score higher.
LOW-
INCOME
RANGES
DAILY HERALD
Source: Daily Herald analysis of Illinois School Report Card data
4. Suburban events at your fingertips
See dailyherald.com/calendar
Use the Daily Herald’s new online calendar
to find suburban events — from plays to
sports to concerts and much more — on
your smartphone or your desktop. And now
it’s easier to submit your own events, too.
dh
Monday, June 22, 2015
NC14
section
Contact us 2
Comics3
Weather4
dailyherald.com
5Northwest Suburbs
Today there are more than 1 million low-
income students in Illinois, and where they live
hasshiftedconsiderablyoverthepastdecade.
ADailyHeraldandWBEZanalysisofadecade
of data from the Illinois State Board of Educa-
tion’s school report cards revealed trends where
student poverty has gone down, up, or skyrock-
etedinthepast10years.
In 2004, more than 45 percent of low-income
public school students in Illinois attended Chi-
cago Public Schools. Today it’s 32 percent, and
falling.
There are 29,000 fewer low-income kids in
CPS than there were a decade ago. They didn’t
allmovetothesuburbs,althoughsomedid.Oth-
ers chose private schools; still others dropped
out.
Meanwhile, on average, Illinois school dis-
trictshaveseena15percentagepointincreasein
theirlow-incomepopulations.
Statewide,2,244schoolssawtheirlow-income
populations rise by 10 percentage points or
more, while only 61 schools saw a decrease,
accordingtoouranalysis.
• In Elgin Area Unit District U-46, the num-
ber of low-income students has nearly doubled
in 10 years. U-46 now has 24,003 low-income
students, more than any school system outside
of Chicago. Ten years ago the Rockford Public
SchoolswereNo.2.
• In 2004, Indian Prairie CUSD 204 — in
Naperville, Aurora and Bolingbrook — enrolled
780low-incomekidsoutof26,147studentstotal,
just 3 percent of its student body. Today Dis-
trict 204 has 5,088 low-income kids, 18 percent
of all students. The district is 20th in Illinois for
the number of low-income students it serves; a
decadeago,itwasnotinthetop100.
• Joyce Kilmer Elementary School in Buffalo
Grove was 10.5 percent low-income in 2004. A
decade later, 63 percent of its students are low-
income and, as a whole, Wheeling Township
Elementary District 21 is educating more than
twice the number of poor students — up from
2,086to4,209—thanithad10yearsago.
Jason Klein, chief information officer at Dis-
trict 21, said when he started teaching at Lon-
don Middle School in Wheeling in 1998 the low-
income rate was below 15 percent. The school
consideredthathigh.
“That’s nothing compared to what we see
today,” he said. In 2014, London was 53 percent
low-income.
“I think there has been a significant shift. We
seeitwithlow-incomenumbers,withhomeless-
ness numbers and with the challenges our stu-
dentsbringtoschool.”
Theshiftingdemographicshavebeenhardfor
suburban districts that historically are not used
to dealing with large populations of low-income
students. Klein said it will take time for school
districtstocatchup.
“There’s often a lag between when a school or
district’s demographics change and when the
staff and community realizes that it’s changed,”
he said. “People in the suburbs may not realize
the range of conditions of people living around
them.”
One suburban educator with a laser fix on the
issueisKennethEnder,presidentofHarperCol-
legeinPalatine.
Ten years ago only four schools in Harper’s
area were more than 50 percent low-income.
Today,thatnumberis25.
Harper has assigned ambassadors to each of
thoseschoolstoworkwithstudents—including
elementary schools — to introduce the idea of
collegeearlyandgetstudentsonthatpath.
“We’ve got to lift up every student, that’s the
challenge,” Ender says. “I don’t see a bright
future for us, our kids and our grandkids if we
can’t bring everybody along. The stakes are very
high.”
The causes behind the shifts in poverty are
layered.
“Tenyearsagowecouldn’thaveguessedwhat
the impact of the recession would be and that
it (affected) people across the socioeconomic
spectrum,”Kleinsaid.“Itreallythrewpeopleina
lotofdifferentcircumstancesforaloop.”
The changing U.S. economy is also a fac-
tor, Ender said. Jobs that used to require only a
high school diploma and hard work are rare if
not nonexistent, and students now need some
kind of postsecondary training for nearly every
career.
“The world changed and we weren’t paying
attention,”hesaid.“Therequirementsforagood
job changed and we kept acting as if the peo-
ple who historically got jobs without education
wouldbeOK.”
Meanwhile, the number of concentrated,
high-poverty schools in Illinois — where nearly
every child is considered low-income — has
swelledfrom421schoolsin2004to649in2014.
The Daily Herald/WBEZ analysis shows that
17 percent of all public school students in the
state now attend schools where 90-100 percent
ofstudentsarelow-income.
Our Promise To Our Kids
Generations at Risk
C o u r t e s y o f J e s s L o r e n , S o c i a lT e c h P o p
Slide the City, featuring a 1,000-foot water-
slide, will come to downtown Algonquin in
August.
By Lauren Rohr
lrohr@dailyherald.com
Tickets are on sale for what event coor-
dinators call the “biggest slip ‘n slide you
could ever imagine,” which will take over
North Main Street in Algonquin for a
weekend this summer.
Slide the City, an event that will take
place from 10 a.m. to 8 p.m. Saturday and
Sunday, Aug. 15 and 16, features a 1,000-
foot waterslide made of the same material
as a bouncy house.
The location for this particular event
was chosen because of the hill on Route
31, said Jess Loren, event coordinator and
Cary resident.
“Illinois is very flat, but the slide needs
a large hill,” she said. “That’s all it really
takes — a hill and a very courageous, for-
ward-thinking village to see the benefits of
the event.”
The Algonquin event will feature more
than just the slide,
Loren said. A festi-
val with food, drinks,
live music and
events for kids will
also take place that
weekend.
The weekend-long
festival is organized
almost entirely by
SocialTechPop, an
event planning com-
pany, and Slide the
City.
However, Katie
Gock, recreation
coordinator for the
village, said she
has been working
behind the scenes
on important details,
such as securing the
location, organizing security and safety
measures, handling crowd control and giv-
ing Slide the City special event permits.
“I’m really excited that they reached
out to us to have the event in Algonquin,”
Gock said.
“Slide the City is a nationally known
event. It really puts us on the map.”
Slide the City began when a group of
friends who lived in Salt Lake City wanted
to create a family-friendly form of enter-
tainment. They created a prototype for the
giant slip ‘n slide and have since brought
the event nationwide, Loren said.
SocialTechPop partnered with Slide the
City in February to bring the event to eight
additional states, including three towns in
Illinois, she added.
“We hope to bring a lot of people to the
area and help support the local economy,”
Loren said. “We want people to see how
beautiful it is by the river and all the busi-
nesses downtown has to offer.”
Gock said the slide will be very well
received in the village.
“I really think the residents are so
excited to have this opportunity to have a
national event come to our smaller town,”
she said. “There’s a lot of buzz about it.”
Tickets for the Algonquin festival begin
at $5 per person; free for kids 12 and
younger.
Slide tickets are sold separately and can
be purchased for $15 per slide until July 10,
$20 per slide from July 11-31 and $25 per
slide Aug. 1-14. Slide tickets are $30 on the
day of the event.
Special family and friend pack-
ages and multiple-ride deals are avail-
able at socialtechpop.com/events/
slide-the-city-algonquin-il/
1,000-foot
waterslide
to hit streets
of Algonquin
“I really think
the residents
are so excited
to have this
opportunity to
have a national
event come
to our smaller
town. There’s
a lot of buzz
about it.”
Katie Gock
Story by
Melissa Silverberg
and Linda Lutton
Daily Herald and WBEZ Chicago
Research, Graphics by
Tim Broderick
Daily Herald
Poverty explosion
In 10 years, suburban schools went from few low-income students
to grappling with large numbers of them
MORE ONLINE
Find out how your school measures
up with our Poverty-Achievement
Index at dailyherald.com/lowincome
The team behind Generations at Risk
DAILY HERALD
2014 Rank in % chg. in # of
rank District 2004 poor students
1 City of Chicago SD 299 1 -8.1%
2 Elgin- Area U-46 3 82.2%
4 Cicero SD 99 4 17.9%
5 Waukegan CUSD 60 7 27.5%
6 Joliet PSD 86 11 86.6%
7 Valley View CUSD 365U 13 146.1%
8 Aurora East USD 131 9 51.9%
11 Dundee USD 300 12 106.5%
12 Aurora West USD 129 17 100.7%
16 Plainfield SD 202 * 1,049.9%
17 Round Lake CUSD 116 18 52.2%
18 Palatine CCSD 15 31 108.5%
20 Indian Prairie CUSD 204 * 552.3%
21 Maywood-Melrose Park-Broadview 89 14 18.0%
24 Oswego CUSD 308 * 481.3%
25 Wheeling CCSD 21 45 101.8%
31 Joliet Twp HSD 204 25 41.6%
34 CHSD 218 55 109.6%
35 Township HSD 211 71 193.1%
36 Elk Grove Township SD 59 52 107.3%
39 Wheaton-Warrenville SD 200 51 92.3%
40 Schaumburg CCSD 54 75 189.0%
43 Crete Monee CUSD 201U 43 55.7%
44 Chicago Heights SD 170 27 15.0%
45 Cook County SD 130 30 19.9%
46 Woodstock CUSD 200 50 77.9%
47 Dolton SD 149 24 7.6%
49 North Chicago SD 187 29 13.8%
Poverty shifts to the suburbs
The influx of low-income students has changed the face
of some suburban school districts
46
17
5
49
11
2
34
35
12
8 20
39
24
16
7
31
43
1
25
21
4
45
47
44
6
18
40 36
* Not in top 100 for 2004 | Source: WBEZ, Daily Herald analysis of Illinois State Report Card data
Change
School districts
in the six-county
area that are among
the top 50 in
low-income students
WILL
COUNTY
COOK
COUNTY
COOK
COUNTY
DUPAGE
COUNTY
KENDALL
COUNTY
KANE
COUNTY
MCHENRY
COUNTY
LAKE
COUNTY
00 Unit district
Rank
00 Elementary school
district Rank
00 High school
district Rank
Melissa
Silverberg
A reporter at the
Daily Herald since
2011, Silverberg
regularly covers
Arlington Heights
and Northwest
Suburban High
School District
214. For several years she has been
a part of the Daily Herald’s report
card team, which analyzes and
reports data released annually by
the Illinois State Board of Education.
The 2014 series won first place in
education reporting from the Illinois
Press Association. A graduate of the
University of Illinois, she grew up in
Lake County and currently lives in
Palatine.
Tim Broderick
News Presentation
Editor Tim Broderick
has been a part of the
coverage for many
important suburban
news stories,
including the Brown’s
Chicken murders,
two trials for Illinois
governors, in depth reporting on issues
such as heroin in the suburbs, red light
cameras, state pensions and continuing
coverage on subjects such as school
report cards and state budget woes.
His multiple honors include the Chicago
chapter of the Society of Professional
Journalists and the Illinois Press As-
sociation. A graduate of Eastern Illinois
University, Tim has lived in and around
Chicago his entire life.
Linda Lutton
An award-winning education
reporter at WBEZ-91.5FM, Lutton
is wrapping up a 2014-15 Spencer
Fellowship in Education Report-
ing, examining poverty’s impact
on school outcomes. Her WBEZ
reporting has examined the dropout
crisis, race and segregation, school
performance and how gun violence
affects youth and schools. She worked on the 2013
This American Life “Harper High School” episodes,
which won a 2014 Peabody Award, an Alfred I.
duPont-Columbia University Award and the Education
Writers Association’s Fred M. Hechinger Grand Prize
for Distinguished Education Reporting. She won EWA’s
Grand Prize in 2005 for her investigation into a corrupt
suburban Chicago school superintendent and a 2004
Studs Terkel Award for reporting on Chicago’s diverse
communities. Lutton graduated from the University of
Wisconsin-Madison and lives in Pilsen.
Linda
Lutton
Melissa
Silverberg
Tim
Broderick
Photo of Linda Lutton courtesy of Spencer Education Journalism Fellowship, Columbia University