1. Metabolomics of Neuronal CellsMegan Gant, Marie Phelan, Jill Madine
Introduction
Neurodegenerative disease is becoming a growing problem in our ageing
society and has been described as 'the new cancer'. However, there is still
no cure. Current treatment can only begin once the condition is detected,
but in the case of Alzheimer's disease (AD) patients are often in an
advanced stage of the disease by the time a conclusive diagnosis is
possible.
Amyloid-beta (Aβ) is a misfolded protein which is considered to be one of
the major driving factors of AD. The two most studied of these proteins are
Aβ40 and Aβ42. Whilst Aβ40 is the most abundant in the AD brain, it is
estimated that Aβ42 does the real damage due to its longer length and
resulting higher aggregation potential.
The α-synuclein (α-syn) protein is a naturally occuring protein in the brain
neurons which can become overexpressed and therefore aggregate to form
insoluble plaques called Lewy bodies. The presence of Lewy bodies is a key
factor in many neurodegenerative diseases, such as Parkinson's disease.
Aβ42 and α-syn both aggregate to form insoluble plaques and both have a
similar aggregation pathway.
Methods Analysis
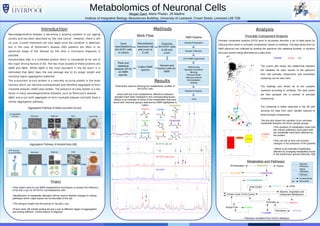
Principle Component Analysis
Principle component analysis (PCA) aims to accurately describe a set of data points by
reducing them down to 'principle components' based on similarity. The data points from an
NMR spectrum are collected by dividing the spectrum into statistical buckets, or sections
and each section being described as a data point.
Control α-syn Aβ
The scores plot shows the relationship between
the variables for each section of the spectrum
from two principle components and sometimes
clustering can be seen here.
The loadings plot shows all of the samples
clustered according to similarity. The data points
are then grouped into a number of principle
components.
The clustering is better observed in the 3D plot
showing the data from each sample reduced to
three principle components.
Results
Preliminary spectra showing the metabolomic profiles of
SH-SY5Y cells
Areas with the most metabolomic difference between
samples have been enlarged in the corresponding boxes.
.Below is an example of some of the metabolites that were
found with chemical groups detected by NMR highlighted in
colour:
Project
●This project aims to use NMR metabolomics techniques to assess the influence
of Aβ and α-syn on SH-SY5Y neuroblastoma cells
●Identification of metabolite alteration will be used to identify changes in cellular
pathways which might impact the functionality of the cell
●The will give insight into the toxicity of Aβ and α-syn
●Future work will include testing Aβ and α-syn at different stages of aggregation
and testing different conformations of oligomer.
Institute of Integrative Biology, Biosciences Building, University of Liverpool, Crown Street, Liverpool L69 7ZB
Alanine Lactate
Glutamine
Metabolites and Pathways
Acetate Creatine Glutamate
Citrate Cycle (TCA Cycle)
Alanine, Aspartate and
Glutamate Metabolism
L- AlaninePyruvate
Acetyl-CoA Acetate
L-Lactate
Urea Cycle Creatine Urea
L-GlutamateSuccinate
L-Glutamine
Pathways simplified from KEGG database
Between
Pathways
Within
Pathways
Pathway
Unidirectional
Reversible
SH-SY5Y with Aβ
SH-SY5Y with α-syn
SH-SY5Y
2-oxa glutarate
Succinate
2 Oxa
Glutarate Glucose
Glycolysis Glucose
PurineAminosugars
The box plot shows the variation of an unknown
metabolite between the three sample groups
Control
α-syn
Aβ
●The variation of metabolites mean that
the cellular pathways associated with
the metabolite have been affected by
the protein.
●This can tell us how cell function
changes in the presence of the proteins.
● Below is an example of pathways
affected by changing metabolites found
in the preliminary spectra (Results, left).