1. MOTIVATION
PURPOSE
RESULTS
NOTABLE EXPERIMENTS
*
.
EQUIPMENT
ACKNOWLEDGEMENTS
Using High Sensitivity
Pressure Measurements
for the Detection of Infrasound
Maxwell Perham
Dangerous weather causes billions
in damages and kills thousands
every year. Tornados, one kind of
extremely dangerous weather
formations, emit low frequency
infrasound during their startup
cycles, and high performance
barometers have the capability to
detect infrasound. Using the
current method of signal filtering,
the ambient wind noise often
overpowers these signals. Because
tornados tend to form in or near
areas with high winds this
severely limits the effectiveness of
this technique.
To learn about the nature of these infrasound
signals while working towards the development
of a small scale physical wind filter for use in the
detection of infrasound signals in areas with high
wind noise.
To develop my understanding of infrasound
signals and filtering methods I was given two
Paroscientific 6000-16 B barometers and a
Digiport filter.
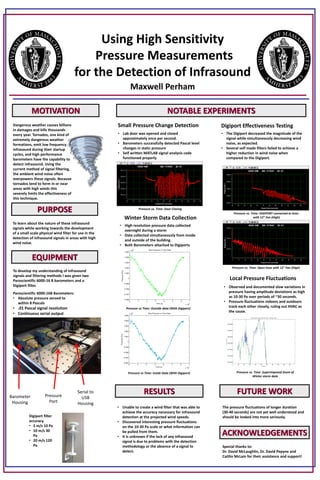
Small Pressure Change Detection Digiport Effectiveness Testing
• Unable to create a wind filter that was able to
achieve the accuracy necessary for infrasound
detection at the projected wind speeds.
• Discovered interesting pressure fluctuations
on the 10-30 Pa scale or what information can
be pulled from them.
• It is unknown if the lack of any infrasound
signal is due to problems with the detection
methodology or the absence of a signal to
detect.
FUTURE WORK
• The Digiport decreased the magnitude of the
signal while simultaneously decreasing wind
noise, as expected.
• Several self made filters failed to achieve a
higher reduction in wind noise when
compared to the Digiport.
Paroscientific 6000-16B Barometers:
• Absolute pressure zeroed to
within 8 Pascals
• .01 Pascal signal resolution
• Continuous serial output
Digiport filter
accuracy
• 5 m/s 10 Pa
• 10 m/s 30
Pa
• 20 m/s 120
Pa
Barometer
Housing
Serial to
USB
Housing
Pressure
Port
• Lab door was opened and closed
approximately once per second.
• Barometers successfully detected Pascal level
changes in static pressure
• Self written MATLAB signal analysis code
functioned properly
Winter Storm Data Collection
Local Pressure Fluctuations
• High resolution pressure data collected
overnight during a storm
• Data collected simultaneously from inside
and outside of the building.
• Both Barometers attached to Digiports
• Observed and documented slow variations in
pressure having amplitude deviations as high
as 10-30 Pa over periods of ~30 seconds.
• Pressure fluctuations indoors and outdoors
track each other closely, ruling out HVAC as
the cause.
The pressure fluctuations of longer duration
(30-40 seconds) are not yet well understood and
should be looked into more seriously.
Special thanks to:
Dr. David McLaughlin, Dr. David Pepyne and
Caitlin McLain for their assistance and support!
Pressure vs Time: Inside Data (With Digiport)
Pressure vs Time: Outside data (With Digiport)
Pressure vs. Time: DIGIPORT connected to hose
with 12” Fan (High)
Pressure vs. Time: Open hose with 12” Fan (High)
Pressure vs. Time: Superimposed Zoom of
Winter storm data
Pressure vs. Time: Door Closing