Read the attached article and answer the following questions, chec.docx
credit-scoring-vs-probability-of-default
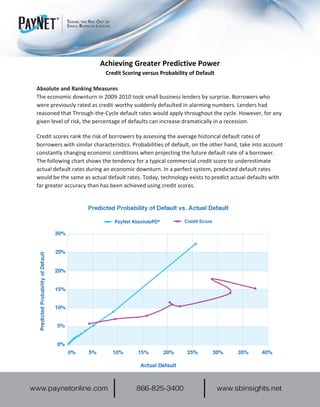
1. Achieving Greater Predictive Power
Credit Scoring versus Probability of Default
Absolute and Ranking Measures
The economic downturn in 2009-2010 took small business lenders by surprise. Borrowers who
were previously rated as credit-worthy suddenly defaulted in alarming numbers. Lenders had
reasoned that Through-the-Cycle default rates would apply throughout the cycle. However, for any
given level of risk, the percentage of defaults can increase dramatically in a recession.
Credit scores rank the risk of borrowers by assessing the average historical default rates of
borrowers with similar characteristics. Probabilities of default, on the other hand, take into account
constantly changing economic conditions when projecting the future default rate of a borrower.
The following chart shows the tendency for a typical commercial credit score to underestimate
actual default rates during an economic downturn. In a perfect system, predicted default rates
would be the same as actual default rates. Today, technology exists to predict actual defaults with
far greater accuracy than has been achieved using credit scores.
2. Credit Scoring
Credit scores base predictions of future borrower behavior on the past. A typical credit scoring
system relies on data from observing a large number of borrowers who have performed
satisfactorily and unsatisfactorily on their loans. This data is statistically analyzed to calculate
the historical odds of unsatisfactory performance. The historical odds are then scaled in a
range, typically 450-800.
Credit scores are good for identifying the relative risk of borrowers in a population. By
evaluating individual borrower traits, credit scores assess the likelihood that a borrower will
exhibit the characteristics associated with unsatisfactory performance.
However, credit scores only consider borrower characteristics, rather than economic factors.
They are limited by the view of unsatisfactory performance painted by the historical sample
used in their construction. For this reason, credit scores are unable to adjust to new economic
conditions that are outside the bounds of the original sample, and suffer from “odds shifts”
during changing economic conditions.
The following chart shows the changing default rate of a credit score over successive years.
Note, for example, the 660-679 scores exhibit a default range from 2.5% to 6.4% over a 4-year
period. Also note the rapid shift in odds from year to year. Odds shifts may be significant
enough to cause unexpected credit losses when lenders fail to adjust their loan origination
policies. In addition, surprises can occur when financial institutions assume the default rate at
the time of origination will remain the same for the life of the loan.
A more predictive default management system is needed to reduce uncertainty and avoid
surprises.